Abstract
Neuronal exocytosis is mediated by the SNARE proteins synaptobrevin 2/VAMP, syntaxin 1A, and SNAP-25A. While it is well-established that these proteins mediate membrane fusion after reconstitution in artificial membranes, it has so far been difficult to monitor intermediate stages of the reaction. Using a confocal two-photon setup, we applied fluorescence cross-correlation spectroscopy (FCCS) and fluorescence lifetime analysis to discriminate between docking and fusion of liposomes. We show that liposome populations that are either non-interacting, or are undergoing docking and fusion, as well as multiple interactions can be quantitatively discriminated without the need for immobilizing the lipid bilayers. When liposomes containing a stabilized syntaxin 1A/SNAP-25A complex were mixed with liposomes containing synaptobrevin 2, we observed that rapid docking precedes fusion. Accordingly, docked intermediates accumulated in the initial phase of the reaction. Furthermore, rapid formation of multiple docked states was observed with on average four liposomes interacting with each other. When liposomes of different sizes were compared, only the rate of lipid mixing depended on the liposome size but not the rate of docking. Our results show that under appropriate conditions a docked state, mediated by trans-SNARE interactions, can be isolated that constitutes an intermediate in the fusion pathway.
Keywords: fluorescence cross-correlation spectroscopy, fluorescence lifetime analysis, fusion intermediate, single-particle detection, SNAREs
Intracellular membrane fusion is a hallmark of eukaryotic life. Most intracellular fusion processes are mediated by SNARE proteins that represent an evolutionarily conserved family of small membrane proteins (1). All SNAREs share a homologous sequence of 60–70 amino acids arranged in heptad repeats, referred to as SNARE motifs, which can be classified in four subfamilies (2). Appropriate sets of SNARE motifs assemble into stable bundles of four α-helixes, termed SNARE complexes, with each subfamily contributing one helix to the complex. For fusion to occur, SNARE complexes form between complementary sets of SNAREs that are localized in the two membranes destined to fuse. According to current concepts, complex formation is initiated at the N-terminal ends of the SNARE motifs, leading to a trans complex that connects the membranes. Complex formation then proceeds from the N-terminal end toward the C-terminal membrane anchors (“zippering”) which initiates fusion [see (3–5) for recent reviews].
Fusion of artificial phospholipid vesicles (liposomes) reconstituted with SNARE proteins has been an important tool for studying the mechanisms of SNARE-mediated membrane fusion (6, 7). In these studies, lipid mixing is routinely measured in solution with one of the vesicle populations containing lipids labeled with two different fluorophores at quenching concentrations. Fusion with unlabeled vesicles results in a dilution of the labeled lipids in the plane of the membrane and fluorescence dequenching (8). Using this assay, it was shown that SNARE-mediated membrane fusion shares important characteristics with biological membrane fusion reaction [e.g., inhibition by clostridial neurotoxins and lysophospholipids, the requirement for anchorage of SNAREs via transmembrane regions (9)], substantiating the view of SNAREs acting as a minimal machinery for membrane fusion (10, 11). However, it has been difficult to unravel the mechanisms of regulatory proteins such as synaptotagmins, complexins, and SM-proteins, leading to conflicting results (12–17).
In a first approximation, the fusion pathway can be divided into two steps. First, freely diffusing liposomes collide and form a docked but yet unfused intermediate, in which the two membranes are bridged by trans-SNARE complexes. In a second step, docked liposomes fuse resulting in cis-SNARE complexes. Moreover, fused liposomes may undergo additional rounds of fusion. The fluorescence dequenching assay used by most laboratories does not allow for assessing the relative contribution of these steps on the overall fusion kinetics, and it is thus not possible to discriminate the effect of regulatory proteins on docking and fusion.
To overcome this limitation, techniques were developed involving either planar membranes or immobilized vesicles which allow for discriminating between vesicle binding and membrane merger (18–22). While these approaches constitute considerable progress, the need for immobilizing membranes limits experimental throughput, and it cannot be excluded that surface attachment alters the biophysical properties of the membrane. Here we describe a procedure that is based on detection and analysis of low numbers of freely diffusing liposomes in a confocal microscope. A combination of fluorescence resonance energy transfer (FRET) and fluorescence cross-correlation spectroscopy (FCCS) allows for a distinction and concurrent quantification of different states of liposome fusion: non-interacting liposomes, tightly interacting liposomes where lipids of the two membranes are not mixed (in the following called “docked”) and liposomes where lipid mixing has occurred (“fused” liposomes). It is also possible to detect multiple interacting liposomes. The liposomes diffuse freely in an aqueous environment without any interference by supporting or immobilizing materials. Using this method, we measured vesicle docking and fusion of liposomes containing the neuronal SNAREs syntaxin 1A, SNAP-25A, and synaptobrevin 2, using a stabilized Q-SNARE acceptor complex that was shown previously to result in rapid fusion (23). Our data show that under these conditions docking is considerably faster than fusion, resulting in a time-dependent accumulation of docked intermediates.
Results
To measure SNARE-mediated vesicle docking and fusion, we used liposomes that were either reconstituted with synaptobrevin 2 or with a preformed complex of SNAP-25A and syntaxin 1A that was stabilized by a fragment of synaptobrevin 2 corresponding to the C-terminal part of the SNARE-motif (residues 49–96). It was shown previously that this complex contains a free N-terminal binding site for synaptobrevin 2, allowing for fast binding. When these liposomes are mixed, fusion is rapid, with the stabilizing R-SNARE fragment being displaced during the reaction (23, 24). Liposomes were labeled with Oregon Green (usually containing a stabilized acceptor complex) or with Texas Red, resulting in robust FRET upon fusion (25). Lipid mixing is commonly used as a read-out for fusion, despite some caveats (26).
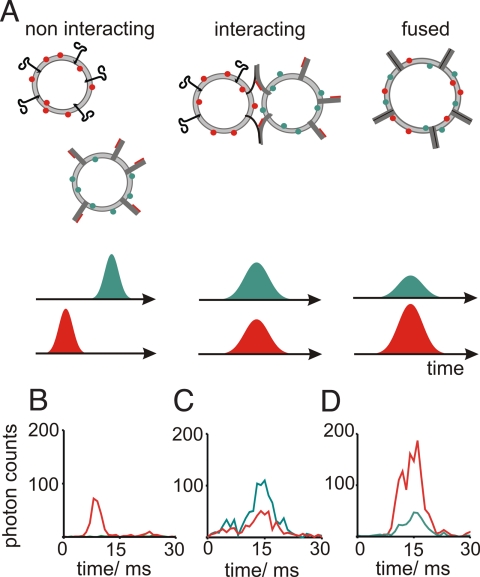
In a first step, we characterized signals observed from individual liposomes or liposome pairs diffusing through the detection volume of the confocal setup. For this, we diluted samples to a concentration of about 0.1 liposomes per focal volume to assure that the observed fluorescence bursts were produced by single freely diffusing particles, and analyzed if the bursts on the two detectors were temporally correlated. Simultaneous signals on both detectors represent either docked or fused liposomes while individual liposomes generate temporally independent signals (Fig. 1A). As expected, no correlation between photon bursts in the red and green channel was observed when red and green liposomes both contained synaptobrevin 2 (Fig. 1B). In contrast, a fluorescence burst from a fusing sample 2 min after mixing the donor and acceptor liposomes shows correlated intensity fluctuations in both channels because of simultaneous diffusional movements through the detection volume (Fig. 1C). In the case shown in Fig. 1C, the intensities of the fluorescence signals in both channels are comparable as typically seen in the onset of the fusion reaction, which indicates a liposome pair that is docked but not yet fused. Finally, Fig. 1D shows an example of a burst obtained from the same reaction as in Fig. 1C, but 2 h after mixing, that is, when fusion is largely completed. Again, the fluctuations of the fluorescence signals in both channels are correlated. However, the intensity of the red acceptor fluorescence is larger than that of the green donor fluorescence, indicating FRET between fluorophores after membrane merger.
Fig. 1.
Distinction of different states of liposome fusion by single burst analysis. (A) Liposome populations expected in a typical fusion reaction and the hypothetical fluorescence bursts of photons on the two detectors expected for the various liposome populations: uncorrelated (Left), and temporally correlated for docked (Center), and lipid mixed liposomes (Right). Liposomes containing the two different classes of SNARE proteins are labeled with Oregon Green and Texas Red. Using a confocal two-photon setup, the dyes are excited simultaneously and are spectrally separately detected. Docked but unfused liposomes show no FRET, and thus the burst intensities in each channel equal to the ones of non-interacting liposomes. In liposomes that underwent lipid mixing FRET is observed, which results in an increase of the red fluorescence and a decrease of the green fluorescence. (B–D) Measured fluorescence bursts of (B) non-interacting liposomes (containing only synaptobrevin 2), (C) fusing liposomes after 2-min fusion time, and (D) fusing liposomes after 2-h fusion time.
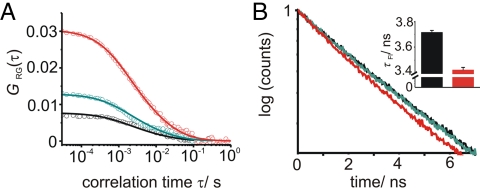
For single burst analysis the sample needs to be very dilute, and thus fluorescence events are rare. Consequently, long recording times are needed to obtain statistically significant results, which is not compatible with measuring fusion reactions exhibiting fast kinetics. To measure the proportion of double- versus single-labeled vesicles at higher concentrations of liposomes we used FCCS, which allows for the detection of up to a 100 particles per focal volume instead of 0.1 for the burst analysis. In this concentration range, even small changes in the number of liposomes diffusing in and out the focal volume still cause significant fluctuations in the fluorescence signal. Correlation or cross-correlation of fluorescence signal therefore gives accurate information about the number of liposomes present in the focal volume. The amplitude of a typical cross-correlation curve GRG,0 obtained by FCCS for small correlation times τ is proportional to the number of double-labeled particles in a sample (SI Appendix and Fig. S1). When SNAP-25A/syntaxin1A-liposomes were mixed with liposomes reconstituted with full-length synaptobrevin 2 the cross-correlation amplitude GRG,0 as a measure of the number docked or fused liposomes increased (Fig. 2A, black, green and red curves indicate measurements 0.5 min, 3 min, and 60 min after liposome mixing, respectively). To distinguish the population of fused from docked liposomes, we simultaneously measured lipid mixing by the decrease of the fluorescence lifetime of the donor dye as an accurate read-out for FRET (Fig. S2) (25). In contrast to the cross-correlation, no changes in the fluorescence lifetime were observed immediately after mixing (black and green curve in Fig. 2B). However, after 60 min, a significant decrease in the fluorescence lifetime was detected (red curve in Fig. 2B). As expected, no increase in the cross-correlation or decrease in the donor fluorescence lifetime was observed in samples where the interaction between the Q- and R-SNAREs was prevented by incubation with a soluble fragment of synaptobrevin 2 showing that the signal changes require trans-SNARE pairing.
Fig. 2.
FCCS and fluorescence lifetime analysis of a fusion reaction. (A) Open circles: FCCS curves at 30 s (black), 3 min (green), and 60 min (red) of a fusion reaction of liposomes containing a stabilized acceptor complex of SNAP-25A, syntaxin 1A and synaptobrevin 2. Solid lines: corresponding theoretical fitting curves according to equation S4. (B) Corresponding normalized fluorescence decay curves of the donor dye. Inset of (B) Average values for nine 10-s measurements of the fluorescence lifetime at 0 min (black) and 60 min (red) fusion time are shown. Error bars correspond to the standard deviations.
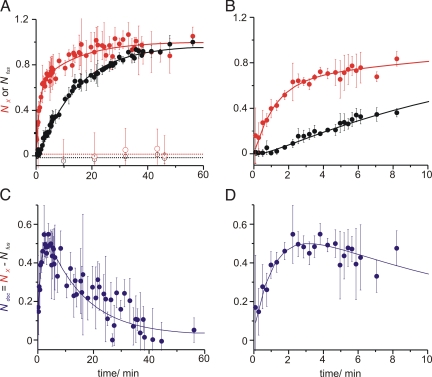
Analysis of FCCS and fluorescence lifetime curves at various time points during a fusion reaction yielded the proportion of double-labeled (i.e., docked and lipid mixed) particles and lipid mixed liposomes (NX and Nfus, respectively) over the course of the reaction (Fig. 3A; Fig. 3B shows the first 10 min of the reaction; see also Fig. S3 and SI Appendix for a detailed description of the analysis). As shown in Fig. 3, the comparison of the time courses of Nfus and NX revealed significant differences. In the initial phase, that is, immediately after mixing of the liposomes, the proportion of double-labeled species NX increases much faster than the proportion of fused liposomes Nfus. The difference between NX and Nfus corresponds to the relative number of docked but non-lipid mixed vesicles:
As shown in Fig. 3 C and D, Ndoc reaches a maximum of about 50% of the overall liposome population about 2 min after mixing and then declines, showing that under our reaction conditions a relatively stable intermediate docked state exists.
Fig. 3.
Docking and fusion kinetics. Kinetics of a lipid mixing reaction of liposomes containing SNAREs as described in Fig. 2 and measured with FCCS and donor fluorescence lifetime analysis. For each time point the cross-correlation amplitudes and the fluorescence lifetimes were determined. Error bars, standard deviation over a 90-s time period and of two experiments with independent liposome preparations. (A) Normalized approximate number of fused liposomes (Nfus, black dots) compared to the number of fused and docked liposomes (NX, red dots). Open symbols stand for reactions in which fusion was inhibited by a soluble synaptobrevin 2 fragment (lines are linear fits). Nfus was derived from the energy transfer rate which is proportional to the number of fused liposomes (see SI Appendix). (B) shows the first 10 min of (A) in detail. (C) The difference in the kinetics of formation of double-labeled particle-, NX, and fused liposome (Nfus)-populations can be explained by an intermediate population of docked liposomes, Ndoc. (D) shows the first 10 min of (C) in detail. To all three curves bi-exponential functions (solid lines, Ndoc = NX − Nfus = A1e−t/τ1 + A2e−t/τ2) were fitted with time constants τ1 = 70 s for docking and τ2 = 840 min for lipid mixing, revealing a delay between the two reaction steps.
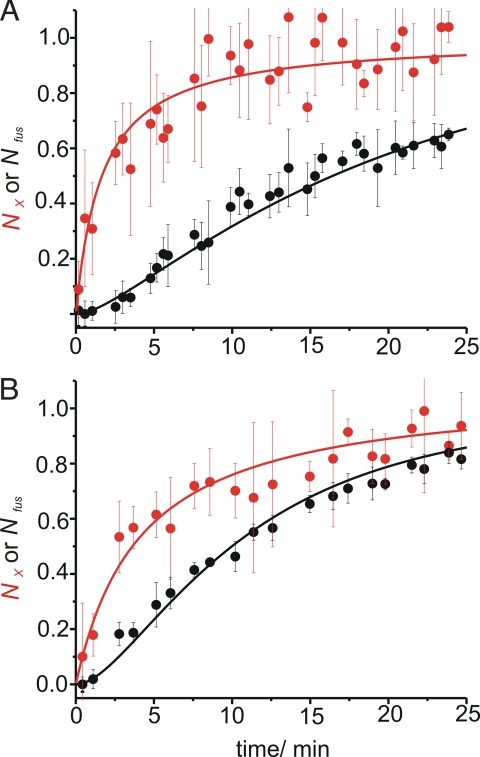
To gain insights into the influence of size on the fusion kinetics we compared liposomes of a diameter of 30 nm as shown in Fig. 3 to liposomes with a 100-nm diameter (Fig. 4). In these experiments lower protein concentrations were used since the reconstitution of the stabilized acceptor complex into large liposomes at high protein density showed considerable variability in size (see SI Appendix). While the speed of docking was comparable, a clear difference between the fusion speed for large and small liposomes was observable. The larger liposomes display a lag phase in lipid mixing that is prolonged about 2- to 3-fold relative to the smaller liposomes. The data suggests that the stability of the docked intermediate is influenced by liposome size which in turn may reflect curvature and membrane elasticity effects.
Fig. 4.
Comparison of liposomes of different sizes. Normalized approximate number of fused liposomes (Nfus, black dots) compared to the number of fused and docked liposomes (NX, red dots) for a fusion reaction of liposomes containing a stabilized acceptor complex (labeled with 0.5% Oregon Green) and synaptobrevin 2 (labeled with 1% Texas Red) at protein to lipid ratios of 1:500 at 35 °C. Diameter of the liposomes was approximately 100 nm (A) and 30 nm (B). Data analysis was conducted as for Fig. 3. Lines are fits according to the equations presented in Fig. 6.
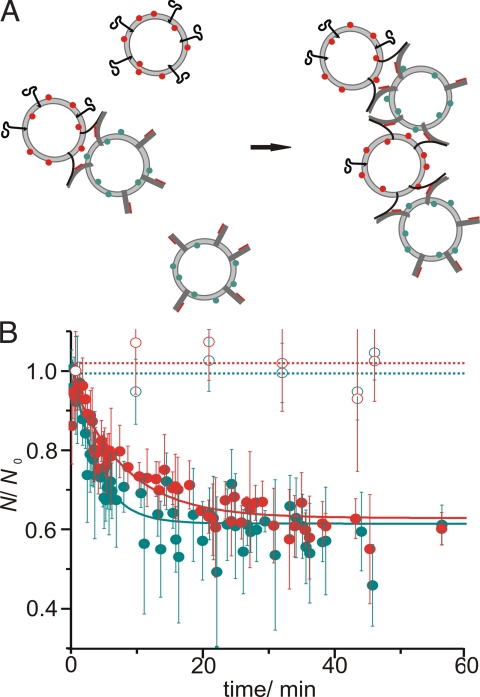
It has been suggested previously that in SNARE-mediated fusion of liposomes multiple rounds of fusion can take place (27). However, the extent to which multiple fusions occur was only determined indirectly using the standard fluorescence dequenching assay. With fluorescence correlation spectroscopy the extent of multiple interacting liposomes can be measured easily because FCS allows for the independent determination of red- and green-labeled liposomes, NR and NG, respectively, regardless of whether the labeled particle contains exclusively red or green or both types of fluorescence labels (Fig. S4). Therefore, when liposomes dock or fuse only once, the counted number of red and green liposomes does not change because docked and fused liposomes are counted independently in each channel. However, if a docked or fused liposome interacts again with one or more liposomes, the number of the corresponding species decreases. The reduction in the number of liposomes during the fusion thus allows determining how many red or green liposomes have been combined on average to form the current population of docked or fused liposomes. Fig. 5 shows that the number of liposomes drops quickly by about 40–50%. This corresponds to an interaction of 3–4 liposomes on average, with green and red liposomes participating roughly equally. Furthermore, comparison of Figs. 3A and 5 indicates, that multiple docking is completed about 6-fold faster than fusion. A comparison of single liposome fluorescence burst photon counts of a population of liposomes carrying both, green and red labels, with a population of fusing liposomes after 60 min (Fig. S5) suggests that the majority of the docked aggregates proceeds to lipid mixing. The decrease in particle number thus indicates that approximately 1.8–2 rounds of docking/lipid mixing take place during the reaction (ignoring the small population that does not proceed to lipid mixing).
Fig. 5.
Detection of multiple interactions of liposomes. (A) Cartoon depicting the progress from single to binary to multiple docked liposomes. The number of particles N counted in each channel only decreases when more than one liposome of the respective color associates into complexes. (B) Time course of N counted by each detector in a typical fusion reaction. Here, we show that the number of liposomes N counted at different fusion times normalized to the number N0 of liposomes at the starting time of the fusion reaction for the green (green dots) and red (red dots) detector decreases over 1 h fusion time indicating multiple docking. The data presented is for the same measurement as in Fig. 3. Open symbols represent data obtained from an experiment in which fusion was inhibited by addition of a soluble synaptobrevin 2 fragment. Fitting with a monoexponential decay function with τ ≈ 240–480 s (solid lines) shows that multiple docking is faster than fusion (Fig. 3, τ2 = 840 s).
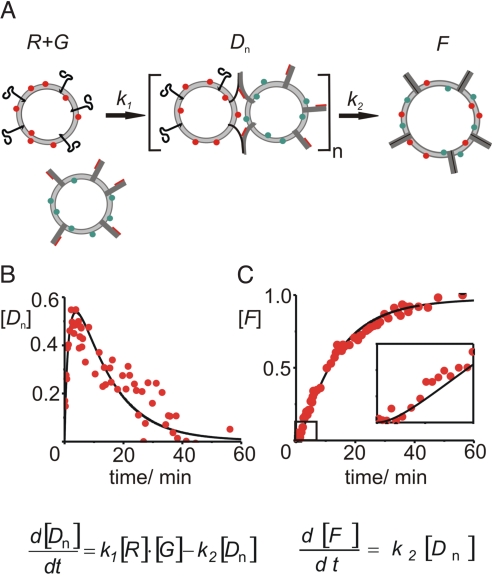
For a more quantitative evaluation of the docking and fusion reactions, we fitted bi-exponential functions to the fusion curves. The resulting time constants, τ1 and τ2, are characterizing the timescales for docking and fusion for the given liposome concentrations, SNARE density and protein-lipid composition. For the data shown in Fig. 3C, the time constants for docking and fusion are τ1 = 70 s and τ2 = 840 s, respectively. The data can also be analyzed assuming a two-step kinetic model and applying the differential equations given in Fig. 6 in which multiple interactions of the liposomes have been taken into account (see SI Appendix for more details). Using this kinetic model, the time constants for docking and fusion were calculated to be approximately τ1 = 100 s and τ2 = 600 s, correlating well with the estimates obtained by the bi- exponential fit and providing further evidence for a metastable intermediate. From these time constants it can be deduced by applying Smoluchowski theory for diffusion-limited reactions that on average liposomes collide approximately 105 times before they form a docked state (28).
Fig. 6.
Kinetic model for liposome fusion mediated by neuronal SNARE proteins including the stabilized acceptor complex. (A) Reaction scheme of a two-step fusion process: individual green (G) and red (R) liposomes interact with each other forming an intermediate state (Dn) with a rate constant k1 = 1/τ1. Dn includes all single and multiple docked liposomes (see SI Appendix). From this intermediate fused liposomes (F) are formed with a rate constant k2 = 1/τ2. (B and C) Numeric solution of the differential equations (black lines, time constants set to τ1 = 100 s and τ2 = 600 s) and experimental data (red dots) for docked (B) and lipid mixed (C) liposomes. The experiment indicates that docking occurred with a rate constant of approximately 1/100 s−1 and lipid mixing was about 6× slower.
Conclusions
Membrane fusion between vesicles requires that a physical contact is established between the membranes before the bilayers merge and SNARE proteins must interact in trans before fusion. However, it has been experimentally difficult to determine the kinetics of docking and to relate it to the kinetics of lipid mixing. The data presented here, provides evidence that in the case of the neuronal SNAREs synaptobrevin 2 and a complex of syntaxin 1A, SNAP-25A, and synaptobrevin 2 (residues 49–96) a trans-SNARE-complex is formed before lipid mixing, holding the liposomes in close contact, with lipid mixing being delayed. In the particular case studied here, the stability of the docked intermediate might be increased due to the artificial nature of the acceptor complex that requires displacement of the synaptobrevin 2 fragment before complete zippering can occur and was also shown to be dependent on the size of the liposomes used. In neuronal exocytosis the protein complexin is thought to stabilize such intermediate trans-SNARE complexes, and it is conceivable that it functions in a manner comparable to the synaptobrevin 2 fragment (29). It was possible to determine specific time constants for docking and lipid mixing-dependent population changes, which are intrinsic to the membrane system used depending on membrane composition, membrane curvature and especially protein to lipid ratios, which were the same as typically used in liposome fusion experiments (13), but different from the ones found in synaptic vesicles (30).
Our data show that populations of non-interacting, docked, lipid mixed, and multiple interacting species of liposomes can be determined quantitatively with FCCS under conditions where the liposomes are freely diffusing in an aqueous environment. The method allows for a concurrent determination of the formation and decay kinetics of these populations, providing a major advantage compared to classical bulk fusion assays. We believe that such a quantitative description of fusion intermediates is a prerequisite for the investigation of the role of proteins that are likely to act on docked vesicles and to influence docking and fusion kinetics such as synaptotagmin and complexin.
Methods
Preparation of SNARE Proteins and Proteoliposomes.
The SNARE proteins syntaxin 1A, SNAP-25A, and synaptobrevin 2 from rattus norvegicus were expressed and purified essentially as described: synaptobrevin 2 [full-length: residues 1–116 (11), soluble portion: residues 1–96 (31)] was expressed from a pET28a vector in Escherichia coli strain B21 (DE3). A complex consisting of Syntaxin 1A (coding for a fragment including its SNARE motif and the transmembrane region, residues 183–288), SNAP-25A [residues 1–206, all cysteines mutated to serines (32)], and C-terminal fragment of synaptobrevin 2 (residues 49–96) were purified after co-expression (13).
Proteoliposomes of approximately 30-nm diameter containing either full-length synaptobrevin 2, or a purified acceptor complex consisting of SNAP-25A, the syntaxin 1A fragment (residues 183–288), and the C-terminal synaptobrevin 2 fragment (residues 49–96) were prepared as described (13), using protein to lipid ratios of 1:200–300 and the following lipid composition (molar ratios): phosphatidylcholine (5), phosphatidylethanolamine (2), phosphatidylserine (1), phosphatidylinositol (1), and cholesterol (1) (all from bovine brain, Avanti Polar Lipids). Lipids in methanol:chloroform (2:1) were dried under nitrogen and resuspended in 20 mM HEPES/KOH, pH 7.4, 150 mM KCl, 1 mM DTT, and 5% (wt/vol) sodium cholate, yielding a lipid concentration of 13.5 mM. Proteins in 2% (wt/vol) CHAPS were added and liposomes were formed by size-exclusion chromatography on a SMART system (Amersham Biosciences) using a PC 3.2/10 Fast Desalting column (GE Healthcare) equilibrated in 20 mM HEPES/KOH, pH 7.4, 150 mM KCl, and 1 mM DTT.
Typically, the liposomes contained either 1.5 mol% total lipids of the fluorescent lipid analog Oregon Green-phosphatidylethanolamine as donor dye (usually liposomes containing syntaxin 1A and SNAP-25A), or 1 mol% total lipids Texas Red-phosphatidylethanolamine as an acceptor dye (Molecular Probes/Invitrogen).
Liposomes of a 100-nm diameter were prepared as described in the SI Appendix.
Burst Analysis, FCCS, and Fluorescence Lifetime Measurements.
All experiments were carried out using a two-photon confocal microscope set up (33) with a detection volume of about 1 fL and two detectors, allowing for the spectrally separated detection of the Oregon Green and Texas Red fluorescence from labeled liposomes (see SI Appendix and Fig. S6).
The fluorescence time traces were analyzed for individual fluorescence bursts or using fluorescence auto- and cross-correlation spectroscopy (FCS and FCCS) (25, 34, 35) in combination with fluorescence lifetime analysis. FCS allows for the determination of the average number of red or green labeled particles being in the focal detection volume by analyzing signal fluctuations in the red or green detector that are caused by the diffusion of the particles in an out the detection volume (36) (see SI Appendix). The method is sensitive for particle concentrations in the nanomolar range (≈1–100 particles in the detection volume). Similarly, FCCS allows for the determination of the average number of particles in the focal detection volume that are labeled with both red and green fluorescence dyes by analyzing the signal fluctuations from both detectors simultaneously.
For full fusion the liposome solutions as obtained by size exclusion chromatography were diluted 1:50 and mixed in equal amounts, resulting in concentrations of about 5–30 liposomes per focal detection volume (≈1–10 nM), and incubated 2 h at room temperature. From this reaction mix 30 μL were drawn at different times of the fusion reaction and measured nine times for 10 s for FCCS/fluorescence lifetime analysis of the fusion kinetics. Before burst measurements, the incubated sample was diluted a hundred times more, so that concentrations of approximately 0.1 liposomes per focal volume were obtained. To improve time resolution for the FCCS/fluorescence lifetime measurements during the first 7 min of fusion, 30 μL of a 1:50 dilution of each of the two species were mixed directly on the coverslip and measured for 7 min in 10-s intervals. For inhibition of SNARE-interacting liposomes containing the Q-SNAREs were preincubated with a 10-fold excess of a soluble synaptobrevin 2 fragment (residues 1–96) for 30 min at room temperature.
FRET was measured as a decrease in the donor fluorescence lifetime. We determined the fluorescence lifetime of the donor dye by fitting a monoexponential function to the fluorescence decay curve of the green detector:
where I(t) is the fluorescence intensity observed at the time t after a laser excitation pulse. I0 is the amplitude of the decay curve. The reciprocal of the fluorescence lifetime τFl is a linear function of the rate for energy transfer kET (37).
kET depends linearly on the acceptor dye concentration in the membranes of fused or multiple fused liposomes. As a consequence, 1/τFl is also a linearly related to the proportion of originally free liposomes that have fused, Nfus, even when liposomes undergo multiple rounds of fusion (see also SI Appendix) (38). Lipid mixing kinetics measured by fluorescence lifetime analysis was in good agreement with data obtained by measuring Oregon Green fluorescence intensity with a standard fluorometer (Fig. S7), and corresponded well to data obtained by the standard fluorescence dequenching assays (Fig. S8).
Supplementary Material
Acknowledgments.
We thank Aliaksandr Kandratsenka and Geert van den Bogaart for helpful discussions and critically reading the manuscript. This work was supported by the Fonds der Chemischen Industrie (to P.J.W.), National Institutes of Health Grant P01 GM072694 (to R.J.), and Deutsche Forschungsgemeinschaft Grant SFB 803, TP B6 (to R.J. and P.J.W.).
Footnotes
The authors declare no conflict of interest.
This article is a PNAS Direct Submission.
This article contains supporting information online at www.pnas.org/cgi/content/full/0906677106/DCSupplemental.
References
- 1.Kloepper TH, Kienle CN, Fasshauer D. An elaborate classification of SNARE proteins sheds light on the conservation of the eukaryotic endomembrane system. Mol Biol Cell. 2007;18:3463–3471. doi: 10.1091/mbc.E07-03-0193. [DOI] [PMC free article] [PubMed] [Google Scholar]
- 2.Fasshauer D, et al. Conserved structural features of the synaptic fusion complex: SNARE proteins reclassified as Q- and R-SNAREs. Proc Natl Acad Sci USA. 1998;95:15781–15786. doi: 10.1073/pnas.95.26.15781. [DOI] [PMC free article] [PubMed] [Google Scholar]
- 3.Martens S, McMahon HT. Mechanisms of membrane fusion: Disparate players and common principles. Nat Rev Mol Cell Biol. 2008;9:543–556. doi: 10.1038/nrm2417. [DOI] [PubMed] [Google Scholar]
- 4.Rizo J, Rosenmund C. Synaptic vesicle fusion. Nat Struct Mol Biol. 2008;15:665–674. doi: 10.1038/nsmb.1450. [DOI] [PMC free article] [PubMed] [Google Scholar]
- 5.Jahn R, Scheller RH. SNAREs-engines for membrane fusion. Nat Rev Mol Cell Biol. 2006;7:631–643. doi: 10.1038/nrm2002. [DOI] [PubMed] [Google Scholar]
- 6.Weber T, et al. SNAREpins: Minimal machinery for membrane fusion. Cell. 1998;92:759–772. doi: 10.1016/s0092-8674(00)81404-x. [DOI] [PubMed] [Google Scholar]
- 7.Rizo J, Chen X, Arac D. Unraveling the mechanisms of synaptotagmin and SNARE function in neurotransmitter release. Trends Cell Biol. 2006;16:339–350. doi: 10.1016/j.tcb.2006.04.006. [DOI] [PubMed] [Google Scholar]
- 8.Struck DK, Hoekstra D, Pagano RE. Use of resonance energy transfer to monitor membrane fusion. Biochemistry. 1981;20:4093–4099. doi: 10.1021/bi00517a023. [DOI] [PubMed] [Google Scholar]
- 9.McNew JA, et al. Close is not enough: SNARE-dependent membrane fusion requires an active mechanism that transduces force to membrane anchors. J Cell Biol. 2000;150:105–117. doi: 10.1083/jcb.150.1.105. [DOI] [PMC free article] [PubMed] [Google Scholar]
- 10.Chen X, et al. SNARE-mediated lipid mixing depends on the physical state of the vesicles. Biophys J. 2006;90:2062–2074. doi: 10.1529/biophysj.105.071415. [DOI] [PMC free article] [PubMed] [Google Scholar]
- 11.Schütte CG, et al. Determinants of liposome fusion mediated by synaptic SNARE proteins. Proc Natl Acad Sci USA. 2004;101:2858–2863. doi: 10.1073/pnas.0400044101. [DOI] [PMC free article] [PubMed] [Google Scholar]
- 12.Tucker WC, Weber T, Chapman ER. Reconstitution of Ca2+-regulated membrane fusion by synaptotagmin and SNAREs. Science. 2004;304:435–438. doi: 10.1126/science.1097196. [DOI] [PubMed] [Google Scholar]
- 13.Stein A, et al. Synaptotagmin activates membrane fusion through a Ca(2+)-dependent trans interaction with phospholipids. Nat Struct Mol Biol. 2007;14:904–911. doi: 10.1038/nsmb1305. [DOI] [PubMed] [Google Scholar]
- 14.Shen J, et al. Selective activation of cognate SNAREpins by Sec1/Munc18 proteins. Cell. 2007;128:183–195. doi: 10.1016/j.cell.2006.12.016. [DOI] [PubMed] [Google Scholar]
- 15.Brandie FM, et al. Negative regulation of syntaxin4/SNAP-23/VAMP2-mediated membrane fusion by Munc18c in vitro. PLoS ONE. 2008;3:e4074. doi: 10.1371/journal.pone.0004074. [DOI] [PMC free article] [PubMed] [Google Scholar]
- 16.Schaub JR, et al. Hemifusion arrest by complexin is relieved by Ca2+-synaptotagmin I. Nat Struct Mol Biol. 2006;13:748–750. doi: 10.1038/nsmb1124. [DOI] [PubMed] [Google Scholar]
- 17.Malsam J, et al. The carboxy-terminal domain of complexin I stimulates liposome fusion. Proc Natl Acad Sci USA. 2009 doi: 10.1073/pnas.0812813106. [DOI] [PMC free article] [PubMed] [Google Scholar]
- 18.Yoon TY, et al. Multiple intermediates in SNARE-induced membrane fusion. Proc Natl Acad Sci USA. 2006;103:19731–19736. doi: 10.1073/pnas.0606032103. [DOI] [PMC free article] [PubMed] [Google Scholar]
- 19.Yoon TY, et al. Complexin and Ca2+ stimulate SNARE-mediated membrane fusion. Nat Struct Mol Biol. 2008;15:707–713. doi: 10.1038/nsmb.1446. [DOI] [PMC free article] [PubMed] [Google Scholar]
- 20.Liu T, Tucker WC, Bhalla A, Chapman ER, Weisshaar JC. SNARE-driven, 25-Millisecond Vesicle Fusion In Vitro. Biophys J. 2005;89:2458–2472. doi: 10.1529/biophysj.105.062539. [DOI] [PMC free article] [PubMed] [Google Scholar]
- 21.Bowen ME, Weninger K, Brunger AT, Chu S. Single molecule observation of liposome-bilayer fusion thermally induced by soluble N-ethyl maleimide sensitive-factor attachment protein receptors (SNAREs) Biophys J. 2004;87:3569–3584. doi: 10.1529/biophysj.104.048637. [DOI] [PMC free article] [PubMed] [Google Scholar]
- 22.Fix M, et al. Imaging single membrane fusion events mediated by SNARE proteins. Proc Natl Acad Sci USA. 2004;101:7311–7316. doi: 10.1073/pnas.0401779101. [DOI] [PMC free article] [PubMed] [Google Scholar]
- 23.Pobbati AV, Stein A, Fasshauer D. N- to C-terminal SNARE complex assembly promotes rapid membrane fusion. Science. 2006;313:673–676. doi: 10.1126/science.1129486. [DOI] [PubMed] [Google Scholar]
- 24.Melia TJ, et al. Regulation of membrane fusion by the membrane-proximal coil of the t-SNARE during zippering of SNAREpins. J Cell Biol. 2002;158:929–940. doi: 10.1083/jcb.200112081. [DOI] [PMC free article] [PubMed] [Google Scholar]
- 25.Zwilling D, et al. Early endosomal SNAREs form a structurally conserved SNARE complex and fuse liposomes with multiple topologies. EMBO J. 2007;26:9–18. doi: 10.1038/sj.emboj.7601467. [DOI] [PMC free article] [PubMed] [Google Scholar]
- 26.Chan Y-HM, van Lengerich B, Boxer SG. Effects of linker sequences on vesicle fusion mediated by lipid-anchored DNA oligonucleotides. Proc Natl Acad Sci USA. 2009;106:979–984. doi: 10.1073/pnas.0812356106. [DOI] [PMC free article] [PubMed] [Google Scholar]
- 27.Parlati F, et al. Rapid and efficient fusion of phospholipid vesicles by the alpha-helical core of a SNARE complex in the absence of an N-terminal regulatory domain. Proc Natl Acad Sci USA. 1999;96:12565–12570. doi: 10.1073/pnas.96.22.12565. [DOI] [PMC free article] [PubMed] [Google Scholar]
- 28.Smoluchowski M. Versuch einer mathematischen Theorie der Koagulationskinetik kolloider Lösungen. Z Phys Chem. 1917;92:129–168. [Google Scholar]
- 29.Giraudo CG, et al. Alternative zippering as an on-off switch for SNARE-mediated fusion. Science. 2009;323:512–516. doi: 10.1126/science.1166500. [DOI] [PMC free article] [PubMed] [Google Scholar]
- 30.Takamori S, et al. Molecular anatomy of a trafficking organelle. Cell. 2006;127:831–846. doi: 10.1016/j.cell.2006.10.030. [DOI] [PubMed] [Google Scholar]
- 31.Fasshauer D, et al. Structural changes are associated with soluble N-ethylmaleimide-sensitive fusion protein attachment protein receptor complex formation. J Biol Chem. 1997;272:28036–28041. doi: 10.1074/jbc.272.44.28036. [DOI] [PubMed] [Google Scholar]
- 32.Fasshauer D, et al. Mixed and non-cognate SNARE complexes. Characterization of assembly and biophysical properties. J Biol Chem. 1999;274:15440–15446. doi: 10.1074/jbc.274.22.15440. [DOI] [PubMed] [Google Scholar]
- 33.Pohl W, Hellmuth H, Hilbert M, Seibel J, Walla PJ. A two-photon fluorescence correlation study of lectins interacting with carbohydrated 20 nm beads. ChemBioChem. 2006;7:268–274. doi: 10.1002/cbic.200500246. [DOI] [PubMed] [Google Scholar]
- 34.Schwille P, Meyer-Almes F-J, Rigler R. Dual-color fluorescence cross-correlation spectroscopy for multicomponent diffusional analysis in solution. Biophys J. 1997;72:1878–1886. doi: 10.1016/S0006-3495(97)78833-7. [DOI] [PMC free article] [PubMed] [Google Scholar]
- 35.Schwille P, Heinze KG. Two-photon fluorescence cross-correlation spectroscopy. ChemPhysChem. 2001;2:269–272. doi: 10.1002/1439-7641(20010518)2:5<269::AID-CPHC269>3.0.CO;2-Y. [DOI] [PubMed] [Google Scholar]
- 36.Madge D, Elson E, Webb WW. Thermodynamic fluctuations in a reacting system - measurement by fluorescence correlation spectroscopy. Phys Rev Lett. 1972;29:705–708. [Google Scholar]
- 37.Walla PJ. Modern Biophysical Chemistry. 1st Ed. Weinheim: Wiley-VCH; 2009. p. 93. [Google Scholar]
- 38.Lakowicz JR. Principles of Fluorescence Spectroscopy. 2nd Ed. New York: Kluwer Academic/Plenum; 1999. 698 pp. [Google Scholar]
Associated Data
This section collects any data citations, data availability statements, or supplementary materials included in this article.


