

Abstract
Alzheimer’s Disease (AD) is a neurodegenerative disorder that mainly affects grey matter (GM). Nevertheless, a number of investigations have documented white matter (WM) pathology associated with AD. The corpus callosum (CC) is the largest WM fiber bundle in the human brain. It has been shown to be susceptible to atrophy in AD mainly as a correlate of Wallerian degeneration of commissural nerve fibers of the neocortex. The aim of this study was to investigate which callosal regions are affected and whether callosal degeneration is associated with the stage of the disease. For this purpose, we analyzed high-resolution MRI data of patients with amnesic mild cognitive impairment (MCI) (n=20), mild AD (n=20), severe AD (n=10), and of healthy controls (n=20). Callosal morphology was investigated applying two different structural techniques: mesh-based geometrical modeling methods and whole-brain voxel-based analyses. Our findings indicate significant reductions in severe AD patients compared to healthy controls in anterior (genu and anterior body) and posterior (splenium) sections. In contrast, differences between healthy controls and mild AD patients or amnesic MCI patients were less pronounced and did not survive corrections for multiple comparisons. When correlating anterior and posterior WM density of the CC with GM density of the cortex in the severe AD group, we detected significant positive relationships between posterior sections of the CC and the cortex. We conclude that callosal atrophy is present predominantly in the latest stage of AD, where two mechanisms might contribute to WM alterations in severe AD: the Wallerian degeneration in posterior subregions and the myelin breakdown process in anterior subregions.
Keywords: Corpus Callosum, Mild AD, Severe AD, amnesic MCI, Region of Interest, Voxel-Based Morphometry
Introduction
Although Alzheimer’s Disease (AD) is generally considered to affect grey matter (GM), a number of investigations have also documented a general white matter (WM) pathology associated with AD (Brun and Englund, 1986; Scheltens et al., 1995; Smith et al., 2000; Bronge et al., 2002; Hua et al., 2008a, 2008b). Several analyses suggest the corpus callosum (CC) to be particularly susceptible to atrophy in AD (Lyoo et al., 1997; Thompson et al., 1998; Hampel et al., 1998; 2002; Teipel et al., 1998, 1999, 2002, 2003; Yamauchi et al., 2000; Wang et al., 2006; Thomann et al., 2006; Tomaiuolo et al., 2007; Chaim et al., 2007). However, findings lack consistency across studies, where reductions in AD subjects were detected across the whole CC (total callosal area), but also in specific subsections, such as the rostrum, genu, anterior body, isthmus and splenium of the CC (Kaufer et al., 1997; Lyoo et al., 1997; Thompson et al., 1998; Hampel et al., 1998, Teipel et al., 1998, 1999, 2002, 2003; Hanyu et al., 1999; Pantel et al., 1999; Yamauchi et al., 2000; Black et al., 2000; Wiltshire et al., 2005; Thomann et al., 2006; Tomaiuolo et al., 2007; Li et al., 2008; Hallam et al., 2008).
Of note, the vast majority of these studies was based on rather heterogeneous patient groups, including AD patients in different disease stages, ranging from mild to severe dementia (hereafter called mixed AD group). The few studies that investigated more homogeneous patient groups (e.g., subjects affected by either mild or moderate AD) revealed controversial results. For example, region-of-interest (ROI) studies investigating mild AD indicated atrophy in posterior callosal subregions (isthmus and splenium) (Lyoo et al., 1997, Hampel et al., 2002, Teipel et al., 2003; Wang et al., 2006b), or no differences between patient and control groups (Hensel et al., 2002, 2004, 2005). To our knowledge, there is only one ROI study which included a homogeneous group of moderate AD patients (Ortiz Alonso et al., 2000). This analysis revealed a volume reduction of the anterior body, mid body and isthmus in AD compared to healthy controls. Likewise, diverse results are reported in ROI studies of the CC in subjects with mild cognitive impairment (MCI), who have a higher risk of developing dementia. While Wang et al., (2006a, 2006b) detected atrophy in posterior subregions in one case (2006b), they did not find any reductions in amnesic MCI in another study (2006a). Hallam et al., (2008) did not detect any differences between a group of patients with a cognitive profile similar to multi-domain MCI (mild ambiguous group) and healthy controls. Finally, Thomann et al., (2006) reported a reduction in an anterior subregion of the CC in a group of MCI patients amnesic and multi-domain amnesic when using the ROI approach, but no callosal abnormalities when using a whole-brain approach (i.e., voxel-based morphometry [VBM]). Outcomes from other VBM studies also lack consistency. For example, while earlier work on WM in moderate AD revealed a diffuse atrophy within the CC (Good et al., 2002), later work on a mixed AD group reported a loss of callosal volume in anterior portions of the CC (Thomann et al., 2006), in nearly all regions of the CC (Chaim et al., 2007), or in posterior regions of the CC (Li et al., 2008).
Taken together, findings appear to indicate significant volume/area reductions in AD subjects, although there seems to be a lack of consistency with respect to the affected callosal segment. Findings are similarly inconsistent with respect to when callosal atrophy occurs in AD (i.e., in mild, moderate, or severe stages) and whether the degeneration is already detectable in the pre-clinical stage of AD, such as in patients with amnesic MCI (Petersen et al., 1999, 2001, 2004). To further investigate the issue of CC atrophy in patients with MCI, mild AD and severe AD, we used two completely different and well-validated structural analysis techniques; (i) VBM to compare WM density along midline as well as a (ii) computational mesh-based method to map callosal thickness with high spatial resolution. Of note, we chose the latter mentioned callosal thickness approach instead of a traditional ROI approach (as applied in previous AD studies) given that traditionally parcellating the CC into pre-defined regions may lead to misleading results (Tomaiuolo et al, 2007). However, the present study differs from previously published studies in this field not only with respect to the methods applied, but also with respect to the clinical features of the patients group. That is, we separated severe AD from mild AD patients, and also considered amnesic single domain MCI by selecting these patients from the overall group of MCI patients.
Methods
Subjects
The study group consisted of individuals with a diagnosis of amnesic MCI (single and multiple domain) (n=20), patients with a diagnosis of probable AD of mild degree (n=20) and of probable AD of severe degree (n=10), as well as 20 healthy controls (socio-demographic and clinical characteristics are reported in supplemental Table 1). The four groups of participants did not differ significantly with respect to gender or age but, as expected, mild and severe AD patients had a significantly lower educational level than control participants. Consent was obtained according to the Declaration of Helsinki, and the study was approved by the Santa Lucia Foundation Research Ethics Committee. All participants (or their proxies) provided written informed consent.
Specific inclusion and exclusion criteria for amnesic MCI, AD and Controls
Specific inclusion criteria for amnesic MCI were: (1) diagnostic evidence of amnesic MCI consistent with Petersen’s guidelines (Petersen et al., 1999): (i) complaint of defective memory, (ii) normal activities of daily living, (iii) normal general cognitive functioning, (iv) abnormal memory functioning for age, and (v) absence of dementia; and (2) a Mini Mental State Examination (MMSE) (Folstein et al., 1975) score higher than 24. Specific inclusion criteria for mild and severe AD were: (1) diagnostic evidence of probable AD consistent with the NINCDS-ADRDA criteria (McKhann et al., 1984); and (2) an MMSE score higher than 18 for mild AD and lower than 15 for severe AD.
A specific exclusion criterion for AD was the lack of a “reliable” caregiver, defined as someone able to ensure the patient’s compliance with assessment procedures and to contact the patient at least twice a week, with one contact being a personal visit. The amnesic MCI and AD patients were recruited from three outpatient clinics in Central Italy. In particular, the amnesic MCI and mild AD patients were at the onset of cognitive impairment and had undergone their first clinical examination for the diagnosis of amnesic MCI or AD, respectively. A specific inclusion criterion for healthy controls was that all their neuropsychological scores had to be above the healthy normative age- and educational-corrected specific test score (Carlesimo et al., 1996). Volunteers included in the control group were recruited from the general population of the same geographical region as the patients.
Common inclusion and exclusion criteria for amnesic MCI, AD and Controls
Common inclusion criteria for amnesic MCI, mild and severe AD, as well as for healthy controls were: (1) sufficient vision and hearing to comply with testing procedures and (2) laboratory values within the appropriate reference intervals or considered to be clinically insignificant by the investigators (i.e., liver function tests (ALT or AST) not higher than 3 times the upper normal limit; creatinine concentrations lower than 150 mg/dl; B12 or folate range as evidenced by blood concentrations within the normal limit of 211–911 pg/ml and 2–9 ng/ml respectively; TSH values within the normal range of 0,35 – 4,50 μUI/ml). Common exclusion criteria were: (1) major medical illnesses (e.g., diabetes, obstructive pulmonary disease, asthma, hematological/oncological disorders, vitamin B12 or folate deficiency, pernicious anemia, clinically significant and unstable active gastrointestinal, renal, hepatic, endocrine or cardiovascular system disease, newly treated hypothyroidism); (2) comorbidity of primary psychiatric or neurological disorders (e.g., schizophrenia, major depression, stroke, Parkinson disease, seizure disorder, head injury with loss of consciousness) and any other significant mental or neurological disorder; (3) known or suspected history of alcoholism or drug dependence and abuse during lifetime; (4) MRI evidence of focal parenchymal abnormalities of any size; and (5) MRI evidence of neoplasm.
Clinical and neuropsychological assessment
A trained clinical neurologist and neuropsychologist interviewed patients and caregivers using the NINCDS-ARDRA criteria (McKhann et al., 1984) for the diagnosis of AD and Petersen’s criteria (Petersen et al., 1999) for the diagnosis of amnesic MCI. We used the neuropsychological battery described below to confirm the presence of the cognitive deficits required for the diagnosis of AD and amnesic MCI and to enroll control participants. To obtain a global index of cognitive impairment, we administered the MMSE (Folstein et al., 1975), which is a neurocognitive screening test that measures orientation, language, verbal memory, attention, visuo-spatial function and mental control. It is composed of 16 items, with scores ranging from 30 (no impairment) to 0 (maximum impairment). The effect of the cognitive impairment on functional daily activities was rated using the Clinical Dementia Rating (CDR) Scale (Hughes et al., 1982), which investigates several aspects such as memory, orientation, judgment and problem solving, community affairs, home and hobbies, and personal care. The CDR was scored separately from the psychometric assessment. Based on CDR scores, participants were classified into three groups: 10 patients with severe AD (CDR = 3), 20 patients with mild AD (CDR = 1), 20 patients with amnesic MCI (CDR = 0.5) and 20 cognitively normal controls (CDR= 0).
To assess single cognitive domains, we administered the Mental Deterioration Battery (MDB) (Carlesimo et al., 1996). The MDB is a standardized and validated neuropsychological battery, which consists of seven neuropsychological tests from which eight performance scores can be derived. Of the eight total scores, four pertain to the elaboration of verbal stimuli and four to visuo-spatial materials. The tests were selected to obtain information on the functionality of different cognitive domains: verbal memory (MDB Rey’s 15-word Immediate Recall (RAVLTIR) and Delayed Recall (RAVLTDR)); short-term visual memory (MDB Immediate Visual Memory (IVM)); logical reasoning (MDB Raven’s Progressive Matrices’47 (PM47)); language (MDB Phonological Verbal Fluency (PVF)), and MDB Sentence Construction (SC)); simple constructional praxis (MDB Copying Drawings (CD), and MDB Copying Drawings with Landmarks (CDL). For further details see supplemental Table 2.
MRI data acquisition
All MRI data were acquired on a 3 T Allegra MR system (Siemens, Erlangen, Germany) using a birdcage head coil. The measurements were performed in a single session and consisted in the following pulse sequences: (a) PD and T2-weighted double turbo spin-echo (SE) acquired in transverse planes (TR: 4500 ms, TE: 12 ms, TE: 112 ms, FOV 230×172.5 mm, matrix 320×240, slice thickness: 5 mm, number of slices: 24; (b) Fluid-attenuated inversion-recovery (FLAIR) in the same planes as the SE sequence (TR/TE: 8500/109 ms, TI: 2000; FOV: 230×168 mm, matrix 256×256, slice thickness: 5 mm, number of slices: 24); (c) T1-weighted 3D images were obtained, with partitions acquired in the sagittal plane, using a modified driven equilibrium Fourier transform (MDEFT) (Deichmann et al., 2004) sequence (TE/TR=2.4/7.92 ms, flip angle 15, TI: 910. isotropic voxels: 1 mm3).
The images were visually inspected by two experienced observers, a neuropsychologist expert in neuroimaging and a neuroradiologist. Both of them were blind to participants’ identities. White matter lesions were considered present if they were hyperintense on both FLAIR and T2 weighted images. We included only subjects who, in the opinion of both observers, did not have any lesion. Thus, also one visible lesion of any dimension was considered as an exclusion criterion.
Callosal thickness analysis
Radiofrequency bias-field corrections were applied to all T1-weighted images to eliminate intensity drifts due to magnetic field inhomogeneities (Sled et al., 1998). To obtain the most accurate possible measure of the midsagittal callosal area, each image volume was manually positioned along the anterior–posterior commissure (AC-PC) line and rotated so that the septum pellucidum and a large part of the falx would be visible in the sagittal plane.
Regional callosal thickness was estimated as detailed elsewhere (Luders et al., 2006; Luders et al., 2007) and as illustrated in Figure 1. One rater (M.D.P.) manually outlined upper (Top) and lower (Bottom) callosal boundaries in the midsagittal section of each brain. Callosal Top and Bottom sections were redigitized, resulting in 100 equidistant points. Subsequently, the spatial average of the 100 equidistant surface points representing the upper and lower boundaries was calculated resulting in a new midline segment (Medial Curve), also consisting of 100 equidistant points. Finally, the distances between 100 corresponding surface points between midline segment and upper and lower boundaries were quantified in millimeters.
Figure 1.
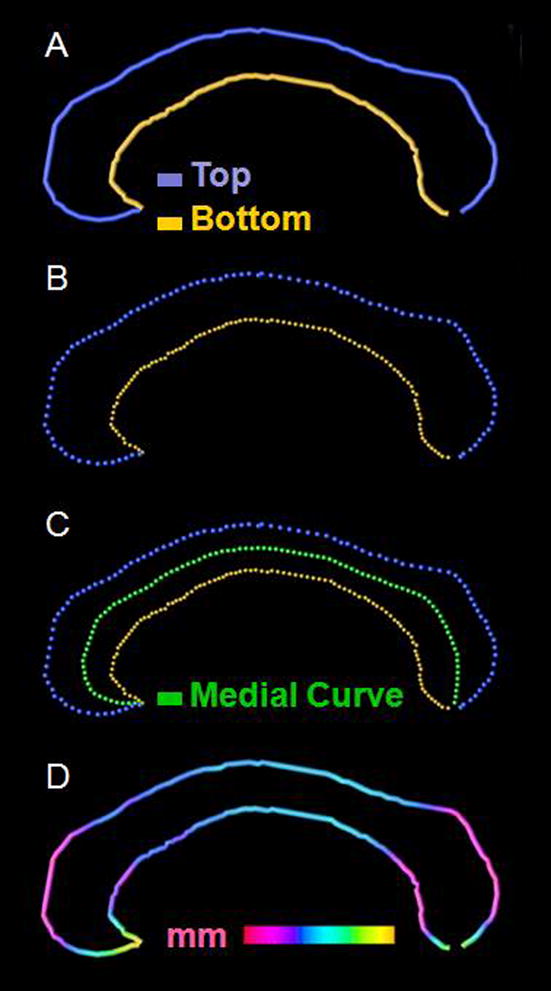
Measurement of callosal thickness. After delineating (Panel A) and redigitizing callosal Top and Bottom (Panel B) we computed the Medial Curve (Panel C). The point-wise distances between Medial Curve (green) and callosal Top (blue) and Bottom (yellow) segments were calculated and superimposed as color-coded values onto each subject’s callosal surface model (in mm) (Panel D)
Using independent sample Student’s t-tests, we tested for group differences in point-wise distance measures and generated color-coded statistical maps illustrating where patients with amnesic MCI, mild AD, and severe AD differed significantly from healthy controls. Permutation testing, with 10,000 permutations computed, was employed to control for multiple comparisons, testing for the proportion of the surface area of the CC with supra-threshold statistics when statistical maps were thresholded at p=0.05.
VBM analysis
Images were processed and analyzed using VBM (Ashburner and Friston 2000; Good et al., 2001) in the framework of statistical parametric mapping (SPM5, Wellcome Department of Imaging Neuroscience, University College London, London, UK). First, all volumes were manually reoriented to approximate the orientation to the ICBM-152 default SPM5 template (Mazziotta et al., 2001) to improve image registration accuracy. Then, in the unified segmentation step (Ashburner and Friston 2005) images were normalized, applying both linear (12 parameter affine) and nonlinear (warping) normalizations, segmented into GM and WM partitions, and into cerebrospinal fluid (CSF) and bias corrected within the same generative model. For each subject, normalized whole-brain and segmented WM images obtained from the automated VBM processing were then visually inspected and compared to the SPM5 template image to verify the efficacy of normalization. Finally, WM partitions (unmodulated data) were smoothed with a 12 mm Gaussian Kernel (FWHM).
Using the smoothed WM partitions, we performed independent sample Student’s t-tests at each voxel to compare each patient group (i.e., amnesic MCI, mild AD, and severe AD) to healthy controls with respect to WM density. Statistical outcomes were corrected for multiple comparisons using false discovery rate (FDR) at p<0.05. Significant findings were mapped onto the ICBM-152 default SPM5 template and restricted to findings located on the CC using a predefined 3-dimensional volume of interest (VOI). This callosal VOI was drawn by one of the authors (M.D.P.) on three sequential coronal slices of the mean WM image (i.e., based on the averaged, normalized WM partitions of all patients and controls). Before this VOI was applied to the statistical maps it was smoothed with a 12 mm Gaussian kernel.
Results
Callosal thickness analysis
As shown in Figure 1 (Panel A), when individuals with severe AD were compared to healthy controls we detected extended regions of significantly reduced callosal thickness across almost the entire callosal surface, with the most pronounced differences in the callosal splenium, anterior body and anterior third. When individuals with mild AD were compared to healthy controls (Panel B), we observed a significantly reduced callosal thickness within the callosal anterior third (spanning across the callosal anterior bend), as well as at the border between the anterior third and the anterior body. When individuals with amnesic MCI were compared to healthy controls (Panel C), we revealed a significantly reduced callosal thickness in a region located within the callosal posterior body and also within the splenium near the callosal posterior end. When individuals with severe AD were compared to individuals with mild AD (Panel D), we detected a significantly reduced callosal thickness across large callosal sections, with the most pronounced differences in the splenium. While the comparisons between severe AD subjects versus healthy controls (Panel A) and severe AD versus mild AD subjects (Panel D) were confirmed by permutation testing, group differences between mild AD (Panel B) and amnesic MCI (Panel C) subjects and healthy controls were not confirmed by permutation testing. Control subjects did not show any region where WM density was reduced when compared to any of the three patient groups (results not shown).
VBM analysis
As further demonstrated in Figure 1, when severe AD subjects were compared to control subjects (Panel E), we detected significantly less WM density in the genu, anterior body and splenium of the CC (genu, Z= 4.21, FDR-corrected p = 0.001; anterior body, Z= 3.36, FDR-corrected p = 0.002; splenium, Z= 3.57, FDR-corrected p = 0.002). We also observed differences between mild AD and control subjects and between amnesic MCI and control subjects (Panels F and G), however findings did not survive corrections for multiple comparisons (i.e., effects are presented uncorrected). Control subjects did not show any region where WM density was reduced when compared to any of the three patient groups (results not shown). When we compared mild AD with severe AD (Panel H), statistically significant differences in the CC were found in the genu, anterior body and splenium (genu Z= 3.08, FDR-corrected p = 0.020; anterior body, Z= 2.62, FDR-corrected p = 0.036; splenium, Z= 2.76, FDR-corrected p = 0.029).
Supplemental Analysis
In order to investigate if VBM and callosal thickness measurements were comparable, we performed a supplemental correlation analysis. For this purpose, we chose the outcomes from comparing the severe AD patients against the controls to determine the location of interest. As demonstrated in Figure 2, both the callosal thickness and VBM approach revealed the most significant group differences in anterior and posterior callosal sections. In order to conduct the correlation analyses we calculated the average values within these anterior and posterior regions of interest. More specifically, with respect to callosal thickness and according to the callosal subdivision in 100 points, we extracted and averaged the values from point 1 to 35 (anterior section); and from point 75 to 90 (posterior section). With respect to VBM, we derived values of WM by centering a 4 mm sphere at the peak intensity in both the anterior and posterior CC (coordinates obtained from the VBM analysis, comparing severe AD versus controls). WM intensity values were extracted from each ROI and averaged across voxels, yielding a single value for each subject in the anterior and posterior CC. Then, we correlated the callosal thickness and WM values of the anterior and posterior CC (Pearson) using SPSS for Windows (release 11.0, SPSS Inc.). Interestingly, while we found a significant correlation between both morphometric measurements in the anterior CC (r = 0.819; p= 0.004, two tailed), no significant correlation was found in the posterior CC.
Figure 2.

Corpus callosum atrophy along the course of Alzheimer’s disease. Left: Illustration of the spatial distribution of callosal fibers (image reproduced with permission of Aboitiz et al., 2003). Right: The top panel illustrates group differences with respect to callosal thickness analyzed by computational mesh-based modeling. The color bars encode the uncorrected p-value; the asterisk indicates findings confirmed by permutation testing. The bottom panel illustrates group differences with respect to WM density analyzed by VBM. The color bars encode the T-value; the asterisk indicates FDR-corrected findings.
Correlational analysis between CC and GM
Based on our findings in the severe AD group, we set out to investigate whether the observed callosal reductions were possibly related to cortical atrophy, according to the Wallerian degeneration hypothesis. This hypothesis suggests that callosal atrophy in AD could be a consequence of the death of projecting pyramidal cells in layer III of the neocortex, and could reflect the pattern of cerebral cortex atrophy (Pantel et al., 1999; Hampel et al., 2002; Fellgiebel et al., 2004; Tomimoto et al., 2004). Thus, we calculated the correlation between voxel-wise GM density across the whole brain and anterior and posterior WM density of the CC in the severe AD group. We entered the GM density maps and the anterior and posterior CC values (calculated as described above) in the design matrix followed by running a multiple regression analysis in SPM5 and applying FDR corrections at p = 0.05. We detected significant positive relationships between posterior sections of the CC and cortical GM density (i) in the temporal mesial cortex (parahippocampal gyrus bilaterally) and (ii) posterior cortices (temporo-parietal bilaterally and left occipital gyrus) (see Figure 2). There were no significant correlations between GM density and callosal WM derived from anterior callosal sections.
Discussion
This study was designed to investigate when callosal abnormalities can be detected along the course of AD. For this purpose, we compared severe AD patients to healthy controls expecting that structural abnormalities would be very pronounced in this late stage of the disease. We also compared patients with mild AD and amnesic MCI (who are at higher risk of developing AD) against healthy controls, to determine whether these patient groups showed any early callosal markers of AD. Our findings indicate that callosal atrophy is both detectable and fairly generalized in severe AD, while callosal reductions in milder and pre-clinical stages of AD appear to be less pronounced (i.e., they were spatially more restricted and findings did not survive appropriate statistical corrections). Furthermore, when we compared individuals with mild AD versus severe AD, we revealed striking evidence that callosal atrophy appears to progress from the early stage to later stages of AD.
Region-specific callosal reductions
This study was also set out to determine which callosal sections are affected. Given that current findings in mild AD and MCI require validation in follow-up studies, we will abstain from discussing these regional effects extensively. However, we wish to point out that the lack of significant differences between mild AD/MCI patients and healthy controls are in accordance with some studies (Hensel et al., 2002, 2004, 2005), but in conflict with others (Lyoo et al., 1997; Hampel et al., 2002; Teipel et al., 2003; Wang et al., 2006b; Thomann et. al., 2006). For possible explanations for discrepancies in findings see below.
Within the severe AD group we observed significant reductions in anterior (genu and anterior body) and posterior (splenium) sections with both the tecniques we used Callosal Thickness and VBM.
Our results are consistent with previously reported callosal aberrations in the splenium (Hampel et al., 1998, 2002; Teipel et al., 1998, 2003; Tomaiuolo et al., 2007; Chaim et al., 2007) and in anterior portions of the CC (Pantel et al., 1999; Thomann et al., 2006; Chaim et al., 2007), as revealed by cross-sectional ROI and VBM studies of mixed AD. Moreover, the observed callosal effects in anterior and posterior sections are in good agreement with outcomes from previous studies where cortical regions were shown to be affected in AD (Braak and Braak, 1991). For example, the callosal genu and anterior midbody are responsible for the inter-hemispheric connection of prefrontal association cortices (Aboitiz et al., 1992, 1996; Zarei et al., 2006), and prefrontal regions were suggested to be involved in the later stage of AD pathology evolution (Braak and Braak, 1991, 1997; Thompson et al., 2003). The prefrontal region of the human brain plays a role in monitoring information in working memory and in the active retrieval of information from posterior cortical association areas (Petrides, 1996). Thus, the callosal reduction in anterior sections could account for general deficits in executive functions and attention in AD. Moreover, the splenium subserves two-thirds of the higher-order processing areas of the lateral temporal lobes (i.e., temporal pole, superior and inferior temporal gyri) and of the parietal lobes, which, together with the mesial temporal structures (such as the hippocampus and the parahippocampal gyrus) (Schmahmann and Pandya, 2006), are primarily involved in the cortical degeneration of AD (Braak and Braak, 1991, 1997; Thompson et al., 2003). Thus, the callosal reductions in posterior sections could interfere with the functioning of the posterior cortical memory networks that subserve the episodic memory operations impaired early on in AD patients (Galton et al., 2000).
While the callosal thickness measure reflects the width of the CC, VBM provides information on the concentration of WM in the CC. We detected significant positive correlations between both techniques with respect to obtained measurements in anterior callosal sections. On the contrary, posterior callosal sections lacked this kind of congruence. We suggest that differences in cell packing density and/or axonal diameter size between the anterior and the posterior callosal subregions (Aboitiz et al., 1992) (see Figure 2) may have contributed to the lack of correlation in the posterior callosal subregion. Discrepancies in findings also underline the importance of using multiple approaches in studying brain anatomy. Different techniques accounting for different aspects can give a clearer picture of existing differences in brain structure between groups. While manual segmentation has certain limitations (e.g., it is operator-dependent, time consuming, and requires a priori definitions of regions of interest), it has been shown to remain the most accurate approach compared to automatic methods (Tisserand et al., 2002).
Possible underlying mechanisms
The observed correlation between the WM density of the posterior CC and the GM density of temporo-parietal cerebral cortices appears to support the Wallerian degeneration hypothesis. That is, atrophy in posterior callosal regions might reflect the atrophy of the posterior cerebral cortex. However, the lack of significant correlations between WM density in anterior callosal sections and cortical GM indicates that Wallerian degeneration may not be the main mechanism for the observed reductions in anterior callosal sections. Instead, we suggest primary degeneration of WM to account for these anterior group effects. According to the myelin breakdown hypothesis (Bartzokis 2004), late-myelinating fibers should be more susceptible to myelin breakdown. The fibers most susceptible to neurodegeneration are small-diameter cortico-cortical axons (Braak et al., 2000; Tang et al., 1997; Thal et al., 2002). Interestingly, the anteriorly located genu of the CC constitutes a region where fibers myelinate late, while fibers of the posteriorly located splenium myelinate earlier (Aboitiz et al., 1992, 1996). As illustrated in Figure 1 (left panel) the genu also contains the highest density of small-diameter fibers, while the splenium harbours small and mid-diameter fibers. Thus, both Wallerian degeneration (in posterior sections) and myelin breakdown (in anterior sections) are likely mechanisms responsible for the region-specific disease effects detected in the present study. Nevertheless, given the rather small number of subjects in the current analysis, follow-up studies involving larger samples are necessary to lend further support to this hypothesis.
Discrepancies to previous findings
Differences between amnesic MCI/mild AD patients and healthy controls were mainly located in the genu, posterior body and splenium of CC (amnesic MCI versus controls) and in the genu and splenium of the CC (mild AD versus controls). Nevertheless these differences did not survive corrections for multiple comparisons and thus should be considered with caution. Discrepancies in findings between the current study and previous analyses might be attributable to a number of differences. For example, earlier studies relied on manually tracing the CC and segmenting it according to common parcellation schemes (i.e., according to Witelson (Witelson 1989; Lyoo et al., 1997); Weis (Weis et al., 1991; Hensel et al., 2002;Wang et al., 2006a); or Hampel (Hampel et al., 1998, Teipel et al., 2003). These callosal segmentation methods have generated some controversy regarding the assumed topography of callosal fiber (Hofer and Frahm, 2006). Furthermore, we demonstrated that the pre-definition of callosal regions can lead to misleading results (Tomaiuolo et al, 2007). To overcome these limits, in the present study we investigated callosal morphology without relying on traditional parcellation. In addition we applied an automated voxel-based technique (VBM), which entirely eliminates the manual tracing step. Nevertheless, the VBM technique has its own limitations. One of its major weaknesses (and a strength in some respects) pertains to the variety of options of how to implement VBM (Senjem et al., 2005; Keller et al., 2004). For example, Senjem et al. (2005) found that changes in the image processing chain of VBM noticeably influence the results of inter-group morphometric comparisons; and that “optimized VBM” produces different outcomes from those obtained with “standard VBM”. Other authors have pointed out the importance of spatial normalization, underlying how an imperfect spatial normalization may affect the validity of VBM results Ashburner and Friston 2000; Bookstein 2001; Salmond et al., 2002). In the present study we used the unified segmentation approach (Ashburner and Friston 2005) implemented in SPM5. Here, estimating the model parameters involves alternating among classification, bias correction and registration steps. Importantly, the unified segmentation has been shown to provide reliable outcomes and thus avoids pitfalls associated with the simple serial applications of each component (i.e., classification, bias correction and registration steps) as in the “standard” and “optimized” VBM (Ashburner and Friston 2005). Nevertheless, beside all these improvements, still VBM technique maybe not enough sensitivity in detecting early changes in preclinical and early stage of AD.
An other aspect that can explain discrepancies to previous findings is the difference in the criteria used to select patients might also account for the divergent results. For example, Yamauchi et al. (2000) studied AD with early onset, which has been shown to have a typical topographical pattern of brain atrophy different from the one that accompanies AD with late onset (Frisoni et al., 2007), and thus also might have different effects on callosal atrophy. Importantly, the current sample included only AD patients with late onset, where all AD and MCI subjects were selected and defined using stringent criteria accepted by international consensus: the NINCDS-ADRDA criteria for AD patients (McKhann et al., 1984) and the Petersen guidelines for MCI patients (Petersen et al., 1999).
When we ran our correlation analysis we found a positive correlation between the WM of posterior callosal sections and the posterior gray matter cortex, while significant correlations between the WM of anterior callosal sections and cortical gray matter were absent. Interestingly, Sydykova et al. (2007) conducted a diffusion tensor imaging (DTI) study on mild AD, and found that GM volume in the bilateral frontal and temporal lobes and right parietal and occipital cortices was correlated with the fractional anisotropy (FA) of the posterior CC (p< 0.001, uncorrected). In contrast, the GM volume in the prefrontal cortex and left parietal lobes was correlated with the FA values of the anterior CC in AD patients (p< 0.001, uncorrected). The lack of significant anterior correlations in our study and the discrepancies with the above mentioned DTI study might be attributable to differences in the sensitivity and nature of the measurement.
Recently, diffusion MRI methodologies, such as DTI have been shown to be sensitive in detecting callosal WM change at the microstuctural level, such as the degeneration of myelin and axons in the callosal WM (Hanyu et al., 1999a; Wang et al., 2006a, Chua, et al., 2008). These microstructural changes might occur early in mild AD and amnesic MCI patients (Ukmar et al., 2008) or on cognitively normal subjects who have high risk of developing AD based on a family history of dementia and on Apolipoprotein E (APOE) allele possession (Smith et al., 2008) and cannot be observed macroscopically with the structural MRI technique (Neil et al., 2002; Sundgren et al., 2004; Sun et al., 2005). Nevertheless, Sthal et al. (2007), in contrast with the previously mentioned DTI studies, did not find any difference in apparent diffusion coefficient, FA and/or in radial anisotropy in the genu and splenium of CC in AD group and amnesic MCI when compared with healthy controls.
Of note, prior work has shown that anomalies of the CC may be associated with a variety of other commissure malformations such as abnormalities in the anterior and hippocampal commissure (Atlas et al., 1986; Barkovich AJ 1990, 2001, 2002). However, this association is not certain, and callosal and hippocampal changes may constitute separate forms of cerebral malformation. Nevertheless, anatomical contiguity between the CC and the hippocampal commissure exists (Schamahmann and Pandia 2006). Thus, future studies in AD and MCI patients may try to evaluate callosal and hippocampal alterations in combination.
Thus, future studies combining different MRI techniques (e.g., traditional structural MRI and DTI) are imperative both to further advance our understanding of callosal changes and related WM structures in early stages of AD/MCI,o broaden our horizon with respect to the specificity of tissue pathology in AD, in general.
Supplementary Material
Figure 3.
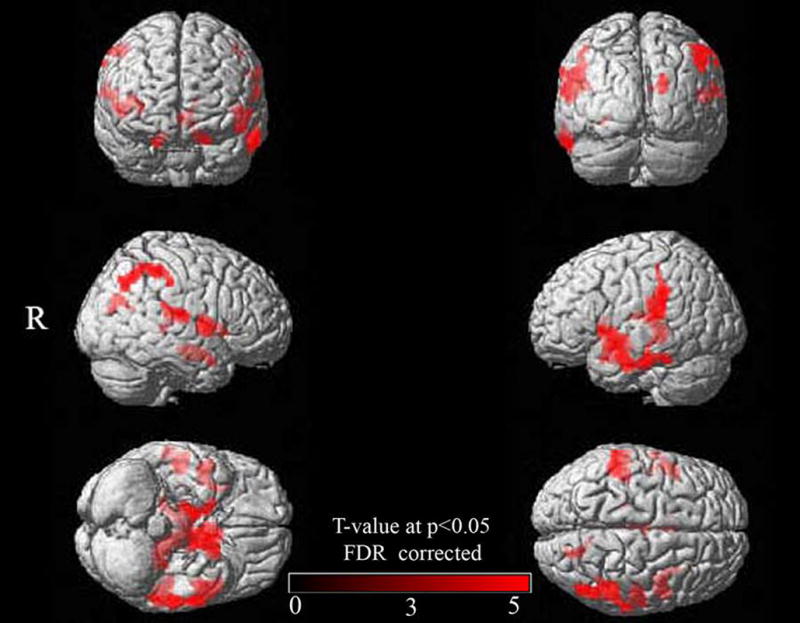
Associations between callosal WM density and GM density across the whole brain. Shown are GM correlations with posterior callosal WM (correlations with anterior WM were not present). Results are rendered on the SPM5 standard single brain surface (R = right). All significance clusters are FDR-corrected (p = 0.05).
Acknowledgments
This work was supported by the Italian Ministry of Health (IMA GRANT RC 06–07–08–09 and RF 06–07–08) and by the National Institutes of Health through the NIH Roadmap for Medical Research, grant U54 RR021813 entitled Center for Computational Biology (CCB). Additional support was provided by the NIH grants P41 RR013642, R01 EB008281, M01 RR000865, EB007813, and P50 AG016570.
- RAVLTDR
Rey’s 15-word Delayed Recall
- PVF
Phonological Verbal Fluency
- SC
Sentence Construction
- IVM
Immediate Visual Memory
- PM47
Raven’s Progressive Matrices’47
- CD
Copying Drawings
- CDL
Copying Drawings with Landmarks
Footnotes
Publisher's Disclaimer: This is a PDF file of an unedited manuscript that has been accepted for publication. As a service to our customers we are providing this early version of the manuscript. The manuscript will undergo copyediting, typesetting, and review of the resulting proof before it is published in its final citable form. Please note that during the production process errors may be discovered which could affect the content, and all legal disclaimers that apply to the journal pertain.
References
- Aboitiz F, Scheibel AB, Fisher RS, Zaidel E. Fiber composition of the human corpus callosum. Brain Res. 1992;598:143–153. doi: 10.1016/0006-8993(92)90178-c. [DOI] [PubMed] [Google Scholar]
- Aboitiz F, Rodríguez E, Olivares R, Zaidel E. Age-related changes in fibre composition of the human corpus callosum, sex differences. Neuroreport. 1996;7:1761–1764. doi: 10.1097/00001756-199607290-00013. [DOI] [PubMed] [Google Scholar]
- Ashburner J, Friston KJ. Voxel-based morphometry - the methods. NeuroImage. 2000;11:805–821. doi: 10.1006/nimg.2000.0582. [DOI] [PubMed] [Google Scholar]
- Ashburner J, Friston KJ. Unified segmentation. NeuroImage. 2005;26:839–851. doi: 10.1016/j.neuroimage.2005.02.018. [DOI] [PubMed] [Google Scholar]
- Atlas SW, Zimmerman RA, Bilaniuk LT, Rorke L, Hackney DB, Goldberg HI, Grossman RI. Corpus callosum and limbic system: neuroanatomic MR evaluation of developmental anomalies. Radiology. 1986;160:355–362. doi: 10.1148/radiology.160.2.3726113. [DOI] [PubMed] [Google Scholar]
- Barkovich AJ. Magnetic resonance imaging: role in the understanding of cerebral malformations. Brain Dev. 2002;24:2–12. doi: 10.1016/s0387-7604(01)00327-8. [DOI] [PubMed] [Google Scholar]
- Barkovich AJ, Simon EM, Walsh CA. Callosal agenesis with cyst: a better understanding and new classification. Neurology. 2001;56:220–227. doi: 10.1212/wnl.56.2.220. [DOI] [PubMed] [Google Scholar]
- Barkovich AJ. Apparent atypical callosal dysgenesis: analysis of MR findings in six cases and their relationship to holoprosencephaly. AJNR Am J Neuroradiol. 1990;11:333–339. [PMC free article] [PubMed] [Google Scholar]
- Bartzokis G. Age-related myelin breakdown, a developmental model of cognitive decline and Alzheimer’s disease. Neurobiol Aging. 2004;25:5–18. doi: 10.1016/j.neurobiolaging.2003.03.001. [DOI] [PubMed] [Google Scholar]
- Black SE, Moffat SD, Yu DC, Parker J, Stanchev P, Bronskill M. Callosal atrophy correlates with temporal lobe volume and mental status in Alzheimer’s disease. Can J Neurol Sci. 2000;27:204–209. doi: 10.1017/s0317167100000846. [DOI] [PubMed] [Google Scholar]
- Braak H, Braak E. Neuropathological stageing of Alzheimer-related changes. Acta Neuropathol. 1991;82:239–259. doi: 10.1007/BF00308809. [DOI] [PubMed] [Google Scholar]
- Braak H, Braak E. Frequency of stages of Alzheimer-related lesions in different age categories. Neurobiol Aging. 1997;18:351–357. doi: 10.1016/s0197-4580(97)00056-0. [DOI] [PubMed] [Google Scholar]
- Braak H, Del Tredici K, Schultz C, Braak E. Vulnerability of select neuronal types to Alzheimer’s disease. Ann N Y Acad Sci. 2000;924:53–61. doi: 10.1111/j.1749-6632.2000.tb05560.x. [DOI] [PubMed] [Google Scholar]
- Bronge L, Bogdanovic N, Wahlund LO. Postmortem MRI and histopathology of white matter changes in Alzheimer brains. A quantitative, comparative study. Dement Geriatr Cogn Disord. 2002;13:205–212. doi: 10.1159/000057698. [DOI] [PubMed] [Google Scholar]
- Brun A, Englund E. A white matter disorder in dementia of the Alzheimer type, a pathoanatomical study. Ann Neurol. 1986;19:253–262. doi: 10.1002/ana.410190306. [DOI] [PubMed] [Google Scholar]
- Bookstein FL. “Voxel-based morphometry” should not be used with imperfectly registered images. NeuroImage. 2001;14:1454–1462. doi: 10.1006/nimg.2001.0770. [DOI] [PubMed] [Google Scholar]
- Carlesimo GA, Caltagirone C, Gainotti G. The Mental Deterioration Battery, normative data, diagnostic reliability and qualitative analyses of cognitive impairment. The Group for the Standardization of the Mental Deterioration Battery. Eur Neurol. 1996;36:378–384. doi: 10.1159/000117297. [DOI] [PubMed] [Google Scholar]
- Chaim TM, Duran FL, Uccida RR, Pirico CA, de Castro CC, Buratto GF. Volumetric reduction of the corpus callosum in Alzheimer’s disease in vivo as assessed with voxel-based morphometry. Psychiatry Res. 2007;154:59–68. doi: 10.1016/j.pscychresns.2006.04.003. [DOI] [PubMed] [Google Scholar]
- Chua TC, Wen W, Slavin MJ, Sachdev PS. Diffusion tensor imaging in mild cognitive impairment and Alzheimer’s disease: a review. Curr Opin Neurol. 2008;21:83–92. doi: 10.1097/WCO.0b013e3282f4594b. [DOI] [PubMed] [Google Scholar]
- Deichmann R, Schwarzbauer C, Turner R. Optimisation of the 3D MDEFT sequence for anatomical brain imaging: technical implications at 1.5 and 3 T. Neuroimage. 2004;21:757–767. doi: 10.1016/j.neuroimage.2003.09.062. [DOI] [PubMed] [Google Scholar]
- Fellgiebel A, Wille P, Müller MJ, Winterer G, Scheurich A, Vucurevic G, Schmidt LG, Stoeter P. Ultrastructural hippocampal and white matter alterations in mild cognitive impairment, a diffusion tensor imaging study. Dement Geriatr Cogn Disord. 2004;18:101–108. doi: 10.1159/000077817. [DOI] [PubMed] [Google Scholar]
- Folstein MF, Folstein SE, McHigh PR. The “Mini-mental state”, A practical method for grading the cognitive state of patients for the clinicians. J of Psychiatr Res. 1975;12:189–198. doi: 10.1016/0022-3956(75)90026-6. [DOI] [PubMed] [Google Scholar]
- Frisoni GB, Pievani M, Testa C, Sabattoli F, Bresciani L, Bonetti M, Beltramello A, Hayashi KM, Toga AW, Thompson PM. The topography of grey matter involvement in early and late onset Alzheimer’s disease. Brain. 2007;130:720–730. doi: 10.1093/brain/awl377. [DOI] [PubMed] [Google Scholar]
- Galton CJ, Patterson K, Xuereb JH, Hodges JR. Atypical and typical presentations of Alzheimer’s disease, a clinical, neuropsychological, neuroimaging and pathological study of 13 cases. Brain. 2000;123:484–498. doi: 10.1093/brain/123.3.484. [DOI] [PubMed] [Google Scholar]
- Good CD, Johnsrude IS, Ashburner J, Henson RNA, Friston KJ, Frackowiak RS. A voxel-based morphometry study of ageing in 465 normal adult human brains. NeuroImage. 2001;14:21–36. doi: 10.1006/nimg.2001.0786. [DOI] [PubMed] [Google Scholar]
- Good CD, Scahill RI, Fox NC, Ashburner J, Friston KJ, Chan D, Crum WR, Rossor MN, Frackowiak RS. Automatic differentiation of anatomical patterns in the human brain, validation with studies of degenerative dementias. NeuroImage. 2002;17:29–46. doi: 10.1006/nimg.2002.1202. [DOI] [PubMed] [Google Scholar]
- Hallam BJ, Brown WS, Ross C, Buckwalter JG, Bigler ED, Tschanz JT, Norton MC, Welsh-Bohmer KA, Breitner JC. Regional atrophy of the corpus callosum in dementia. J Int Neuropsychol Soc. 2008;14:414–423. doi: 10.1017/S1355617708080533. [DOI] [PubMed] [Google Scholar]
- Hampel H, Teipel SJ, Alexander GE, Horwitz B, Teichberg D, Schapiro MB, Rapoport SI. Corpus callosum atrophy is a possible indicator of region- and cell type-specific neuronal degeneration in Alzheimer disease, a magnetic resonance imaging analysis. Arch Neurol. 1998;55:193–198. doi: 10.1001/archneur.55.2.193. [DOI] [PubMed] [Google Scholar]
- Hampel H, Teipel SJ, Alexander GE, Pogarell O, Rapoport SI, Moller HJ. In vivo imaging of region and cell type specific neocortical neurodegeneration in Alzheimer’s disease. Perspectives of MRI derived corpus callosum measurement for mapping disease progression and effects of therapy. Evidence from studies with MRI, EEG and PET. J Neural Transm. 2002;109:837–855. doi: 10.1007/s007020200069. [DOI] [PubMed] [Google Scholar]
- Hanyu H, Asano T, Sakurai H, Imon Y, Iwamoto T, Takasaki M, Shindo H, Abe K. Diffusion-weighted and magnetization transfer imaging of the corpus callosum in Alzheimer’s disease. J Neurol Sci. 1999;167:37–44. doi: 10.1016/s0022-510x(99)00135-5. [DOI] [PubMed] [Google Scholar]
- Hensel A, Wolf H, Kruggel F, Riedel-Heller SG, Nikolaus C, Arendt T, Gertz HJ. Morphometry of the corpus callosum in patients with questionable and mild dementia. J Neurol Neurosurg Psychiatry. 2002;73:59–61. doi: 10.1136/jnnp.73.1.59. [DOI] [PMC free article] [PubMed] [Google Scholar]
- Hensel A, Ibach B, Muller U, Kruggel F, Kiefer M, Gertz HJ. Does the pattern of atrophy of the Corpus callosum differ between patients with frontotemporal dementia and patients with Alzheimer’s disease? Dement Geriatr Cogn Disord. 2004;18:44–49. doi: 10.1159/000077734. [DOI] [PubMed] [Google Scholar]
- Hensel A, Wolf H, Busse A, Arendt T, Gertz HJ. Association between global brain volume and the rate of cognitive change in elderly humans without dementia. Dement Geriatr Cogn Disord. 2005;19:213–221. doi: 10.1159/000083501. [DOI] [PubMed] [Google Scholar]
- Hildebrand C, Remahl S, Persson H, Bjartmar C. Myelinated nerve fibres in the cns. Prog Neurobiol. 1993;40:319–384. doi: 10.1016/0301-0082(93)90015-k. [DOI] [PubMed] [Google Scholar]
- Hofer S, Frahm J. Topography of the human corpus callosum revisited--comprehensive fiber tractography using diffusion tensor magnetic resonance imaging. NeuroImage. 2006;32:989–994. doi: 10.1016/j.neuroimage.2006.05.044. [DOI] [PubMed] [Google Scholar]
- Hua X, Leow AD, Lee S, Klunder AD, Toga AW, Lepore N, Chou YY, Brun C, Chiang MC, Barysheva M, Jack CR, Jr, Bernstein MA, Britson PJ, Ward CP, Whitwell JL, Borowski B, Fleisher AS, Fox NC, Boyes RG, Barnes J, Harvey D, Kornak J, Schuff N, Boreta L, Alexander GE, Weiner MW, Thompson PM Alzheimer’s Disease Neuroimaging Initiative. 3D Characterization of Brain Atrophy in Alzheimer’s Disease and Mild Cognitive Impairment using Tensor-based Morphometry. NeuroImage. 2008a;41:19–34. doi: 10.1016/j.neuroimage.2008.02.010. [DOI] [PMC free article] [PubMed] [Google Scholar]
- Hua X, Leow AD, Parikshak N, Lee S, Chiang MC, Toga AW, Jack CR, Weiner MW, Thompson PM. Tensor-Based Morphometry as a Neuroimaging Biomarker for Alzheimer’s Disease, An MRI Study of 676 AD, MCI, and Normal Subjects. NeuroImage. 2008b doi: 10.1016/j.neuroimage.2008.07.013. in press. [DOI] [PMC free article] [PubMed] [Google Scholar]
- Hughes CP, Berg L, Danziger WL, Coben LA, Martin RL. A new clinical scale for the staging of dementia. Br J Psychiatry. 1982;140:566–572. doi: 10.1192/bjp.140.6.566. [DOI] [PubMed] [Google Scholar]
- Kaufer DI, Miller BL, Itti L, Fairbanks LA, Li J, Fishman J, Kushi J, Cummings JL. Midline cerebral morphometry distinguishes frontotemporal dementia and Alzheimer’s disease. Neurology. 1997;48:978–985. doi: 10.1212/wnl.48.4.978. [DOI] [PubMed] [Google Scholar]
- Keller SS, Wilke M, Wieshmann UC, Sluming VA, Roberts N. Comparison of standard and optimized voxel-based Morphometry for analysis of brain changes associated with temporal lobe epilepsy. NeuroImage. 2004;23:860–868. doi: 10.1016/j.neuroimage.2004.07.030. [DOI] [PubMed] [Google Scholar]
- Levy R. Aging-associated cognitive decline. Working Party of the International Psychogeriatric Association in collaboration with the World Health Organization. Int Psychogeriatr. 1994;6:63–68. [PubMed] [Google Scholar]
- Li S, Pu F, Shi F, Xie S, Wang Y, Jiang T. Regional white matter decreases in Alzheimer’s disease using optimized voxel-based morphometry. Acta Radiol. 2008;49:84–90. doi: 10.1080/02841850701627181. [DOI] [PubMed] [Google Scholar]
- Lopez OL, Kuller LH, Becker JT, Dulberg C, Sweet RA, Gach HM, Dekosky ST. Incidence of dementia in mild cognitive impairment in the cardiovascular health study cognition study. Arch Neurol. 2007;64:416–420. doi: 10.1001/archneur.64.3.416. [DOI] [PubMed] [Google Scholar]
- Luders E, Narr KL, Zaidel E, Thompson PM, Jancke L, Toga AW. Parasagittal asymmetries of the corpus callosum. Cereb Cortex. 2006;16:346–354. doi: 10.1093/cercor/bhi112. [DOI] [PubMed] [Google Scholar]
- Luders E, Di Paola M, Tomaiuolo F, Thompson PM, Toga AW, Vicari S, Petrides M, Caltagirone C. Callosal morphology in Williams syndrome, a new evaluation of shape and thickness. Neuroreport. 2007;18:203–207. doi: 10.1097/WNR.0b013e3280115942. [DOI] [PMC free article] [PubMed] [Google Scholar]
- Lyoo IK, Satlin A, Lee CK, Renshaw PF. Regional atrophy of the corpus callosum in subjects with Alzheimer’s disease and multi-infarct dementia. Psychiatry Res. 1997;74:63–72. doi: 10.1016/s0925-4927(97)00009-7. [DOI] [PubMed] [Google Scholar]
- Mazziotta J, Toga A, Evans A, Fox P, Lancaster J, Zilles K, Woods R, Paus T, Simpson G, Pike B, Holmes C, Collins L, Thompson P, MacDonald D, Iacoboni M, Schormann T, Amunts K, Palomero-Gallagher N, Geyer S, Parsons L, Narr K, Kabani N, Le Goualher G, Boomsma D, Cannon T, Kawashima R, Mazoyer B. A probabilistic atlas and reference system for the human brain. Philos Trans R Soc Lond B Biol Sci. 2001;356:1293–1322. doi: 10.1098/rstb.2001.0915. [DOI] [PMC free article] [PubMed] [Google Scholar]
- McKhann G, Drachman D, Folstein M, Katzman R, Price D, Stadian EM. Clinical diagnosis of Alzheimer’s disease, report of the NINCDS-ADRDA work group under the auspices of Department of Health and Human Services Task Force on Alzheimer’s disease. Neurology. 1984;34:939–944. doi: 10.1212/wnl.34.7.939. [DOI] [PubMed] [Google Scholar]
- Müller MJ, Greverus D, Dellani PR, Weibrich C, Wille PR, Scheurich A, Stoeter P, Fellgiebel A. Functional implications of hippocampal volume and diffusivity in mild cognitive impairment. NeuroImage. 2005;28:1033–1042. doi: 10.1016/j.neuroimage.2005.06.029. [DOI] [PubMed] [Google Scholar]
- Neil J, Miller J, Mukherjee P, Hüppi PS. Diffusion tensor imaging of normal and injured developing human brain - a technical review. NMR Biomed. 2002;15:543–552. doi: 10.1002/nbm.784. [DOI] [PubMed] [Google Scholar]
- Ortiz Alonso T, Martínez Castillo E, Fernández Lucas A, Arrazola García J, Maestú Unturbe F, López-Ibor JJ. Callosal atrophy and associated electromyographic responses in Alzheimer’s disease and aging. Electromyogr Clin Neurophysiol. 2000;40:465–475. [PubMed] [Google Scholar]
- Pantel J, Schröder J, Jauss M, Essig M, Minakaran R, Schönknecht P, Schneider G, Schad LR, Knopp MV. Topography of callosal atrophy reflects distribution of regional cerebral volume reduction in Alzheimer’s disease. Psychiatry Res. 1999;90:181–192. doi: 10.1016/s0925-4927(99)00018-9. [DOI] [PubMed] [Google Scholar]
- Petersen RC, Smith GE, Waring SC, Ivnik RJ, Tangalos EG, Kokmen E. Mild cognitive impairment, clinical characterization and outcome. Arch Neurol. 1999;56:303–308. doi: 10.1001/archneur.56.3.303. [DOI] [PubMed] [Google Scholar]
- Petersen RC, Doody R, Kurz A, Mohs RC, Morris JC, Rabins PV, Ritchie K, Rossor M, Thal L, Winblad B. Current concepts in mild cognitive impairment. Arch Neurol. 2001;58:1985–1992. doi: 10.1001/archneur.58.12.1985. [DOI] [PubMed] [Google Scholar]
- Petersen RC. Mild cognitive impairment as a diagnostic entity. J Intern Med. 2004;256:183–194. doi: 10.1111/j.1365-2796.2004.01388.x. [DOI] [PubMed] [Google Scholar]
- Petrides M. Specialized systems for the processing of mnemonic information within the primate frontal cortex. Philos Trans R Soc Lond B Biol Sci. 1996;351:1455–1462. doi: 10.1098/rstb.1996.0130. [DOI] [PubMed] [Google Scholar]
- Salmond CH, Ashburner J, Vargha-Khadem F, Connelly A, Gadian DG, Friston KJ. The precision of anatomical normalization in the medial temporal lobe using spatial basis functions. Neuroimage. 2002;17:507–512. doi: 10.1006/nimg.2002.1191. [DOI] [PubMed] [Google Scholar]
- Scheltens P, Barkhof F, Leys D, Wolters EC, Ravid R, Kamphorst W. Histopathologic correlates of white matter changes on MRI in Alzheimer’s disease and normal aging. Neurology. 1995;45:883–888. doi: 10.1212/wnl.45.5.883. [DOI] [PubMed] [Google Scholar]
- Schmahmann JD, Pandya DN. Fiber pathways of the brain. New York: Oxford University Press; 2006. pp. 487–492.pp. 497–498. [Google Scholar]
- Senjem ML, Gunter JL, Shiung MM, Petersen RC, Jack CR. Comparison of different methodological implementations of voxel-based morphometry in neurodegenerative disease. NeuroImage. 2005;26:600–608. doi: 10.1016/j.neuroimage.2005.02.005. [DOI] [PMC free article] [PubMed] [Google Scholar]
- Sled JG, Zijdenbos AP, Evans AC. A nonparametric method for automatic correction of intensity nonuniformity in MRI data. IEEE Trans Med Imaging. 1998;17:87–97. doi: 10.1109/42.668698. [DOI] [PubMed] [Google Scholar]
- Smith CD, Snowdon DA, Wang H, Markesbery WR. White matter volumes and periventricular white matter hyperintensities in aging and dementia. Neurology. 2000;54:838–842. doi: 10.1212/wnl.54.4.838. [DOI] [PubMed] [Google Scholar]
- Smith CD, Chebrolu H, Andersen AH, Powell DA, Lovell MA, Xiong S, Gold BT. White matter diffusion alterations in normal women at risk of Alzheimer’s disease. Neurobiol Aging. 2008 Sep 16; doi: 10.1016/j.neurobiolaging.2008.08.006. [Epub ahead of print] [DOI] [PMC free article] [PubMed] [Google Scholar]
- Stahl R, Dietrich O, Teipel SJ, Hampel H, Reiser MF, Schoenberg SO. White matter damage in Alzheimer disease and mild cognitive impairment: assessment with diffusion-tensor MR imaging and parallel imaging techniques. Radiology. 2007;243:483–492. doi: 10.1148/radiol.2432051714. [DOI] [PubMed] [Google Scholar]
- Sun SW, Song SK, Harms MP, Lin SJ, Holtzman DM, Merchant KM, Kotyk JJ. Detection of age-dependent brain injury in a mouse model of brain amyloidosis associated with Alzheimer’s disease using magnetic resonance diffusion tensor imaging. Exp Neurol. 2005;191:77–85. doi: 10.1016/j.expneurol.2004.09.006. [DOI] [PubMed] [Google Scholar]
- Sundgren PC, Dong Q, Gómez-Hassan D, Mukherji SK, Maly P, Welsh R. Diffusion tensor imaging of the brain: review of clinical applications. Neuroradiology. 2004;46:339–350. doi: 10.1007/s00234-003-1114-x. [DOI] [PubMed] [Google Scholar]
- Sydykova D, Stahl R, Dietrich O, Ewers M, Reiser MF, Schoenberg SO, Möller HJ, Hampel H, Teipel SJ. Fiber connections between the cerebral cortex and the corpus callosum in Alzheimer’s disease: a diffusion tensor imaging and voxel-based morphometry study. Cereb Cortex. 2007;17:2276–2282. doi: 10.1093/cercor/bhl136. [DOI] [PubMed] [Google Scholar]
- Tang Y, Nyengaard JR, Pakkenberg B, Gundersen HJ. Age induced white matter changes in the human brain, a stereological investigation. Neurobiol Aging. 1997;18:609–615. doi: 10.1016/s0197-4580(97)00155-3. [DOI] [PubMed] [Google Scholar]
- Teipel SJ, Hampel H, Alexander GE, Schapiro MB, Horwitz B, Teichberg D, Daley E, Hippius H, Möller HJ, Rapoport SI. Dissociation between corpus callosum atrophy and white matter pathology in Alzheimer’s disease. Neurology. 1998;51:1381–1385. doi: 10.1212/wnl.51.5.1381. [DOI] [PubMed] [Google Scholar]
- Teipel SJ, Hampel H, Pietrini P, Alexander GE, Horwitz B, Daley E, Möller HJ, Schapiro MB, Rapoport SI. Region-specific corpus callosum atrophy correlates with the regional pattern of cortical glucose metabolism in Alzheimer disease. Arch Neurol. 1999;56:467–473. doi: 10.1001/archneur.56.4.467. [DOI] [PubMed] [Google Scholar]
- Teipel SJ, Bayer W, Alexander GE, Zebuhr Y, Teichberg D, Kulic L, Schapiro MB, Möller HJ, Rapoport SI, Hampel H. Progression of corpus callosum atrophy in Alzheimer disease. Arch Neurol. 2002;59:243–248. doi: 10.1001/archneur.59.2.243. [DOI] [PubMed] [Google Scholar]
- Teipel SJ, Bayer W, Alexander GE, Bokde AL, Zebuhr Y, Teichberg D, Müller-Spahn F, Schapiro MB, Möller HJ, Rapoport SI, Hampel H. Regional pattern of hippocampus and corpus callosum atrophy in Alzheimer’s disease in relation to dementia severity, evidence for early neocortical degeneration. Neurobiol Aging. 2003;24:85–94. doi: 10.1016/s0197-4580(02)00044-1. [DOI] [PubMed] [Google Scholar]
- Tisserand DJ, Pruessner JC, Sanz Arigita EJ, van Boxtel MP, Evans AC, Jolles J, Uylings HB. Regional frontal cortical volumes decrease differentially in aging: an MRI study to compare volumetric approaches and voxel-based morphometry. Neuroimage. 2002;17:657–669. [PubMed] [Google Scholar]
- Thal DR, Rub U, Orantes M, Braak H. Phases of A beta-deposition in the human brain and its relevance for the development of AD. Neurology. 2002;58:1791–1800. doi: 10.1212/wnl.58.12.1791. [DOI] [PubMed] [Google Scholar]
- Thompson PM, Schwartz C, Lin RT, Khan AA, Toga AW. Three-dimensional statistical analysis of sulcal variability in the human brain. J Neurosci. 1996a;16:4261–4274. doi: 10.1523/JNEUROSCI.16-13-04261.1996. [DOI] [PMC free article] [PubMed] [Google Scholar]
- Thompson PM, Schwartz C, Toga AW. High-resolution random mesh algorithms for creating a probabilistic 3D surface atlas of the human brain. NeuroImage. 1996b;3:19–34. doi: 10.1006/nimg.1996.0003. [DOI] [PubMed] [Google Scholar]
- Thompson PM, MacDonald D, Mega MS, Holmes CJ, Evans AC, Toga AW. Detection and mapping of abnormal brain structure with a probabilistic atlas of cortical surfaces. J Comput Assist Tomogr. 1997;21:567–581. doi: 10.1097/00004728-199707000-00008. [DOI] [PubMed] [Google Scholar]
- Thompson PM, Moussai J, Zohoori S, Goldkorn A, Khan AA, Mega MS, Small GW, Cummings JL, Toga AW. Cortical Variability and Asymmetry in Normal Aging and Alzheimer’s Disease. Cerebral Cortex. 1998;8:492–509. doi: 10.1093/cercor/8.6.492. [DOI] [PubMed] [Google Scholar]
- Thompson PM, Hayashi KM, de Zubicaray G, Janke AL, Rose SE, Semple J, Herman D, Hong MS, Dittmer SS, Doddrell DM, Toga AW. Dynamics of gray matter loss in Alzheimer’s disease. J Neurosci. 2003;23:994–1005. doi: 10.1523/JNEUROSCI.23-03-00994.2003. [DOI] [PMC free article] [PubMed] [Google Scholar]
- Thomann PA, Wustenberg T, Pantel J, Essig M, Schroder J. Structural changes of the corpus callosum in mild cognitive impairment and Alzheimer’s disease. Dement Geriatr Cogn Disord. 2006;21:215–220. doi: 10.1159/000090971. [DOI] [PubMed] [Google Scholar]
- Tomaiuolo F, Scapin M, Di Paola M, Le Nezet P, Fadda L, Musicco M, Caltagirone C, Collins DL. Gross anatomy of the corpus callosum in Alzheimer’s disease, regions of degeneration and their neuropsychological correlates. Dement Geriatr Cogn Disord. 2007;23:96–103. doi: 10.1159/000097371. [DOI] [PubMed] [Google Scholar]
- Tomimoto H, Lin JX, Matsuo A, Ihara M, Ohtani R, Shibata M, Miki Y, Shibasaki H. Different mechanisms of corpus callosum atrophy in Alzheimer’s disease and vascular dementia. J Neurol. 2004;251:398–406. doi: 10.1007/s00415-004-0330-6. [DOI] [PubMed] [Google Scholar]
- Ukmar M, Makuc E, Onor ML, Garbin G, Trevisiol M, Cova MA. Evaluation of white matter damage in patients with Alzheimer’s disease and in patients with mild cognitive impairment by using diffusion tensor imaging. Radiol Med. 2008;113:915–922. doi: 10.1007/s11547-008-0286-1. [DOI] [PubMed] [Google Scholar]
- Wang H, Su MY. Regional pattern of increased water diffusivity in hippocampus and corpus callosum in mild cognitive impairment. Dement Geriatr Cogn Disord. 2006a;22:223–229. doi: 10.1159/000094934. [DOI] [PubMed] [Google Scholar]
- Wang PJ, Saykin AJ, Flashman LA, Wishart HA, Rabin LA, Santulli RB, McHugh TL, MacDonald JW, Mamourian AC. Regionally specific atrophy of the corpus callosum in AD, MCI and cognitive complaints. Neurobiol Aging. 2006b;27:1613–1617. doi: 10.1016/j.neurobiolaging.2005.09.035. [DOI] [PMC free article] [PubMed] [Google Scholar]
- Weis S, Jellinger K, Wenger E. Morphometry of the corpus callosum in normal aging and Alzheimer’s disease. J Neural Transm Suppl. 1991;33:35–38. doi: 10.1007/978-3-7091-9135-4_6. [DOI] [PubMed] [Google Scholar]
- Wiltshire K, Foster S, Kaye JA, Small BJ, Camicioli R. Corpus callosum in neurodegenerative diseases, findings in Parkinson’s disease. Dement Geriatr Cogn Disord. 2005;20:345–51. doi: 10.1159/000088526. [DOI] [PubMed] [Google Scholar]
- Witelson SF. Hand and sex differences in the isthmus and genu of the human corpus callosum. A postmortem morphological study. Brain. 1989;112:799–835. doi: 10.1093/brain/112.3.799. [DOI] [PubMed] [Google Scholar]
- Yamauchi H, Fukuyama H, Nagahama Y, Katsumi Y, Hayashi T, Oyanagi C, Konishi J, Shio H. Comparison of the pattern of atrophy of the corpus callosum in frontotemporal dementia, progressive supranuclear palsy, and Alzheimer’s disease. J Neurol Neurosurg Psychiatry. 2000;69:623–629. doi: 10.1136/jnnp.69.5.623. [DOI] [PMC free article] [PubMed] [Google Scholar]
- Zarei M, Johansen-Berg H, Smith S, Ciccarelli O, Thompson AJ, Matthews PM. Functional anatomy of interhemispheric cortical connections in the human brain. J Anat. 2006;209:311–320.F. doi: 10.1111/j.1469-7580.2006.00615.x. [DOI] [PMC free article] [PubMed] [Google Scholar]
Associated Data
This section collects any data citations, data availability statements, or supplementary materials included in this article.