

Abstract
Opioid receptors are G protein-coupled receptors (GPCRs) of utmost significance in the development of potent analgesic drugs for the treatment of severe pain. An accurate evaluation at the molecular level of the ligand binding pathways into these receptors may play a key role in the design of new molecules with more desirable properties and reduced side effects. The recent characterization of high-resolution X-ray crystal structures of non-rhodopsin GPCRs for diffusible hormones and neurotransmitters presents an unprecedented opportunity to build improved homology models of opioid receptors, and to study in more detail their molecular mechanisms of ligand recognition. In this study, possible entry pathways of the non-selective antagonist naloxone (NLX) from the water environment into the well-accepted alkaloid binding pocket of a delta opioid receptor (DOR) molecular model based on the β2-adrenergic receptor crystal structure are explored using microsecond-scale well-tempered metadynamics simulations. Using as collective variables distances that account for the position of NLX and of the receptor extracellular loop 2 in relation to the DOR binding pocket, we were able to distinguish between the different states visited by the ligand (i.e., docked, undocked, and metastable bound intermediates), and to predict a free energy of binding close to experimental values after correcting for possible drawbacks of the sampling approach. The strategy employed herein holds promise for its application to the docking of diverse ligands to the opioid receptors as well as to other GPCRs.
Opioid receptors (ORs) are four closely-related members of the seven-helix transmembrane (TM) rhodopsin-like G protein-coupled receptor (GPCR) super-family widely distributed in the central nervous system (1). Three types of these receptors, namely the mu (MOR), delta (DOR), and kappa (KOR) opioid receptors, unequivocally mediate the analgesic effects of opium-derived alkaloids, endogenous opioid peptides, and several synthetic compounds in animal models (1). In contrast, the fourth member of the opioid receptor family, the distant nociceptin (or orphanin FQ) ‘opioid receptor-like’ (ORL) member, does not bind the vast majority of opioids, nor does it seem to produce hyperalgesia or analgesia after administration of ORL agonists (1).
Given the importance of DOR, MOR, and KOR in modulating opioid analgesia, it comes as no surprise that they have been the subject of intense research for developing potent opioid analgesics with fewer unwanted side effects. These side effects include sedation, euphoria, changes in thermoregulation, inhibition of gastrointestinal motility, respiratory depression, muscle rigidity, physical dependence, and abuse. Unfortunately, the lack of an experimental three-dimensional (3D) structure of ORs at atomic resolution has strongly limited understanding of the molecular determinants responsible for opioid receptor recognition and activation. During the past decade, we and others have proposed several ligand-bound 3D models of the ORs using different computational strategies (for a recent review, see (2)). These models were either obtained ab initio based on the projection maps of the prototypic GPCR bovine rhodopsin, or by homology modeling using the rhodopsin crystal structure as a template, or by imposing distance constraints derived from the various mutation studies available in the literature. Although these models could explain several mutational data, OR binding and activation processes for the purposes of drug design are still not fully understood. For instance, the opioid binding pathways from the water environment into the OR binding pocket, as well as the opioid precise mode of binding, are still unresolved matters.
Here we propose an energetically favorable binding pathway of the non-selective antagonist naloxone (NLX) from the water environment into the well-accepted alkaloid binding pocket of DOR spanning key residues in TM3, TM5, TM6, and TM7 that are shown to affect alkaloid binding (3–9). A 3D homology model of human DOR was built using the recent high-resolution X-ray crystal structure of β2-adrenergic receptor (β2AR) (10) as a structural template for the TM region, and a state-of-the-art ab initio loop prediction algorithm (11) for the intracellular loop (IL) and extracellular loop (EL) regions. For the flexible docking of NLX to DOR into an hydrated dipalmitoyl phosphatidyl choline (DPPC)-cholesterol lipid bilayer, we used a recently validated flexible docking method based on metadynamics (12), an enhanced sampling algorithm within the framework of classical molecular dynamics (MD) that enables efficient exploration of the multidimensional free energy surfaces of biological systems by adding a non-Markovian (history-dependent) bias to the interaction potential in the space defined by a few collective variables (CVs). We obtained reasonable estimates of the relative free-energy of the system relevant conformations from microsecond-scale well-tempered metadynamics (13) simulations, which were further analyzed using a combination of metadynamics and the nudged elastic band (NEB) approach (14). The latter simulations allowed us to identify the lowest free-energy entry pathway of NLX into the DOR alkaloid binding pocket, and to calculate a corresponding absolute binding free-energy very close to experimental results, after correcting for possible drawbacks of the sampling approach.
MATERIALS AND METHODS
Residue Numbering
Residues are numbered both according to their positions in the human DOR sequence, and to the two-number identifier by Ballesteros & Weinstein (15) reported as a superscript. Specifically, the first number (from 1 to 7) of this two-number identifier refers to the TM helix number, whereas the second number indicates the residue position in the helix relative to the most conserved residue (assigned index of 50) in that helix, with numbers decreasing toward the helix N-terminus and increasing toward its C-terminus.
Molecular Modeling
The TM region of human DOR was built by homology modeling with Modeller 9v3 (16) using the X-ray crystal structure of β2AR at 2.4 Å resolution (PDB ID: 2RH1) as a structural template (10), and the β2AR-DOR sequence alignment deposited in the GPCR database (17), which is based on highly conserved functional residues in the TM segments. We preferred the β2AR template over rhodopsin because of its ability to bind diffusible hormones and neurotransmitters similar to opioid receptors. The DOR IL1–3 (6, 10, and 11 amino acid residues, respectively) and EL1–3 (5, 24, and 10 amino acid residues, respectively) regions were generated using the enhanced ab initio loop prediction approach implemented in the Rosetta 2.2 code (11). Selection of this approach over other fairly reliable and fast ab initio loop prediction algorithms (e.g., MODELLER 9v3 (16) with either MODLOOP (18) or DOPE (19) energy functions, LOOPY 1.5 (20), and PLOP 1.7 (21)) was based on testing the ability of the diverse methods to predict conformations of the long IL2 (13 amino acids) and IL3 (23 amino acids) regions of bovine rhodopsin, as well as the IL2 regions of human β2AR (12 amino acids), turkey β1 adrenergic receptor (β1AR; 12 amino acids), and human adenosine A2A receptor (AA2AR; 13 amino acids) close to their corresponding crystal structures (PDB identification codes 1GZM, 2RH1, 2VT4, and 3EML, respectively). Specifically, the conformation of each of these loops was predicted in the absence of the others, using the algorithms specified above with their default options. For the specific case of EL2, the conserved disulfide bridge between C1213.25 and C198 was introduced according to experimental data demonstrating the importance of this interaction in ligand binding and structural stability of ORs (22). As shown in Supporting Information (SI) Table S1, the lowest-energy conformations identified by Rosetta exhibited the lowest root mean square deviation (RMSD) from the available crystallographic minima. Thus, we used the conformational predictions of isolated loops from Rosetta to obtain a complete molecular model of DOR, and refined these loops (first the three EL regions together, and then the three IL regions together) in the context of the entire protein, while keeping the coordinates of the protein TM region restrained to their initial position. The N-terminus (residues 1–44) and C-terminus (residues 335–362) regions were not included in this model of DOR. On the contrary, C333 was palmitoylated and the crystallographic water molecules found in the interior of the β2AR structural template (10) were added to the DOR model.
MD Simulations
A combined united-atom lipid and all-atom protein model implemented by Tieleman and coworkers (23) in the molecular dynamics simulation software GROMACS (24) to reduce the computational cost of membrane protein simulations was used to simulate the DOR-NLX complex in a DPPC/cholesterol/water environment. Specifically, re-parameterized (23) Berger united-atom lipid dihedral parameters were used for the DPPC molecules in combination with the Optimized Potentials for Liquid Simulations-All Atom (OPLS-AA) force-field (25) for DOR, NLX, and cholesterol, and the SPC/E model for the water molecules. First, an initial pre-equilibrated hydrated 54 × 54 × 89 Å patch of DPPC containing 20% cholesterol (26) was equilibrated for 10 ns of unrestrained MD simulations using the adapted (23) Berger united-atom force field for DPPC, and the OPLS-AA force field for the cholesterol molecules. Subsequently, a larger hydrated DPPC/cholesterol tetragonal unit cell composed of 416 DPPC and 104 cholesterol molecules was built by duplicating the original DPPC/cholesterol/water patch 4 times, so as to accommodate the receptor. The initial complete ligand-free 3D model of human DOR described in the previous section was placed in this large hydrated DPPC/cholesterol bilayer by orienting the DOR hydrophobic belt, previously evaluated using the APBS software (27), with respect to the bilayer normal. To allow for fast system equilibration, DOR was inserted in this membrane using a method that first places the lipid and the protein on a spaced grid, and then reduces the grid to achieve a compact packing of the lipid molecules around the protein (28). Thus, a resulting 79 × 79 × 92 Å system including 290 amino acid residues of the DOR protein, 185 DPPC molecules, 53 cholesterol molecules, 9,658 water molecules and 14 chloride counterions, for a total of 46,890 atoms, was equilibrated by standard MD keeping first the protein coordinates frozen for 5 ns, and then allowing all the atoms to move for 10 ns. The same simulation protocol and parameters described in (23) were used to equilibrate this system. Specifically, MD simulations were carried out in the NPT ensemble (constant pressure and temperature) under periodic boundary conditions, using the Berendsen coupling scheme (29) with a barostat time constant of 4.0 ps to maintain a constant pressure of 1 bar, and with a time constant of 0.1 ps to maintain a constant temperature of 300 K. The LINear Constraint Solver (LINCS) algorithm (30) was used to preserve the bond lengths of DOR, NLX, DPPC, and cholesterol, while the SETTLE algorithm (31) was used to maintain the geometry of the water molecules. Lennard-Jones interactions were treated with a twin-range cutoff of 0.9/1.4 nm, an integration time step of 2 fs, and the neighbor list updated every 10 steps. Electrostatic contributions to the energies and forces were calculated using the Particle-Mesh Ewald (PME) summation algorithm (32), with a cutoff of 0.9 nm for real-space interactions, and a 0.12 nm grid with fourth-order B-spline interpolation for reciprocal-space interactions.
Metadynamics Simulations
To focus the sampling on the physically relevant regions of the order parameter space, we applied the well-tempered metadynamics approach (13), an enhanced sampling algorithm within the framework of classical MD. We first obtained an overall free-energy profile of the NLX binding event by carrying out well-tempered metadynamics simulations with the same MD protocol described above, but a Parrinello-Rahman coupling scheme (33) with a barostat time constant of 1.0 ps to maintain a constant pressure of 1 atm, and the Nosé-Hoover coupling scheme (34) with a time constant of 1.0 ps to maintain a constant temperature of 300K. The deposition rate of the Gaussian bias terms was set to 1.5 ps, and their initial height to 0.3 kJ/mol (~0.07 kcal/mol), with a bias factor of 15. To efficiently exploit parallel machines, we used the multiple walker approach (35), in which several simulations explore the same free-energy surface and interact by contributing to the same history-dependent bias potential. The choice of the starting conformation of the walkers was based on low energy states identified by a first metadynamics simulation at a higher bias factor (T+ΔT=4500 K). To obtain an overall free-energy profile of the flexible docking of NLX to DOR, we initially used two different collective variables, termed here CV1 and CV2. Specifically, CV1 consisted of the distance between the center of mass (COM) of the heavy atoms of NLX and the COM of the heavy atoms of the well-accepted alkaloid binding pocket of ORs. According to experimental data from mutagenesis and competition binding assays, this alkaloid binding pocket is composed of the following key OR-conserved residues in TM3, TM5, TM6, and TM7 of DOR: D1283.32 (3–5), Y1293.33 (6), F2185.43 (6), F2225.47 (6), W2746.48 (6), H2786.52 (7–9), and Y3087.43 (6, 7). The other collective variable, CV2, accounted for the opening of the EL2 region from C198 to W209, and was defined by the distance between the COM of the DOR alkaloid binding pocket and the COM of the heavy atoms of the EL2 middle residues from C198 to P205. For both CVs, the Gaussian width σ was set to 0.5 Å. To contain the sampling of states in which the ligand is completely solvated, a maximum distance of 35 Å along the CV1 was enforced by means of a steep wall implemented as a repulsive polynomial potential. The system was simulated for a total of 0.5 μs using 10 walkers whose bias potential was updated every 150 ps. These walkers were periodically checked to ensure sampling of different basins of the free-energy surface during simulation.
After obtaining an overall free-energy profile of the NLX binding event (Figure 2) with the protocol described above, two additional metadynamics simulations were carried out 1) to calculate the free energy difference between the fully solvated state of NLX and its first bound state on the DOR surface (B1 in Figure 2), and 2) to determine the minimum free-energy path between the NLX first bound state on the DOR surface (B1 in Figure 2) and its final docked state into the receptor alkaloid binding pocket (Figure 3). Specifically, the free-energy difference between the fully solvated state of NLX and its first bound state on the DOR surface (Figures 4A,B) was assessed using the approach described in (36). To efficiently sample the ligand in the bulk solvent region, we applied a steep repulsive potential that restrained NLX sampling to a conical region (see Figure 1) centered at the binding pocket COM and defined by ϕ≤5°, where ϕ is the angle between the COM of NLX, the COM of the binding pocket, and residue L3007.35 at the extracellular end of TM7. The free-energy of this system was then calculated as a function of the two collective variables CV1 and CV2 using well-tempered metadynamics, while the CV2 variable describing the position of the flexible EL2 middle region was integrated to obtain an estimate of the free-energy of the ligand in the presence of the conical constraint. Except for the constraint on the ligand position, the parameters used for these simulations were similar to those reported above in regard to the overall free-energy profile of NLX binding. Since the position of the ligand with respect to the protein can be described in spherical coordinates by the values of CV1, ϕ, and a third angle ω, the binding constant Keq−1 describing the equilibrium between the bound state and a state in which the ligand is at a reference position r′ far away in the bulk, is defined, according to (36, 37), by:
| 1 |
where W(r) is the free energy of the system when the ligand is at position r, kB is Boltzmann’s constant, T the temperature, HSite =1 when the ligand is in the bound state and 0 otherwise, J is the Jacobian of the spherical coordinates, and ΔW(r)=W(r)−W(r′). The mono-dimensional projection w(CV1) of the free energy along the first collective variable in the presence of the angular restraint is given by:
| 2 |
where C is a normalization factor and the integral is calculated over the solid angle Ω defined by the conical restraint. Letting Rbulk=35 Å be a reference point in the bulk solvent, and choosing w(Rbulk) = 0 we obtain the normalization constant as follows:
| 3 |
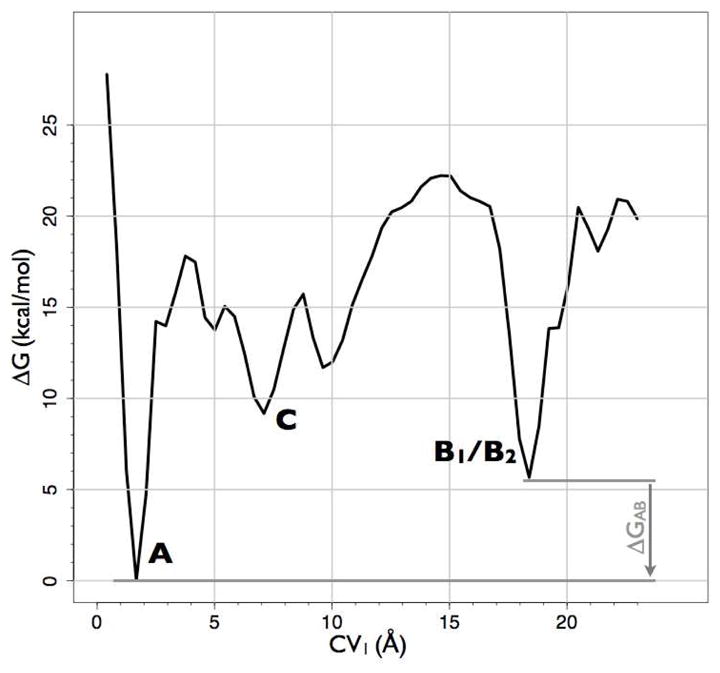
Figure 2.

Free-energy surface of the NLX-DOR system reconstructed by well-tempered metadynamics as a function of the distance of the NLX COM (CV1) and of the distance of EL2 COM (CV2) from the binding pocket COM. Relevant states are labeled A (NLX bound into the well-accepted OR alkaloid binding pocket), B (NLX bound at the EL2/EL3 recognition cleft), and C (NLX at a metastable state in the helix bundle). Each contour represents a free-energy difference of 2 kcal/mol. The red solid line refers to the entry path obtained by NEB that was used to generate the entry path collective variables. Also represented are images of A, B1, B2, and C metastable states of DOR cut along their TM4 face and the position of NLX (black spheres) in the corresponding states.
Figure 3.
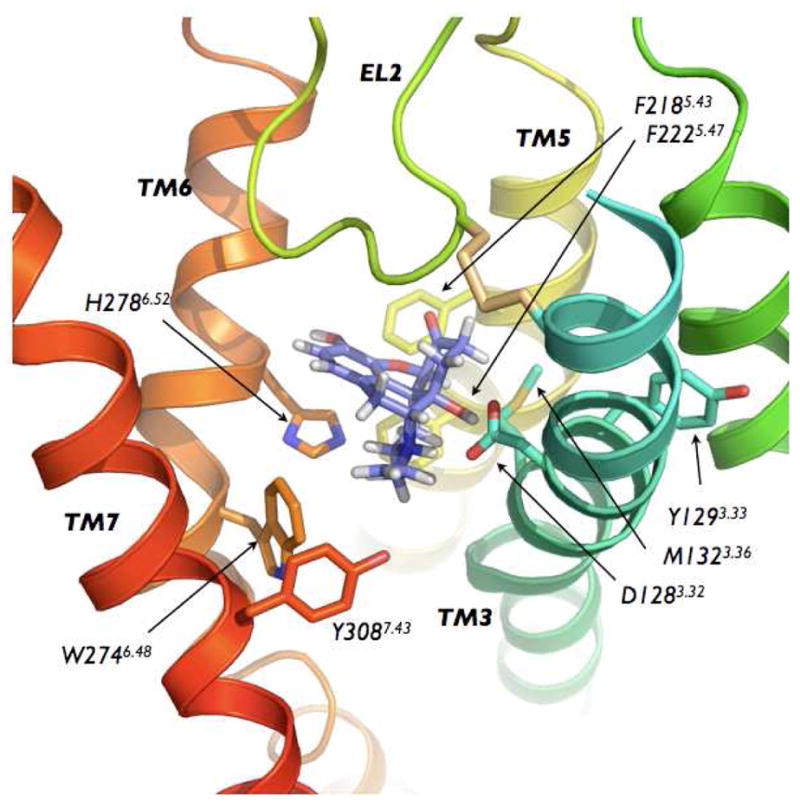
Representative conformation extracted from the basin A of the free-energy surface showing NLX bound to the DOR well-accepted alkaloid binding pocket. Parts of TM2 and TM4 have been removed for clarity.
Figure 4.

Representative conformations extracted from basins B1, B2 and C of the free-energy surface. Top (as seen from the extracellular side) and side views of NLX bound (A, B) to the EL2/EL3 cleft on the DOR surface in the conformation extracted from the B1 basin, (C, D) to the EL2/EL3 cleft on the DOR surface in the conformation extracted from the B2 basin, and (E, F) within the helix bundle, in the conformation extracted from the C basin.
Figure 1.
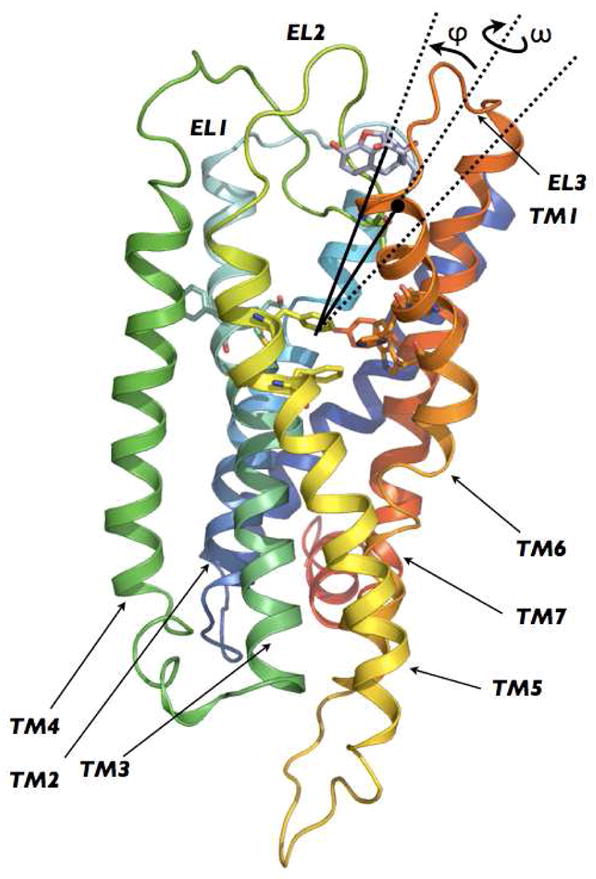
Side view of the initial 3D model of human DOR built according to the procedure described in Methods. TM1, TM2, TM3, TM4, TM5, TM6, and TM7 are colored in purple, blue, light blue, light green, green, yellow, orange and red, respectively. The 5-degree conical restraint that was applied to circumscribe NLX sampling is indicated by the black lines defining the angle between the COM of the binding pocket, the COM of the ligand, and the COM of residue L3007.35 (black dot in the figure).
Replacing this value of C in equation 2, we obtain:
| 4 |
Finally, combining equation 4 with equation 1, and defining HSite(CV1, ϕ, ω) = HSite(CV1) HΩ(ϕ, ω), we calculate Keq−1 according to the following equation:
| 5 |
Based on the overall free-energy profile of the NLX binding event (Figure 2), we choose HSite(CV1) = 1 for 17 Å ≤ CV1 ≤ 20 Å to obtain a reasonable free-energy estimate for NLX binding to the DOR surface.
To determine the minimum free-energy path between the first NLX bound state on the DOR surface and its bound state into the well-accepted alkaloid binding pocket, we used a combination of metadynamics and the nudged elastic band (NEB) approach (14). Specifically, starting from a rough connection between the first binding region of NLX on the DOR surface (state B1 in Figure 2, CV1≈19 Å and CV2≈16 Å) and the docked conformation into the well-accepted alkaloid binding pocket (state A in Figure 2, CV1≈2 Å and CV2≈12 Å) and, considering it as a set of N=50 beads connected by springs, we relaxed it on the free energy surface of Figure 2 as in a NEB calculation (38), keeping the end points fixed. Thus, we obtained a set of N=50 points in the collective variables’ space along a minimum free energy path going from the first NLX bound state B1 on the surface of DOR to its docked state A into the alkaloid binding pocket. We then optimized the NLX entry process using a path collective variable approach (14). The metric we used was defined using a contact map, as follows. For all the residues Rj of the binding pocket and of EL2 considered in the definition of collective variables CV1 and CV2, we let rj = | | Rj − RCOM | |/r0 where RCOM is the position of the ligand COM and r0 is a parameter defining the scale of contact interaction. In the calculations reported here, we used r0= 8 Å. The contact map is defined as Mj=(1−rj10)(1−rj12)−1 and a distance between two conformations is introduced by d(M(1),M(2)) = Σj (Mj(1)−Mj(2)). Using this metric we extracted kmax=10 evenly spaced contact maps M(k) (with 1≤k≤ kmax) along the path, and used them to define collective variables CV3 and CV4 which describe the position along and the distance from the proposed entry path, respectively, taking the value of 0 outside the receptor and of 1 within the alkaloid binding pocket. Specifically these CVs are described by the following equations:
| 6 |
and
| 7 |
where Z = Σk exp(−λ d(M,M(k))), and λ =2.1 is chosen so as to have λ−1 ≈d(M(k),M(k+1)). Well-tempered metadynamics was then performed using CV3 and CV4 as variables with σ3=0.5 and σ4=1, respectively.
All simulations were performed using GROMACS 4.0.5 (24) with PLUMED (39).
RESULTS
To the best of our knowledge, this is the first time the results of a free-energy calculation, and the suggestion of a preferred binding pathway, are presented for a ligand-OR complex in an explicit lipid-water environment.
Environment
A large hydrated patch of 416 DPPC and 104 cholesterol molecules was generated by duplicating a pre-equilibrated hydrated 54 × 54 × 89 Å DPPC patch containing 20% cholesterol (26) to simulate the membrane environment of the DOR-NLX complex. To equilibrate this solvent system, a 10 ns unrestrained MD simulation was carried out using a combination (23) of an adapted Berger united-atom force field for the DPPC molecules and the OPLS-AA force field (25) for the cholesterol molecules. Stability of the lipid environment during the last 5 ns of the 10 ns MD trajectory was ascribed to the convergence of the surface area per lipid in the xy plane, and of the deuterium order parameter profile to their published values. As shown in SI Figure S1A, the area of the surface area per lipid in the xy plane fluctuated around 45 Å2, which is close to previous results (26). The deuterium order parameter profile taken over the last 5 ns of the trajectories (shown in SI Figure S1B) was also consistent with the results of the Gromos96 calculations of the pre-equilibrated DPPC/cholesterol patch used to build the larger membrane bilayer that would accommodate DOR (26).
Initial 3D Model of Human DOR
Figure 1 shows a side view of the initial human DOR 3D model we built following the procedure described in detail in Methods. Briefly, while the TM regions of the human DOR molecular model were built by homology modeling using the recent crystal structure of β2AR as a structural template (10), loop regions were generated ab initio due to their low sequence identity with corresponding regions in GPCRs of known structure. The overall Cα RMSD of the helical bundle region of the DOR model was 0.7 Å with respect to the β2AR template. As expected, the inter-helical hydrogen bonding network among conserved residues within the helical bundle remained the same between the target and the template. Receptor residues proven to be adjacent in space by mutagenesis were also found to be in close proximity in the DOR model. For instance, a spatial proximity was observed between family A-conserved residues D952.50 and N3147.49, in agreement with previous experimental evidence (40). The D1453.49 side chain interacted strongly with R1463.50 in the family A-conserved DRY motif, also in agreement with previous computational studies supported by experiments (41). H-bonds between conserved residues D1283.32 and Y3087.43 or between R1463.50 of the E/DRY motif and TM6 were also present in the DOR model. Since in ORs the usual R3.50 partner, residue E6.30 in both rhodopsin and β2AR, is replaced by a leucine (L2566.30), the main interaction between TM3 and TM6 in DOR appeared to be replaced by a H-bond between R1463.50 and OR-conserved residue T2606.34, as previously suggested in the literature (42, 43). The accessibility pattern of several TM6 residues (e.g., F2706.44, I2776.51, V2816.55, I2826.56, T2856.59, and L2866.60) in the binding-site crevice of DOR was also consistent with previous experimental data resulting from application of the substituted cysteine accessibility method (44). The overall folding of the IL1 and IL2 regions of the initial 3D DOR model resembled that of the corresponding loops in β1AR and AA2AR. IL3 conformation appeared to be bent toward the center of the helical bundle with a helical motif of 5 residues (L245-S249) in the middle. The EL1 folding was quite comparable to the EL1 conformations found in the crystal structures of adrenergic receptors, while the predicted EL2 and EL3 conformations were more similar to those of rhodopsin, with EL2 occluding the access to the well-accepted OR alkaloid binding site.
The initial 3D model of DOR was embedded in the pre-equilibrated DPPC/cholesterol patch described above according to an optimal matching of the DOR hydrophobic and hydrophilic surfaces to the non-polar lipid tails and water molecules, using the procedure described in Methods. The entire system was then equilibrated for a total of 15 ns using standard MD with a constant temperature and pressure. In the first 5 ns, the receptor was restrained to allow relaxation of the environment prior relaxation of the entire system during the following 10 ns. During the unrestricted equilibration, the system maintained its overall fold, and the well-accepted alkaloid binding pocket became solvated. The backbone RMSD did not exceed 2.5 Å and averaged around 1.6 Å in the TM region and 2.1 Å in the loop regions (see SI Figure S2). Visual inspection of the RMSD fluctuation of each individual residue (SI Figure S3) confirmed that the main structural deviation originated from the flexible loops, especially from EL2, IL3, and EL3.
Entry Pathway of NLX into DOR Alkaloid Binding Pocket
The entry pathway of the non-selective antagonist NLX into the well-accepted alkaloid binding pocket of the equilibrated ligand-free 3D molecular model of DOR was simulated using a recently validated flexible docking procedure based on metadynamics (12). The two CVs chosen to describe the relevant degrees of freedom in the NLX binding process were: 1) CV1, the distance between the COM of NLX and the COM of the well-accepted alkaloid binding pocket of ORs (see Methods section for definition), accounting for the position of NLX with respect to the alkaloid binding pocket, and 2) CV2, the distance between the COM of the EL2 middle region and the COM of the DOR binding pocket, describing the opening of the EL2 region from C198 to W209.
The free-energy surface reconstructed from the first microsecond-scale well-tempered metadynamics is reported in Figure 2 as a function of CV1 and CV2. The most stable bound state (−35.2 kcal/mol) of NLX to DOR (state A in Figure 2) is identified in a region with CV1≈2 Å and CV2≈12 Å. The representative structure of this energy basin (Figure 3) shows a bound NLX between TM3, TM5, TM6, and TM7. According to experimental data from mutagenesis and competition binding assays (3–9), NLX is found to interact strongly with D1283.32 via a salt bridge through its ammonium group, and a polar interaction with its alcohol moiety. Additional interactions that strongly contribute to this NLX bound state are a stacking interaction with the aromatic ring of H2786.52, and hydrophobic interactions between the propyl region of NLX and the side chains of W2746.48 and Y3087.43. Van der Waals interactions between NLX and OR-conserved residues F2185.43 and M1323.36 also stabilized this specific orientation of NLX in the binding pocket.
Before entering the well-accepted OR binding pocket, NLX binds to a cleft formed by EL2 and EL3 regions on the DOR surface (states B1 and B2 in Figure 2). In the absence of the ligand, this cleft is stabilized by a salt bridge between the R292 side chain of EL3 and the Q201 backbone of EL2. The side chain of EL2 Q201 also forms a hydrogen bond with the oxygen of Y1092.64 at the extracellular end of TM2. NLX binding to this EL2/EL3 cleft destabilizes these polar interactions, and leads to two different metastable states, termed B1 and B2 (−22.5 and −29.2 kcal/mol, respectively, in the free-energy profile of Figure 2). Representative structures of these energy basins (Figure 4, panels A–D) show that a different opening of the EL2 region from C198 to W209 with respect to the alkaloid binding pocket constitutes the main difference between states B1 and B2. Specifically, in the B1 state (CV1≈19 Å and CV2≈16 Å in Figure 2), EL2 is in a “closed” configuration, making contacts with EL3, and blocking the entry of NLX into the alkaloid binding pocket (see Figure 4, panels A and B). In this conformation, NLX is found to interact with the EL2/EL3 cleft through 1) a salt bridge with D290, 2) van der Waals contacts with W2846.58, 2) hydrophobic interactions with L3007.35, P205, and F202, and 3) a water-mediated interaction with Y2085.33. In contrast, the B2 state is characterized by higher values of CV2 (CV2≈20 Å in Figure 2), thus showing an “open” conformation of the EL2 region C198-W209 (Figure 4, panels C and D). Unlike state B1, NLX destabilization of the EL2/EL3 cleft in this configuration led to the formation of a new polar contact between EL2 residue Q201 and EL1 residue T113. This more open conformation of the EL2 region C198-W209 allows the ligand to move further down in the helix bundle, sliding down the gorge formed by the hydrophobic internal sides of the TM helices, and forming favorable interactions with L3007.35, V2977.32 and L1102.65 (Figure 4, panels C and D). From this location, NLX moves through different alternative pockets within the helix bundle before accessing the alkaloid binding pocket (state A). As suggested by the reconstructed free-energy of Figure 2, the most stable of these states is metastable state C (−28.2 kcal/mol). As found in its representative structure (Figure 4, panels E and F), in this configuration NLX maintains its interactions with L3007.35 and L1102.65 and is further stabilized by interactions with I3047.39 and L1253.29.
To identify a minimum free-energy entry path (solid red line in Figure 2) between the first metastable bound state of NLX on the DOR surface (state B1) and its most stable bound state in the well-accepted OR binding pocket (state A), we used the NEB approach as described in detail in Methods. To study the details of the interactions of NLX with the protein along this path, and to accurately estimate the free energy profile of the entry of the ligand towards the binding pocket, we used a more accurate metadynamics simulation using the path collective variable approach (see Methods for details). The contact map between the ligand COM and the residues of EL2 and of the alkaloid binding pocket originally used to define CV1 and CV2 was defined to derive two collective variables (CV3 and CV4; see details in Methods) that described the progression of the system from state B1 to state A along the path indicated in Figure 2, and its distance from it. This method has been shown to optimize transition paths in a variety of systems (14). Here, we obtained the free-energy profile depicted in Figure 5, which confirms that the states already sampled and used to describe the NLX entry path above, represent the optimal route of NLX from the DOR surface to the alkaloid binding pocket.
Figure 5.

The free-energy surface reconstructed using well-tempered metadynamics as a function of the position along (CV3) and the distance from (CV4) the suggested NLX entry path. Each contour represents a free-energy difference of 2 kcal/mol. Relevant states are labeled according to Figure 2, and are: A (NLX bound to the DOR well-accepted alkaloid binding pocket, see Figure 3), B1 (NLX bound to the most external location on the EL2/EL3 cleft, see Figures 4A,B), B2 (NLX bound to a more stable position on the EL2/EL3 cleft, see Figures 4C,D) and C (NLX at a metastable state within the helix bundle).
Equilibrium Binding Constant of NLX
To calculate the equilibrium binding constant of NLX at the alkaloid binding pocket of DOR (state A), we proceeded as follows. Classically, the equilibrium binding constant Keq−1 for a specific ligand (L)-protein (P) interaction (L + P ↔ LP) is defined as Keq−1= [LP][L]−1[P]−1, where [L], [P], and [LP] are the equilibrium concentrations of the unbound ligand, unbound protein, and bound complex, respectively. For NLX, we identified two stable bound states: a first one at the E2/EL3 cleft of the DOR surface (state B1), and a second more stable one (state A) within the well accepted alkaloid binding pocket of DOR. Thus, depending on which binding state we are considering, the above Keq−1 equation can be expressed as Keq−1 (A)=[L]−1 pA/pBulk or Keq−1 (B)=[L]−1 pB/pBulk where pA, pB, and pBulk are the fractions of DOR with the ligand bound in state A, state B, or ligand-free, respectively. Observing that pA = pB e−(ΔGAB)/kBT, we can express the equilibrium binding constant for state A as a function of the equilibrium of the first binding of NLX to the E2/E3 recognition cleft, thus obtaining the following equation:
To obtain a more accurate estimate for Keq−1 (B), which depends on an improved sampling of NLX in the bulk solvent compared to the metadynamics sampling obtained by using as a CV a simple distance between the NLX COM and the COM of the binding pocket, we applied the approach described in (36), and allowed NLX to only move in a conical region (see Figure 1) centered at the COM of the binding pocket, and containing the E2/E3 cleft. We used metadynamics with collective variables CV1 and CV2 to obtain a restrained free-energy profile, following the protocol and equations described in Methods. The Keq (B) value resulting from these calculations was 0.77 mM. The free-energy difference ΔGAB=GA−GB = −5.5 kcal/mol between the bound states A and B was obtained from the integration of the reconstructed free-energy surface of Figure 2, reported in Figure 6. Inspection of the convergence rate of the free energy difference between states A and B, suggested an error estimate on the free energy of ~0.2 kcal/mol. Replacement of the aforementioned Keq (B) and ΔGAB values in the Keq−1 (A) equation reported above yielded a Keq (A) value of 80 ± 13 nM.
Figure 6.
Integration of the free-energy profile of Figure 2 over the CV2 variable (distance of the EL2 C198-W209 region from the receptor alkaloid binding pocket) reported as a function of the CV1 variable (distance of NLX from the receptor alkaloid binding pocket) in the 0<CV1<20 region. The free-energy profile was shifted so that the reference state corresponds to the most stable one.
DISCUSSION
In this work, we investigated possible entry pathways of NLX from the bulk into the well-accepted alkaloid binding pocket of DOR. Our initial molecular model of DOR based on the recent β2-adrenergic receptor crystal structure represents a structural improvement over previous homology models of opioid receptors, and an unprecedented opportunity to obtain more accurate results from studies of the molecular mechanisms of the OR ligand recognition process. Thus, we embedded our improved DOR model into a hydrated DPPC-cholesterol lipid bilayer, and carried out microsecond-scale well-tempered metadynamics simulations using as CVs distances describing the position of NLX and of EL2 with respect to the alkaloid binding pocket. Membrane cholesterol was included in the solvent representation because of its modulatory role in the function and structure of a number of GPCRs (e.g., see (45)). Since recently reported crystal structures of GPCRs have shown structural evidence for specific interactions between cholesterol molecules and the receptor (46), we chose to use an all-atom representation of the cholesterol molecules combined with a united-atom representation of the DPPC molecules. Our results confirmed the stability of the lipid environment during simulations, consistent with the results of previous calculations (26).
The metadynamics approach described in this paper suggests a preferential entry pathway of the non-selective antagonist NLX into the TM region of DOR, starting at a molecular recognition site on the DOR surface, and ending in a preferred orientation into the receptor alkaloid binding pocket. Specific ligand exit and entry pathways have recently been proposed for β2AR, based on random acceleration MD simulations of the ligand-bound and ligand-free receptor, respectively (47). Analysis of 100 egress simulation trajectories obtained by applying randomly oriented forces to the COM of carazolol suggested that the ligand main exit route from the binding pocket was through the extracellular surface, and caused the breakage of a hydrogen bond between residues within EL2 and EL3/top TM7 (47). The same type of simulations performed on a putative ligand-free conformation of β2AR from nanosecond-scale standard MD simulations suggested that the ligand main entry route to the binding pocket was through a cleft at the receptor extracellular side formed by TM2, TM3, TM7, and a hydrophobic patch bridging EL2 and EL3/top TM7. Although not directly comparable, the results of our simulations also suggest a preferential binding pathway of NLX to DOR from the extracellular region of the receptor. Although the selected CVs might have confined the exploration of binding pathways to the receptor extracellular region, our metadynamics simulations provide an enhanced sampling of the entry/exit pathways of NLX by accounting for the receptor EL2 flexibility during the binding process.
Our reconstructed free-energy surface of the NLX binding event suggests that the ligand first interaction with the extracellular region of DOR occurs at a cleft formed by EL2 and EL3. A strong electrostatic interaction between the quaternary nitrogen of the ligand and the charged human DOR-specific residue D290 within the EL2/EL3 cleft appears to provide the main stabilizing force for this first bound state of NLX. A D290A mutation, however, does not have a strong effect on ligand binding to human DOR, as shown by competition binding assays (48). Thus, additional residues within or close to the EL2/EL3 cleft must help stabilizing the first NLX recognition site on the DOR surface. Specifically, these residues are: 1) OR-conserved residues L1102.65, EL2 F202, and I3047.39; 2) DOR and MOR-conserved residues EL2 P205 (D in KOR), and Y2085.33 (W in KOR); and 3) DOR-specific residues L1253.29 (I in both MOR and KOR), W2846.58 (K in MOR, and E in KOR), V2977.32 (T in MOR, and L in KOR), and L3007.35 (W in MOR and Y in KOR). Among them, alanine mutations of DOR-specific residues W2846.58 (48) and V2977.32 (48) have been reported in the literature to significantly decrease the binding of delta-selective ligands. In contrast, the I3047.39T mutation did not reduce the binding affinity of a set of opioid alkaloids tested, but rather altered the functional characteristics of the receptor (49). It would be interesting to measure by single-point or combined mutations whether the other residues listed above have a significant effect on the NLX binding affinity, or are rather part of a transient binding state, as predicted by our simulations.
Our study shows that the EL2 region C198-W209 is in dynamic equilibrium between a close and an open conformation. Prior to ligand binding, EL2 is stabilized in a close conformation occluding the access of NLX to the well-accepted alkaloid binding pocket of DOR through contacts between EL2 residue Q201 (conserved in KOR, but T in MOR) and EL3 residue R292 (E in MOR and H in KOR), and between Q201 and the OR-conserved TM2 residue Y1092.64. In the EL2 alternative conformation, EL2 Q201 interacts with EL1 T113 (conserved in MOR, but S in KOR), allowing sufficient loop opening for a continuous ligand entry path to the binding pocket. It would be interesting to see whether a Q201A mutation of human DOR would facilitate an open conformation of the EL2 region C198-W209, thus playing a role on the kinetics of ligand binding to DOR.
While in the absence of ligands the closed conformation of EL2 is probably favored, the presence of NLX on the EL2/EL3 cleft partially disfavors the interaction of EL2 with EL3, leading to a more stable open state of the EL2 region from C198 to W209. Following its binding on the DOR surface, NLX moves deeper into the TM bundle, finally reaching a preferred orientation within the well-accepted alkaloid binding pocket. Thus, according to experimental data from mutagenesis and competition binding assays (3–9), NLX anchors itself via a salt bridge and a polar interaction to D1283.32, forming additional strong interactions with the aromatic ring of H2786.52, and the side chains of M1323.36, F2185.43, W2746.48, and Y3087.43.
The results of our metadynamics simulations, corrected to improve ligand sampling in the bulk region, provide equilibrium constant values for the final bound state of NLX very close to experimental results. Different experimental values have been reported for the binding affinity of NLX to DOR using competition binding assays. Using DOR from human CHO cells and different radiolabeled ligands (3H-Diprenorphine (50), 3H-DPDPE (51) and 3H-naltrindole (52)]), the following Ki values were reported in the literature in support of NLX binding to human DOR: 37 ± 5 nM (n=10 experiments), 67.5±40 nM, and 488±107 nM (n=4 experiments), respectively. A fourth study using DOR from human HEK293 cells and 3H-Diprenorphine as a hot ligand (53) reported Ki = 66.2±0.71 nM. Our calculated Keq value of 80 ± 13 nM is remarkably close to the majority of reported experimental values, making the free-energy calculations employed herein extremely valuable for possible applications to other opioid receptors and other GPCRs.
Supplementary Material
Acknowledgments
The authors are grateful to Dr. George Khelashvili for sharing the equilibrated coordinates of the DPPC-20% cholesterol bilayer patch, and to Dr. Jennifer Johnston for comments on the paper.
ABBREVIATIONS
- 3D
three-dimensional
- AA2AR
adenosine A2A receptor
- β1AR
β1 adrenergic receptor
- β2AR
β2-adrenergic receptor
- COM
center of mass
- CV
collective variables
- DOR
delta opioid receptor
- DPPC
dipalmitoyl phosphatidyl choline
- EL
extracellular loop
- GPCRs
G-protein coupled receptors
- IL
intracellular loop
- KOR
kappa opioid receptor
- MD
molecular dynamics
- MOR
mu opioid receptor
- NEB
nudged elastic band
- NLX
naloxone
- ORs
opioid receptors
- ORL
opioid receptor-like
- PDB ID
Protein Data Bank IDentification
- RMSD
root mean square deviation
- SI
- TM
transmembrane
Footnotes
This work was supported by NIH grants DA020032 and DA026434 from the National Institute on Drug Abuse. The computations were supported in part by the National Science Foundation through TeraGrid advanced computing resources provided by TRAC MCB080077. AB was supported in part by a 2008-2009 American-Italian Cancer Foundation Post-Doctoral Research Fellowship.
SUPPORTING INFORMATION AVAILABLE
Additional details concerning the methods used and results obtained are provided. Table S1 reports the structural differences between ab initio-predicted conformations of long intracellular loop regions of GPCRs with known crystal structure and their corresponding regions in the crystals. Figure S1 shows the dynamic behavior of the DPPC-20% cholesterol membrane environment during the last 5 ns of 10 ns MD simulations. Figure S2 shows the time evolution of the backbone RMSD of human DOR during 10 ns unrestricted MD equilibration. Figure S3 shows the RMSD fluctuation per residue of human DOR during 10 ns unrestricted MD equilibration. This material is available free of charge via the Internet at http://pubs.acs.org.
References
- 1.Stevens CW. The evolution of vertebrate opioid receptors. Front Biosci. 2009;14:1247–1269. doi: 10.2741/3306. [DOI] [PMC free article] [PubMed] [Google Scholar]
- 2.Pogozheva ID, Przydzial MJ, Mosberg HI. Homology modeling of opioid receptor-ligand complexes using experimental constraints. Aaps J. 2005;7:E434–E448. doi: 10.1208/aapsj070243. [DOI] [PMC free article] [PubMed] [Google Scholar]
- 3.Befort K, Tabbara L, Bausch S, Chavkin C, Evans C, Kieffer B. The conserved aspartate residue in the third putative transmembrane domain of the delta-opioid receptor is not the anionic counterpart for cationic opiate binding but is a constituent of the receptor binding site. Mol Pharmacol. 1996;49:216–223. [PubMed] [Google Scholar]
- 4.Surratt CK, Johnson PS, Moriwaki A, Seidleck BK, Blaschak CJ, Wang JB, Uhl GR. -mu opiate receptor. Charged transmembrane domain amino acids are critical for agonist recognition and intrinsic activity. J Biol Chem. 1994;269:20548–20553. [PubMed] [Google Scholar]
- 5.Li JG, Chen C, Yin J, Rice K, Zhang Y, Matecka D, de Riel JK, DesJarlais RL, Liu-Chen LY. ASP147 in the third transmembrane helix of the rat mu opioid receptor forms ion-pairing with morphine and naltrexone. Life Sci. 1999;65:175–185. doi: 10.1016/s0024-3205(99)00234-9. [DOI] [PubMed] [Google Scholar]
- 6.Befort K, Tabbara L, Kling D, Maigret B, Kieffer BL. Role of aromatic transmembrane residues of the delta-opioid receptor in ligand recognition. J Biol Chem. 1996;271:10161–10168. doi: 10.1074/jbc.271.17.10161. [DOI] [PubMed] [Google Scholar]
- 7.Mansour A, Taylor LP, Fine JL, Thompson RC, Hoversten MT, Mosberg HI, Watson SJ, Akil H. Key residues defining the mu-opioid receptor binding pocket: a site-directed mutagenesis study. J Neurochem. 1997;68:344–353. doi: 10.1046/j.1471-4159.1997.68010344.x. [DOI] [PubMed] [Google Scholar]
- 8.Spivak CE, Beglan CL, Seidleck BK, Hirshbein LD, Blaschak CJ, Uhl GR, Surratt CK. Naloxone activation of mu-opioid receptors mutated at a histidine residue lining the opioid binding cavity. Mol Pharmacol. 1997;52:983–992. doi: 10.1124/mol.52.6.983. [DOI] [PubMed] [Google Scholar]
- 9.Bot G, Blake AD, Li S, Reisine T. Mutagenesis of a single amino acid in the rat mu-opioid receptor discriminates ligand binding. J Neurochem. 1998;70:358–365. doi: 10.1046/j.1471-4159.1998.70010358.x. [DOI] [PubMed] [Google Scholar]
- 10.Cherezov V, Rosenbaum DM, Hanson MA, Rasmussen SG, Thian FS, Kobilka TS, Choi HJ, Kuhn P, Weis WI, Kobilka BK, Stevens RC. High-resolution crystal structure of an engineered human beta2-adrenergic G protein-coupled receptor. Science. 2007;318:1258–1265. doi: 10.1126/science.1150577. [DOI] [PMC free article] [PubMed] [Google Scholar]
- 11.Wang C, Bradley P, Baker D. Protein-protein docking with backbone flexibility. J Mol Biol. 2007;373:503–519. doi: 10.1016/j.jmb.2007.07.050. [DOI] [PubMed] [Google Scholar]
- 12.Laio A, Parrinello M. Escaping free-energy minima. Proc Natl Acad Sci U S A. 2002;99:12562–12566. doi: 10.1073/pnas.202427399. [DOI] [PMC free article] [PubMed] [Google Scholar]
- 13.Barducci A, Bussi G, Parrinello M. Well-tempered metadynamics: a smoothly converging and tunable free-energy method. Phys Rev Lett. 2008;100:020603–020607. doi: 10.1103/PhysRevLett.100.020603. [DOI] [PubMed] [Google Scholar]
- 14.Bonomi M, Branduardi D, Gervasio FL, Parrinello M. The unfolded ensemble and folding mechanism of the C-terminal GB1 beta-hairpin. J Am Chem Soc. 2008;130:13938–13944. doi: 10.1021/ja803652f. [DOI] [PubMed] [Google Scholar]
- 15.Ballesteros J, Weinstein H. Integrated methods for the construction of three dimensional models and computational probing of structure function relations in G protein-coupled receptors. In: Sealfon SC, CP, editors. Methods in Neurosciences. Academic Press; San Diego, CA: 1995. pp. 366–428. [Google Scholar]
- 16.Sali A, Blundell TL. Comparative protein modelling by satisfaction of spatial restraints. J Mol Biol. 1993;234:779–815. doi: 10.1006/jmbi.1993.1626. [DOI] [PubMed] [Google Scholar]
- 17.Horn F, Bettler E, Oliveira L, Campagne F, Cohen FE, Vriend G. GPCRDB information system for G protein-coupled receptors. Nucleic Acids Res. 2003;31:294–297. doi: 10.1093/nar/gkg103. [DOI] [PMC free article] [PubMed] [Google Scholar]
- 18.Fiser A, Sali A. ModLoop: automated modeling of loops in protein structures. Bioinformatics. 2003;19:2500–2501. doi: 10.1093/bioinformatics/btg362. [DOI] [PubMed] [Google Scholar]
- 19.Fiser A, Do RK, Sali A. Modeling of loops in protein structures. Protein Sci. 2000;9:1753–1773. doi: 10.1110/ps.9.9.1753. [DOI] [PMC free article] [PubMed] [Google Scholar]
- 20.Xiang Z, Soto CS, Honig B. Evaluating conformational free energies: the colony energy and its application to the problem of loop prediction. Proc Natl Acad Sci U S A. 2002;99:7432–7437. doi: 10.1073/pnas.102179699. [DOI] [PMC free article] [PubMed] [Google Scholar]
- 21.Jacobson MP, Pincus DL, Rapp CS, Day TJ, Honig B, Shaw DE, Friesner RA. A hierarchical approach to all-atom protein loop prediction. Proteins. 2004;55:351–367. doi: 10.1002/prot.10613. [DOI] [PubMed] [Google Scholar]
- 22.Gioannini TL, Liu YF, Park YH, Hiller JM, Simon EJ. Evidence for the presence of disulfide bridges in opioid receptors essential for ligand binding. Possible role in receptor activation. J Mol Recognit. 1989;2:44–48. doi: 10.1002/jmr.300020107. [DOI] [PubMed] [Google Scholar]
- 23.Tieleman DP, MacCallum JL, Ash WL, Kandt C, Xu Z, Monticelli L. Membrane protein simulations with a united-atom lipid and all-atom protein model: lipid-protein interactions, side chain transfer free energies and model proteins. Journal of Physics: Condensed Matter. 2006;18:S1221–S1234. doi: 10.1088/0953-8984/18/28/S07. [DOI] [PubMed] [Google Scholar]
- 24.Van Der Spoel D, Lindahl E, Hess B, Groenhof G, Mark AE, Berendsen HJ. GROMACS: fast, flexible, and free. J Comput Chem. 2005;26:1701–1718. doi: 10.1002/jcc.20291. [DOI] [PubMed] [Google Scholar]
- 25.Jorgensen WL, Tirado-Rives J. The OPLS potential functions for proteins. Energy minimizations for crystals of cyclic peptides and crambin. Journal of the American Chemical Society. 1988;110:1657–1666. doi: 10.1021/ja00214a001. [DOI] [PubMed] [Google Scholar]
- 26.Chiu SW, Jakobsson E, Mashl RJ, Scott HL. Cholesterol-induced modifications in lipid bilayers: a simulation study. Biophys J. 2002;83:1842–1853. doi: 10.1016/S0006-3495(02)73949-0. [DOI] [PMC free article] [PubMed] [Google Scholar]
- 27.Baker NA, Sept D, Joseph S, Holst MJ, McCammon JA. Electrostatics of nanosystems: application to microtubules and the ribosome. Proc Natl Acad Sci U S A. 2001;98:10037–10041. doi: 10.1073/pnas.181342398. [DOI] [PMC free article] [PubMed] [Google Scholar]
- 28.Kandt C, Ash WL, Tieleman DP. Setting up and running molecular dynamics simulations of membrane proteins. Methods. 2007;41:475–488. doi: 10.1016/j.ymeth.2006.08.006. [DOI] [PubMed] [Google Scholar]
- 29.Berendsen HJC, Postma JPM, van Gunsteren WF, DiNola A, Haak JR. Molecular dynamics with coupling to an external bath. J Chem Phys. 1984;81:3684–3690. [Google Scholar]
- 30.Hess B, Bekker H, Berendsen HJC, Fraaije JGEM. LINCS: A linear constraint solver for molecular simulations. J Comput Chem. 1997;18:1463–1472. [Google Scholar]
- 31.Miyamoto S, Kollman PA. SETTLE: An Analytical Version of the SHAKE and RATTLE Algorithm for Rigid Water Models. Journal of Computational Chemistry. 1992;13:952–962. [Google Scholar]
- 32.Darden T, York D, Pedersen L. Particle mesh Ewald. (PME): a N log(N) method for Ewald sums in large systems. J Chem Phys. 1993;98:10089–10092. [Google Scholar]
- 33.Kluge MD, Ray JR, Rahman A. Amorphous-silicon formation by rapid quenching: A molecular-dynamics study. Physical Review B. 1987;36:4234–4237. doi: 10.1103/physrevb.36.4234. [DOI] [PubMed] [Google Scholar]
- 34.Nose S, Klein ML. Constant pressure molecular dynamics for molecular systems. Molecular physics(Print) 1983;50:1055–1076. [Google Scholar]
- 35.Raiteri P, Laio A, Gervasio FL, Micheletti C, Parrinello M. Efficient reconstruction of complex free energy landscapes by multiple walkers metadynamics. J Phys Chem B. 2006;110:3533–3539. doi: 10.1021/jp054359r. [DOI] [PubMed] [Google Scholar]
- 36.Allen TW, Andersen OS, Roux B. Energetics of ion conduction through the gramicidin channel. Proc Natl Acad Sci U S A. 2004;101:117–122. doi: 10.1073/pnas.2635314100. [DOI] [PMC free article] [PubMed] [Google Scholar]
- 37.Roux B. Statistical mechanical equilibrium theory of selective ion channels. Biophys J. 1999;77:139–153. doi: 10.1016/S0006-3495(99)76878-5. [DOI] [PMC free article] [PubMed] [Google Scholar]
- 38.Jónsson H, Mills G, Jacobsen KW. Nudged elastic band method for finding minimum energy paths of transitions. In: Berne BJ, GCaDFC, editors. Classical and Quantum Dynamics in Condensed Phase Simulations. World Scientific; Singapore: 1998. pp. 385–404. [Google Scholar]
- 39.Bonomi M, Branduardi D, Bussi G, Camilloni C, Provasi D, Raiteri P, Donadio D, Marinelli F, Pietrucci F, Broglia RA, Parrinello M. PLUMED: A portable plugin for free-energy calculations with molecular dynamics. Computer Physics Communications. 2009;180:1961–1972. [Google Scholar]
- 40.Xu W, Ozdener F, Li JG, Chen C, de Riel JK, Weinstein H, Liu-Chen LY. Functional role of the spatial proximity of Asp114(2.50) in TMH 2 and Asn332(7.49) in TMH 7 of the mu opioid receptor. FEBS Lett. 1999;447:318–324. doi: 10.1016/s0014-5793(99)00316-6. [DOI] [PubMed] [Google Scholar]
- 41.Li J, Huang P, Chen C, de Riel JK, Weinstein H, Liu-Chen LY. Constitutive activation of the mu opioid receptor by mutation of D3.49(164), but not D3.32(147): D3.49(164) is critical for stabilization of the inactive form of the receptor and for its expression. Biochemistry. 2001;40:12039–12050. doi: 10.1021/bi0100945. [DOI] [PubMed] [Google Scholar]
- 42.Huang P, Li J, Chen C, Visiers I, Weinstein H, Liu-Chen LY. Functional role of a conserved motif in TM6 of the rat mu opioid receptor: constitutively active and inactive receptors result from substitutions of Thr6.34(279) with Lys and Asp. Biochemistry. 2001;40:13501–13509. doi: 10.1021/bi010917q. [DOI] [PubMed] [Google Scholar]
- 43.Huang P, Visiers I, Weinstein H, Liu-Chen LY. The local environment at the cytoplasmic end of TM6 of the mu opioid receptor differs from those of rhodopsin and monoamine receptors: introduction of an ionic lock between the cytoplasmic ends of helices 3 and 6 by a L6.30(275)E mutation inactivates the mu opioid receptor and reduces the constitutive activity of its T6.34(279)K mutant. Biochemistry. 2002;41:11972–11980. doi: 10.1021/bi026067b. [DOI] [PubMed] [Google Scholar]
- 44.Xu W, Li J, Chen C, Huang P, Weinstein H, Javitch JA, Shi L, de Riel JK, Liu-Chen LY. Comparison of the amino acid residues in the sixth transmembrane domains accessible in the binding-site crevices of mu, delta, and kappa opioid receptors. Biochemistry. 2001;40:8018–8029. doi: 10.1021/bi002490d. [DOI] [PubMed] [Google Scholar]
- 45.Khelashvili G, Grossfield A, Feller SE, Pitman MC, Weinstein H. Structural and dynamic effects of cholesterol at preferred sites of interaction with rhodopsin identified from microsecond length molecular dynamics simulations. Proteins. 2008;76:403–417. doi: 10.1002/prot.22355. [DOI] [PMC free article] [PubMed] [Google Scholar]
- 46.Hanson MA, Cherezov V, Griffith MT, Roth CB, Jaakola VP, Chien EY, Velasquez J, Kuhn P, Stevens RC. A specific cholesterol binding site is established by the 2.8 A structure of the human beta2-adrenergic receptor. Structure. 2008;16:897–905. doi: 10.1016/j.str.2008.05.001. [DOI] [PMC free article] [PubMed] [Google Scholar]
- 47.Wang T, Duan Y. Ligand Entry and Exit Pathways in the beta(2)-Adrenergic Receptor. J Mol Biol. 2009;392:1102–1115. doi: 10.1016/j.jmb.2009.07.093. [DOI] [PMC free article] [PubMed] [Google Scholar]
- 48.Valiquette M, Vu HK, Yue SY, Wahlestedt C, Walker P. Involvement of Trp-284, Val-296, and Val-297 of the human delta-opioid receptor in binding of delta-selective ligands. J Biol Chem. 1996;271:18789–18796. doi: 10.1074/jbc.271.31.18789. [DOI] [PubMed] [Google Scholar]
- 49.Meng F, Wei Q, Hoversten MT, Taylor LP, Akil H. Switching agonist/antagonist properties of opiate alkaloids at the delta opioid receptor using mutations based on the structure of the orphanin FQ receptor. J Biol Chem. 2000;275:21939–21945. doi: 10.1074/jbc.M002864200. [DOI] [PubMed] [Google Scholar]
- 50.Schlechtingen G, DeHaven RN, Daubert JD, Cassel JA, Chung NN, Schiller PW, Taulane JP, Goodman M. Structure-activity relationships of dynorphin a analogues modified in the address sequence. J Med Chem. 2003;46:2104–2109. doi: 10.1021/jm020125+. [DOI] [PubMed] [Google Scholar]
- 51.Tryoen-Toth P, Decaillot FM, Filliol D, Befort K, Lazarus LH, Schiller PW, Schmidhammer H, Kieffer BL. Inverse agonism and neutral antagonism at wild-type and constitutively active mutant delta opioid receptors. J Pharmacol Exp Ther. 2005;313:410–421. doi: 10.1124/jpet.104.077321. [DOI] [PubMed] [Google Scholar]
- 52.Valenzano KJ, Miller W, Chen Z, Shan S, Crumley G, Victory SF, Davies E, Huang JC, Allie N, Nolan SJ, Rotshteyn Y, Kyle DJ, Brogle K. DiPOA ([8-(3,3-diphenyl-propyl)-4-oxo-1-phenyl-1,3,8-triazaspiro[4.5]dec-3-yl]-a cetic acid), a novel, systemically available, and peripherally restricted mu opioid agonist with antihyperalgesic activity: I. In vitro pharmacological characterization and pharmacokinetic properties. J Pharmacol Exp Ther. 2004;310:783–792. doi: 10.1124/jpet.103.063313. [DOI] [PubMed] [Google Scholar]
- 53.Toll L, Berzetei-Gurske IP, Polgar WE, Brandt SR, Adapa ID, Rodriguez L, Schwartz RW, Haggart D, O’Brien A, White A, Kennedy JM, Craymer K, Farrington L, Auh JS. Standard binding and functional assays related to medications development division testing for potential cocaine and opiate narcotic treatment medications. NIDA Res Monogr. 1998;178:440–466. [PubMed] [Google Scholar]
Associated Data
This section collects any data citations, data availability statements, or supplementary materials included in this article.