

Abstract
We examine 3D patterns of volume differences in the brain associated with blindness, in subjects grouped according to early and late onset. Using tensor-based morphometry, we map volume reductions and gains in 16 early-onset (EB) and 16 late-onset (LB) blind adults (onset <5 and >14 years old, respectively) relative to 16 matched sighted controls. Each subject’s structural MRI was fluidly registered to a common template. Anatomical differences between groups were mapped based on statistical analysis of the resulting deformation fields revealing profound deficits in primary and secondary visual cortices for both blind groups. Regions outside the occipital lobe showed significant hypertrophy, suggesting widespread compensatory adaptations. EBs but not LBs showed deficits in the splenium and hypertrophy in the isthmus. Gains in the isthmus and non-occipital white matter were more widespread in the EBs. These differences may reflect regional alterations in late neurodevelopmental processes, such as myelination, that continue into adulthood.
Keywords: Blindness, brain imaging, corpus callosum, MRI, plasticity, tensor-based morphometry
The central nervous system is remarkably adaptive to changes in sensory input. Cortical plasticity following visual deprivation was first observed in kittens (Wiesel and Hubel, 1965a, 1965b)) and extensive reorganizations of cortical representational maps have been observed in humans after limb amputation (Flor et al., 1995). This is manifested also in cases of increased sensory use in normal subjects such as musicians, who exhibit increased auditory cortical representations (Pantev et al., 1998), and in professional string players, the cortical representation of the fingers of the left hand is greatly increased (Elbert et al., 1995). Such findings illustrate how the brain may re-organize functionally, to adapt to changes in sensory demands.
Blindness provides a rare model of crossmodal neuroplasticity. Cortical structures normally specialized for visual processing may be used by blind individuals for auditory and tactile purposes (see Theoret et al., 2004, for a review). Extensive neuroanatomical differences – even outside the occipital cortex – have been observed in those blind from an early age (early-onset blind or EB individuals). Elbert and colleagues (2002) found that the area of the tonotopic region of the auditory cortex is almost twice the size of its counterpart in sighted individuals. Hippocampal volumes are abnormally enlarged in both EB and LB (late-onset blind) individuals, perhaps offering an anatomical substrate for their enhanced navigational skills (Fortin et al., 2007). White matter connectivity between primary somatosensory and visual areas is also increased in EB individuals; Wittenberg et al. (2004) applied repetitive transcranial magnetic simulation (rTMS) over the primary somatosensory cortex and observed significant occipital cortex activity using positron emission tomography. This effect was noted only in EB, but not in sighted or LB individuals. Using voxel-based morphometry to measure anatomical integrity more directly, Noppeney and colleagues (2005) found that EB individuals had decreased white matter volume in the optic radiation and sensorimotor system, and reduced gray and white matter volume in primary visual areas. The optic radiation showed no detectable deficit in a small group of LB individuals assessed with diffusion tensor imaging (Schoth et al., 2006). Using diffusion tensor tractography (DTT), Shimony et al. (2006) found atrophied geniculocalcarine tracts in the EB, while connections between visual cortex and the orbital frontal and temporal cortices were relatively preserved. Yu et al. (2007) also observed increased fractional anisotropy of the corticospinal tract in early-blind men using DTT, perhaps reflecting increased myelination.
Here we examined whole-brain volumetric changes in both EB and LB compared to sighted individuals using tensor-based morphometry (TBM) with fast fluid registration. We aimed to create a 3D map of the level of voxel-wise volumetric gains and losses in EB and LB subjects. The purpose of the current study was two-fold. First, to explore, in blind individuals, new cerebral regions that have not specifically been examined in previous studies, as well as to confirm differences found by previous studies using other methods. And secondly, to offer a straightforward comparison between EB and LB individuals, which is often lacking in studies of cross-modal plasticity. We hypothesized that there would be deficits in primary visual cortices and the occipital lobes generally, but we predicted hypertrophy in extra-occipital brain regions, and in the corresponding callosal sectors carrying interhemispheric fibers, due to compensation from other senses. We also hypothesized that the pattern of gains and losses might be accentuated in the early-blind, as plasticity is expected to be greater while the occipital lobes are still rapidly developing, shedding light on the time-courses and possible substrates of the changes (e.g., late myelination).
4. METHODS
4.1. Data Acquisition
Subjects with no history of neurological, cognitive or sensorimotor deficits, other than blindness, participated in the study and were divided into two groups. The first group consisted of 16 early-onset blind individuals (with loss of vision before 5 years of age), aged between 19 and 55 years (mean age 36.2 ± 9.8 years; median age 36.0 years; 10 men, 6 women). The second group consisted of 16 late-onset blind subjects (i.e., with loss of vision after 14 years of age) aged between 22 and 56 years (mean age 38.2 ± 10.2 years; median age 36.5 years; 10 men, 6 women). Each of these groups was compared with healthy groups of 16 age- and gender-matched controls (controls for the EB group: 35.3 ± 9.5 years; min age: 22; max age: 44; 10 males, 6 females; controls for the LB group: 38.2 ± 10.3 years; min age: 22; max age: 57; 10 males, 6 females). In all cases, blindness was attributable to bilateral peripheral damage (including: lenticular fibroplasia, retinoblastoma, tumors restricted to the eyes, retinal detachment, Leber’s congenital amaurosis, Retinis pigmentosa, accidents affecting the eyes and glaucoma) and led to either total blindness, or at most light perception in 5 of the EBs and 6 of the LBs. For brevity, we refer to early-onset and late-onset blind subjects as early blind and late blind (EB or LB), for the rest of the paper.
The research protocol was approved by the ethics committees of the Center for Interdisciplinary Research in Rehabilitation, which coordinates research with blind subjects in the Province of Quebec. MRI scans were collected at the Centre Hospitalier de l’Université de Montreal (CHUM). All subjects provided written informed consent prior to testing.
For each participant, high-resolution volumetric MRI scans of the brain were acquired on a Siemens 1.5 Tesla Magnetom Vision MRI scanner (Siemens Electric, Erlangen, Germany). The scanning protocol was identical for all participants. Each subject was scanned with a volumetric high-resolution (T1-weighted 3D, 1mm3 resolution, 256 slices) sagittally-oriented MRI gradient echo sequence with repetition time (TR): 1100 ms; echo time (TE): 4.38 ms; flip angle, 15 degrees; 256 × 256 matrix, and field of view (FOV): 250 mm.
4.2 Preprocessing of Data
Extracerebral tissues (scalp, meninges and brainstem) were removed from the scans using the BSE software program (Brain Surface Extractor; Shattuck and Leahy, 2002); images were manually edited to make additional corrections. Images were aligned and scaled to the ICBM-53 brain template (International Consortium for Brain Mapping) with the ANIMAL software program (Collins et al., 1994), using a 9-parameter linear transformation (3 translations, 3 rotations and 3 scales). In the midsagittal plane, each subject’s corpus callosum (cc) was manually traced using the MultiTracer program (Woods, 2003) following anatomical criteria with established reliability (Thompson et al., 1998). Voxels were then classified into gray matter, white matter and cerebrospinal fluid using the software BrainSuite (Shattuck and Leahy, 2002).
4.3 Tensor-Based Morphometry (TBM)
Each 3D whole brain image (including gray and white matter, and CSF) was then nonlinearly aligned to an anatomical template, based on an arbitrarily selected control subject in the standard ICBM space, using a fully 3D fluid registration algorithm to reconfigure the anatomy into the shape of the target brain (Christensen et al., 1996, Leporé et al., 2008a). The image template was treated as being embedded in a viscous fluid that follows a linearized version of the Navier-Stokes equation (Christensen et al., 1996):
The force term F that drives the images into agreement is the gradient of the summed squared difference in intensities between the template and the target image, and v is the velocity of the fluid particles. The parameters μ and λ are manually set by the user, but have been shown to give similar results for a wide range of values (Leporé et al., 2008a).
In practice, solving this equation is very time consuming. Thus we use a filter based on the Green’s function of the governing operator of the fluid equation that was proposed by Bro-Nielsen and Gramkow (1996), and Gramkow (1996) to speed up the registration.
We chose registration to a single subject’s image here rather than an average atlas template constructed from multiple subjects, as it has sharper, more well resolved features, which can be beneficial for registration (Chiang et al., 2006, Leporé et al., 2007). The control subject was selected randomly, but was visually checked to ensure that the image did not have any very strongly distinguishing features (e.g., enlarged ventricles, etc.). In previous work (Leporé et al., 2008c), we showed that results do not depend strongly on the choice of the control subject.
In the deformation mappings transforming each subject’s registered image onto the control template, the determinant of the local Jacobian matrix, or “expansion factor”, at each point in the image, indicates local volume differences between each subject and the target image. Voxels with J>1 and J<1 indicate that the subject has respectively greater or lesser anatomical volumes than corresponding regions of the template.
To adjust for age and gender effects, we first covaried the logarithms of the determinants at each voxel with these variables. The new adjusted statistic, Jcov was computed by fitting the following general linear model to the data at each image voxel:
where Log(J) is the logarithm of the Jacobian determinant, and the βi are estimated regression coefficients at that specific voxel. Sex and diagnosis were coded as binary dummy variables (that is, sex=0 (males) or 1 (females) and diagnosis = 0 (sighted) and 1 (blind)), so that Jcov = β3 * diagnosis + error = Log(J) − β0 − β1 * age − β2 * sex. While we did not expect an age*diagnosis interaction, we still decided to verify that this had no detectable influence. Computations were performed on the logarithm of the Jacobian determinants as these are expected to be closer to a normal distribution than the J’s (Leow et al., 2007). A Student’s t-test was then performed on Jcov, at each voxel, and permutation statistics (Nichols and Holmes, 2001) were obtained at each voxel to assess the significance of the differences in each blind subject group versus controls. The labels of the subjects were randomly permuted and a t-test was performed at each voxel. The procedure was repeated 5000 times, and the t-value from the real data was compared to the permutation distribution to assess the significance of the data. Permutation testing was used to avoid assuming a parametric distribution for the log-transformed Jacobian statistics, which we have shown to be advantageous (Leow et al., 2007). We also computed the permutation (corrected) p-values from 1-tailed t-tests (assessing volume reduction) for each of the lobes in the scaled data.
A 2D version of the fluid registration algorithm was used to register the segmented and binarized corpus callosum images to the corpus callosum of the same control subject. The same analysis was then repeated in order to examine local area differences in those structures.
2. RESULTS
2.1 Early-Onset Blindness: 3D Maps
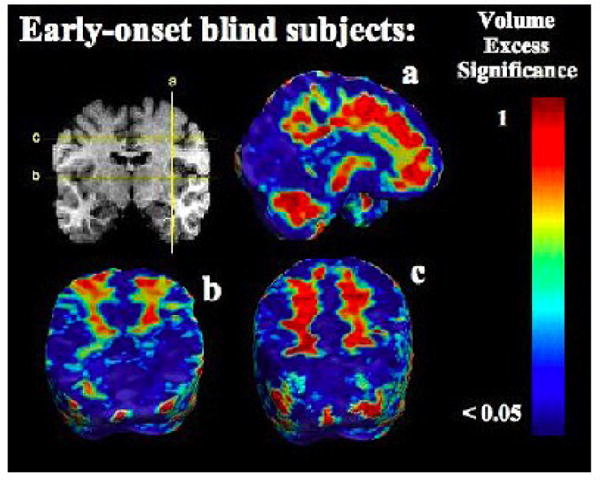
Early blind subjects showed significant volume deficits in dorsal visual cortices, spanning both primary (BA 17) and secondary visual areas (BA 18, BA 19; Figures 1, 2). Volumes were lower in occipital regions in both hemispheres, with more widespread deficits in the left hemisphere (asymmetry was not significant). Occipital regions showed large volume reductions, but differences were also detected elsewhere. Most notably, the cingulate region showed significant volume decreases, in both anterior and posterior regions (BA 24, BA 25, BA 31). In the frontal lobes, the left supplementary motor area (SMA, medial BA 6) and the premotor area (PMA, lateral BA 6) were also decreased. However, subcortical prefrontal (below the previously mentioned areas) and frontal white matter were larger in the blind subjects. Furthermore, in the parietal lobes, significant reductions were seen in the superior parietal lobule (BA 7), while the parietal subcortical white matter was increased. Volume excesses were also seen in the volume of the cerebellum.
FIGURE 1.
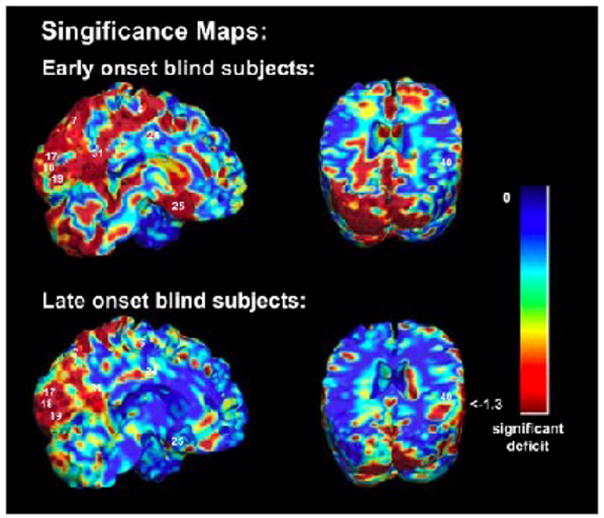
Structural differences and Brodmann areas. Occipital brain regions show highly significant structural differences associated with blindness for the EB (top) and LB (bottom) groups, after adjusting for individual differences in brain scale. Numbers on the map represent approximate Brodmann areas. The color bar shows the local significance of the group differences.
FIGURE 2.

Ratio of the mean volume in the EBs relative to that of the sighted controls at each voxel. The color bar displays the percentage difference in average volume between groups.
To assess whether these results were influenced by total brain volume, we re-analyzed the data after removing the global scaling factor from each of the images by dividing each image by the determinant of the scaling factors from the 9-parameter registration (Figure 3 and 4). All the significant differences were still present in the unscaled images.
FIGURE 3.
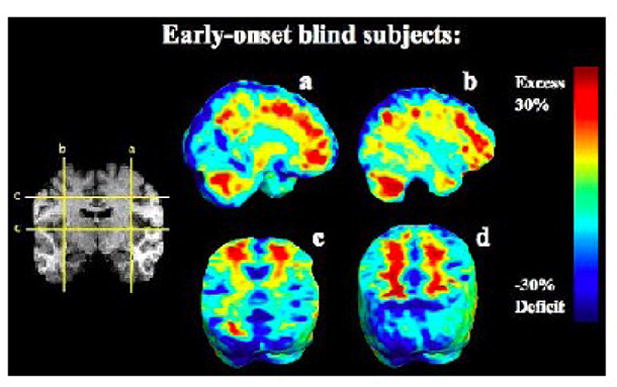
Maps of Volume Differences without Adjustment for Overall Brain Scale (Unscaled). The maps show the ratio of the mean volume in the EBs relative to that of the sighted controls at each voxel for the unscaled data. The color bar displays the difference in average volume, between groups, as a percentage of the mean volume in controls. The EB group shows prominent and widespread hypertrophy of the white matter (red colors) in regions outside the occipital lobes.
FIGURE 4.
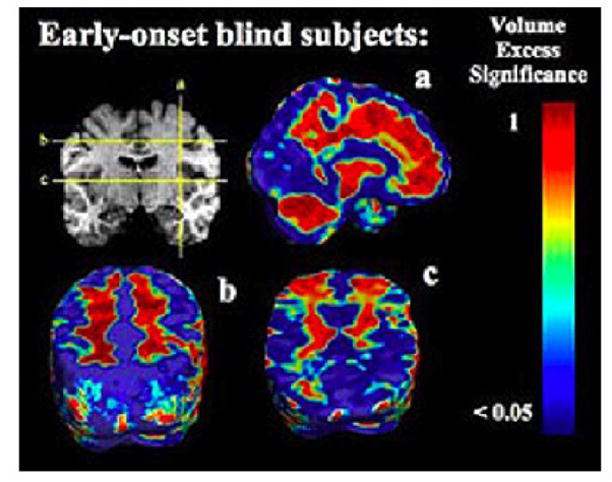
P-values for unscaled EBs versus controls. This figure shows the significance of volume differences between EB versus sighted subjects for the unscaled data (i.e., in data not adjusted for inter-individual differences in overall brain scale). Top panel: p-values for volume excess in EB compared to controls. Bottom panel: p-values for volume deficits in EB versus controls. The p-values are shown on a log10 scale, with dark red values showing significance at the level of 0.05. The corrected p-value for the whole brain was found to be p=0.03 from permutation tests, showing that observed pattern is significant overall.
From the 1-tailed t-tests, we found that volume reductions were significant in the occipital lobes for both the EB and LB (p=0.016 and p=0.049, respectively), but not significant in other lobes (frontal EB: p=0.59, frontal LB: p=0.97, limbic EB: p=0.98, limbic LB: p=0.96, parietal EB: p=0.23, parietal LB: p=0.93, temporal EB: p=0.94, temporal LB: p=0.08). Both gray matter and white matter were included. Differences in the occipital lobes were hypothesized a priori and were therefore not subjected to a Bonferroni correction. A Bonferroni correction was however applied to the 4 other lobes tested (i.e., p-values for the other lobes were considered to be significant only if they were smaller than p = 0.05/4; (4 lobes). None of the 1-tailed t-tests for volume increases were significant: occipital EB: p=0.28, occipital LB: p= 28, frontal EB: p=0.22, frontal LB: p=0.079, limbic EB: p=0.48, limbic LB: p=0.68, parietal EB: p=0.25, parietal LB: p=0.32, temporal EB: p=0.16, temporal LB: p=0.078).
2.2 Late-Onset Blindness: 3D Maps
Significant but less widespread differences were found in the LB, as expected. Greatest volumetric differences were found in the visual cortices (see Figures 1, 5 and 6). These differences were mainly restricted to regions that approximately corresponded to BA 17 and 18 bilaterally, but more so in the right hemisphere, and were located less dorsally than for the EB. In the parietal lobes, BA 7 and the right BA 40 showed significant decreases in volume in the late blind. The overall corrected p-value over the whole brain for the unscaled case was p=0.034 from a permutation test. The changes failed to reach significance when a multiple comparison test was performed over the whole brain for the scaled data (p=0.11, from a permutation test). The results are significant for the unscaled data, and a trend is seen in the scaled data. Thus, the differences seen here in the LBs are not as robust as those for the EBs, and are in part due to a global difference in brain scale rather than regional differences. This is to be expected, as brain plasticity should not be as extensive in those who became blind at a later age.
FIGURE 5.
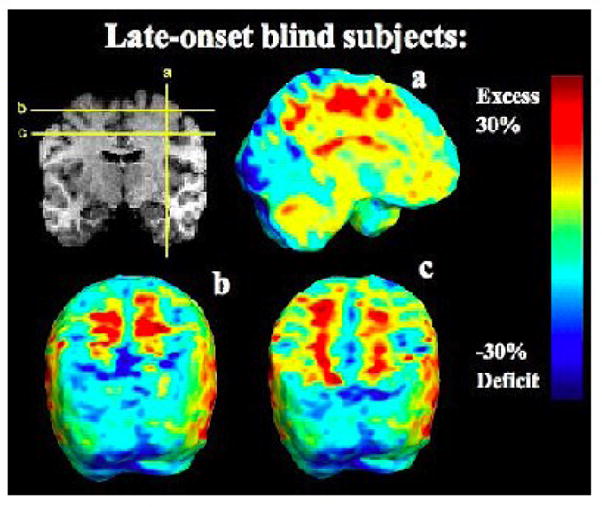
Volumetric excesses in the non-occipital white matter. These maps show the ratio of the mean volume in the LBs relative to that of the sighted controls at each voxel. The color bar displays the percentage difference in average volume between groups.
FIGURE 6.
Significance of Volumetric Excesses and Deficits in the unscaled Late Blind Group. Top panel: p-values for volume excess in LB compared to controls. Bottom panel: p-values for volume deficits in LB versus controls. The p-values are shown on a log10 scale, with dark red values showing significance at the level of 0.05. The corrected p-value for the whole brain was found to be p=0.034 from permutation tests, confirming that there is evidence for a volume difference.
We also performed a voxelwise t-test comparing the EB group to the LBs, using the same statistical method as described above for the comparison between the blind and control groups. However, the differences between the two blind groups were not statistically significant.
2.3 Corpus Callosum Maps
Relative volume maps for the EB and LB corpus callosum and the associated p-values are shown in Figure 7. Regional area reductions were found in the isthmus and splenium of the EB group, but not in the LB group. Using DTI tractography, Hofer and Frahm (2006) and Zarei et al. (2006) demonstrated in vivo that the inferior part of the splenium carries fibers that connect visuo-spatial areas of the brain. The isthmus is also involved in visuo-spatial processing, as it contains fibers connecting the posterior parietal areas, which fuse multimodality sensory information.
FIGURE 7.
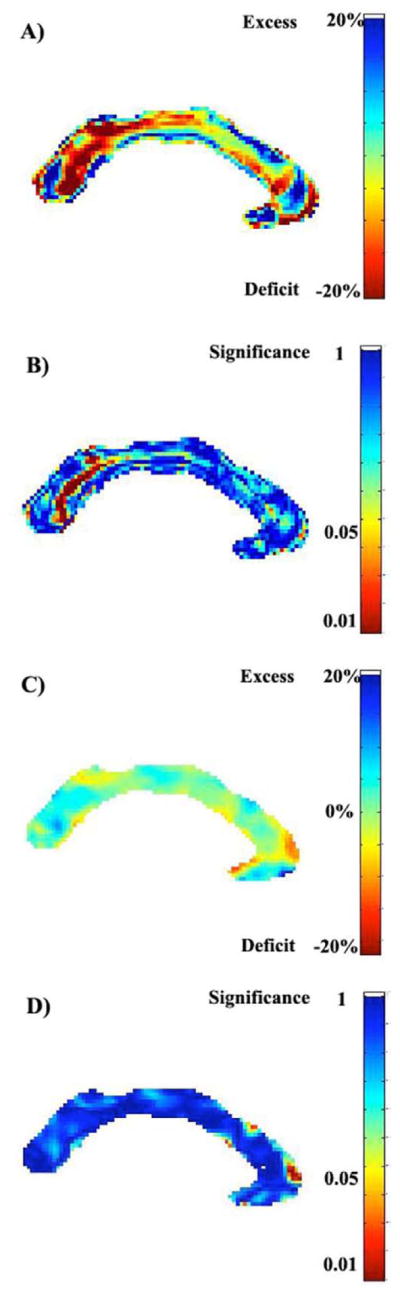
Percent reductions and excesses in cross-sectional area, and their significance, for the corpus callosum in (A,B) the EB, and (C,D) the LB groups. Subjects with early-onset blindness show mean deficits (in cross-sectional area) of up to 20 percent, relative to controls, in the isthmus and splenium (A). Regional differences in the late-onset blind subjects, however, are not significant (D) after multiple comparison correction: the global p-value, corrected, for the EB group difference is p=0.027, while that for the LB is p=0.215 (not significant).
In the EB, we detect increases in volume in a small section of the splenium of the cc, but overall the splenium and the isthmus are both decreased. The corpus callosum is the major pathway connecting the left and right visual regions of the occipital cortex. It undergoes extensive myelinization during development (Yakovlev and Lecours, 1967) until adolescence, and waves of peak growth rates can be observed in the cc’s of children of different ages (Thompson et al., 2000; Chung et al., 2001; Hua et al., 2008). The lack of vision probably results in a reduced activation in the neurons of the corpus callosum in these regions. The fibers of the cc contain the axons of cortical pyramidal cells (Innocenti and Frost, 1980), which undergo impaired development because the cells in the visual cortex are not as active in blind subjects.
A volume excess was also detected in the genu of the cc, though the results failed to reach significance. The genu connects the left and right prefrontal areas (Zarei et al., 2006), a region that we found to be increased in volume in our 3D whole brain results.
3. DISCUSSION
Here we examined the 3D pattern of voxelwise volume differences in the brain associated with blindness, in groups of subjects stratified according to early and late onset. Widespread differences were found not only in brain regions closely associated with vision, but significant hypertrophy was detected in non-occipital areas.
3.1 Corpus callosum
In the corpus callosum, only the EB differed significantly from controls, with focal reductions in the splenium and the isthmus Our results are consistent with a recent DTI tractography study (Yu et al., 2007), which found fractional anisotropy was significantly reduced in the splenium of EB subjects. The splenium is primarily composed of fibers connecting the visuo-spatial areas of the brain. The differences seen here may be due to reduced myelination of these fibers in the absence of visual input. When onset of blindness occurs in adolescence - or later, as is the case for the late blind subjects - the process of myelination is relatively complete, so that the structure of the corpus callosum may not be strongly influenced by the loss of visual perception, at least at a gross anatomic level.
3.2 Whole brain
In the 3D maps, extensive differences were found in both blind groups in the occipital lobes, as expected, as well as in several non-occipital regions (left SMA, PMC, sub parietal lobule, cingulate). These differences reached significance only in the occiptal lobes of the EB group when multiple comparisons corrections were applied to adjust for the many statistical tests performed over the brain. Widespread hypertrophy was also observed in non-occipital WM, particularly in the prefrontal and frontal areas, and in the cerebellum, though these results failed to reach significance when corrected for multiple comparisons.
The greater deficits in EB may reflect a reduction in myelination, which may depend on the age of onset – in the early blind, occipital neurons receive less sensory input than in sighted subjects. This is supported by the fact that the splenium of the corpus callosum, a subregion carrying fibers interconnect the visual cortices, and which is heavily myelinated by age 14, is reduced in size in our blind subjects. A more direct technique to assess white matter microstructure is to use diffusion tensor imaging to show that diffusion-sensitive measures of fiber integrity are altered in the axons connecting the two visual cortices. In Lee et al. (2009), we performed a TBM-like analysis on diffusion tensor data from a dataset of 12 blind adult subjects and 14 matched controls, and showed that this was indeed the case. Among the potential consequences, there may be reduced synaptogenesis, as there is a reduced need for functional relationships between neurons in those regions.
Many studies have found that the visual cortices are recruited for other sensory modalities (see e.g., Theoret et al., 2004), hence once might wonder whether the visual cortices should be reduced in size as they are still used. As vision is the most important sense in humans, it is to be expected that occipital areas will be affected by the lack of input of visual information. However, even though these areas are reduced in size, what is left of them can still contribute to the processing of other types of sensory information, perhaps explaining the enhanced performance of blind subjects in reading other sensory inputs.
While the reductions in the occipital regions were expected a priori, our results show decreases in several non-occipital areas, which perform higher order visual processing and integrate visual information with information from other sensory and motor systems. For instance, the SMA integrates visual and motor information. In the parietal lobes, the right supramarginal gyrus (BA 40) is involved in 3D processing of visual orientation (Faillenot et al., 1997). Furthermore, a volume reduction in superior parietal cortex (BA 7), which is involved in spatial attention (Shafritz et al., 2002), may be due to the absence of the need to calibrate and coordinate primary visual and motor functions in the blind.
We found widespread hypertrophy in non-occipital WM throughout the brain, particularly in the prefrontal and frontal regions. These results are in line with those found when comparing deaf subjects to hearing ones with TBM (Leporé et al., 2009). As the frontal lobes control executive function, increases in those areas may be related to a reorganization of those functions that now need to be generated using information from one less sense. The Supplementary Motor Area (medial BA 6) and the premotor cortex (lateral BA 6) are both thought to play a role in the planning of complex, coordinated movements (Rizzolatti and Luppino, 2001).
The maps also show some significant volume increases in the cerebellum, which coordinates sensory-motor interactions. Changes might occur in the cerebellum to compensate for the lack of visual information, as the blind subjects have good motor performance, and their other sensory modalities are intact. In a related TBM study, we found that the cerebellar volume of deaf people was significantly increased compared to normal hearing subjects (Leporé et al., 2009).
3.3 Relationship to other modalities
Functional studies have shown that blind individuals’ occipital cortices may also be recruited to perform higher-order functions elicited by memory (Amedi et al., 2003, Bliss et al., 2004, Roder et al., 2003b, Raz et al., 2005) and language tasks (Amedi et al., 2004, Burton et al., 2002, Noppeney et al., 2003, Roder et al., 2003a). Some have suggested that activation of visual cortices by non-visual tasks does not necessarily mean that these regions are functionally engaged by the task, but more recent findings suggest otherwise. Visual cortex activity is correlated with behavioral performance under numerous task conditions: processing of auditory stimuli (Gougoux et al., 2005), verbal memory (Amedi et al., 2003), episodic retrieval (Raz et al., 2005) and during semantic/syntactic processing (Roder et al., 2003a). Virtual lesions of the occipital cortex induced by repetitive transcranial magnetic stimulation (rTMS) result in increased error rates for verbal memory tasks (Amedi et al., 2004), Braille identification (Cohen et al., 1997), and sound localization (Collignon et al., 2007).
3.4 Future work
In this study, we focused solely on neuroanatomical volume differences between blind and sighted individuals. However, in (Leporé et al., 2008b), a method was developed to simultaneously study voxelwise shape and volume changes. While we chose to focus here on the volume changes only, as these already showed substantial differences between groups, future work could include applying these methods to understand further morphometric differences between blind and sighted individuals. The method in Leporé et al., (2008b) uses both shape and volume information and may improve the results described here. A TBM analysis that only considers differences in volume is known to perform well on smaller samples analogous to the sample studied here, whereas the type of TBM analysis that considers both local volume and shape (multivariate TBM; Leporé et al., 2008b) is better suited for larger samples, as it computes multivariate statistics on 6 variables per voxel (requiring the estimation of more free parameters). Furthermore, studies with animal models would also be informative, to understand the extent of myelination and dendritic arborization in the regions with volumetric deficits.
Acknowledgments
This study was supported by grants from the Canadian Institutes of Health Research and by the Canada Research Chairs awarded to Franco Leporé and Maryse Lassonde. Madeleine Fortin was funded by the Fond de la Recherche en Santé du Québec and the Réseau de recherche en santé de la vision and Patrice Voss by the Natural Sciences and Engineering Research Council of Canada. Additional support for algorithm development was provided by the National Institute on Aging, the National Library of Medicine, the National Institute for Biomedical Imaging and Bioengineering, the National Center for Research Resources, and the National Institute for Child Health and Development (AG016570, LM05639, EB01651, RR019771 and HD050735 to P.M.T.) and by the National Institute of Health Grant (U54 RR021813, UCLA Center for Computational Biology).
Footnotes
Publisher's Disclaimer: This is a PDF file of an unedited manuscript that has been accepted for publication. As a service to our customers we are providing this early version of the manuscript. The manuscript will undergo copyediting, typesetting, and review of the resulting proof before it is published in its final citable form. Please note that during the production process errors may be discovered which could affect the content, and all legal disclaimers that apply to the journal pertain.
BIBLIOGRAPHY
- 1.Amedi A, Raz N, Pianka P, Malach R, Zohary E. Early ‘visual’ cortex activation correlates with superior verbal memory in the blind. Nat Neurosci. 2003;6:758–766. doi: 10.1038/nn1072. [DOI] [PubMed] [Google Scholar]
- 2.Amedi A, Floel A, Knecht S, Zohary E, Cohen LG. Transcranial magnetic stimulation of the occipital pole interferes with verbal processing in blind subjects. Nat Neurosci. 2004;7:1266–1270. doi: 10.1038/nn1328. [DOI] [PubMed] [Google Scholar]
- 3.Bliss I, Kujala T, Hamalainen H. Comparison of blind and sighted participants performance in a letter recognition working memory task. Brain Res Cogn Brain Res. 2004;18:273–277. doi: 10.1016/j.cogbrainres.2003.10.012. [DOI] [PubMed] [Google Scholar]
- 4.Bro-Nielsen M, Gramkow C. Fast fluid registration of medical images. Proceedings of the 4th International Conference on Visualization in Biomedical Computing; Hamburg, Germany. September 22–25; 1996. pp. 267–276. [Google Scholar]
- 5.Burton H, Snyder AZ, Diamond J, Raichle ME. Adaptive changes in early and late blind: a fMRI study of verb generation to heard nouns. J Neurophysiol. 2002;88:3359–3371. doi: 10.1152/jn.00129.2002. [DOI] [PMC free article] [PubMed] [Google Scholar]
- 6.Chiang MC, Dutton RA, Hayashi KM, Lopez OL, Aizenstein HJ, Toga AW, Becker JT, Thompson PM. 3D pattern of brain atrophy in HIV/AIDS visualized using tensor-based morphometry. NeuroImage. 2007;34:44–60. doi: 10.1016/j.neuroimage.2006.08.030. [DOI] [PMC free article] [PubMed] [Google Scholar]
- 7.Christensen EG, Rabbitt RD, Miller MI. Deformable templates using large deformation kinematics. IEEE Trans Image Process. 1996;5:1435–1447. doi: 10.1109/83.536892. [DOI] [PubMed] [Google Scholar]
- 8.Chung MK, Worsley KJ, Paus T, Cherif C, Collins DL, Giedd JN, Rapoport JL, Evans AC. A unified statistical approach to deformation-based morphometry. Neuroimage. 2001;14:595–606. doi: 10.1006/nimg.2001.0862. [DOI] [PubMed] [Google Scholar]
- 9.Cohen LG, Celnick P, Pascual-Leone A, Corwell B, Faiz L, Dambrosia J, Honda M, Sadato N, Gerloff C, Catala MD, Hallett M. Functional relevance of cross-modal plasticity in blind humans. Nature. 1997;389:180–183. doi: 10.1038/38278. [DOI] [PubMed] [Google Scholar]
- 10.Collignon O, Lassonde M, Lepore F, Bastien D, Veraart C. Functional cerebral reorganization for auditory spatial processing and auditory substitution of vision in early blind subjects. Cereb Cortex. 2007 doi: 10.1093/cercor/bhj162. [DOI] [PubMed] [Google Scholar]
- 11.Collins DL, Neelin P, Peters TM, Evans AC. Automatic 3D intersubject registration of MR volumetric data in standardized Talairach space. J Comp Assist Tomogr. 1994;18:192–205. [PubMed] [Google Scholar]
- 12.Elbert T, Pantev C, Wienbruch C, Rockstroh B, Taub E. Increased cortical representation of the fingers of the left hand in string players. Science. 1995;270:205–207. doi: 10.1126/science.270.5234.305. [DOI] [PubMed] [Google Scholar]
- 13.Elbert T, Sterr A, Rockstroh B, Pantev C, Müller MM, Taub E. Expansion of the tonotopic area in the auditory cortex of the blind. J Neurosci. 2002;22:3439–3445. doi: 10.1523/JNEUROSCI.22-22-09941.2002. [DOI] [PMC free article] [PubMed] [Google Scholar]
- 14.Faillenot I, Sakata H, Costes N, Decety J, Jeannerod M. Visual working memory for shape and 3D-orientation: a PET study. Neuroreport. 1997;8:859–862. doi: 10.1097/00001756-199703030-00010. [DOI] [PubMed] [Google Scholar]
- 15.Flor H, Elbert T, Knecht S, Wienbruch C, Pantev C, Birbaumer N, Larbig W, Taub E. Phantom-limb pain as a perceptual correlate of cortical reorganization following arm amputation. Nature. 1995;375:482–484. doi: 10.1038/375482a0. [DOI] [PubMed] [Google Scholar]
- 16.Fortin M, Voss P, Lord C, Lassonde M, Pruessner J, Saint-Amour D, Lepore F. Wayfinding in the blind: larger hippocampal volume and supranormal spatial navigation. Brain. 2008 doi: 10.1093/brain/awn250. submitted. [DOI] [PubMed] [Google Scholar]
- 17.Gougoux F, Zatorre RJ, Lassonde M, Voss P, Lepore F. A functional neuroimaging study of sound localization: visual cortex activity predicts performance in early-blind individuals. PLOS Biology. 2005;3:324–333. doi: 10.1371/journal.pbio.0030027. [DOI] [PMC free article] [PubMed] [Google Scholar]
- 18.Gramkow C. Master’ thesis. Danish Technical University; Copenhagen, Denmark: 1996. Registration of 2D and 3D medical images. [Google Scholar]
- 19.Hofer S, Frahm J. Topography of the human corpus callosum revisited-Comprehensive fiber tractography using diffusion tensor magnetic resonance imaging. NeuroImage. 2006;32:989–994. doi: 10.1016/j.neuroimage.2006.05.044. [DOI] [PubMed] [Google Scholar]
- 20.Hua X, Leow AD, Levitt JG, Caplan R, Thompson PM, Toga AW. Detecting Brain Growth Patterns in Normal Children using Tensor-Based Morphometry. Hum Brain Mapp. 2009;30:209–219. doi: 10.1002/hbm.20498. [DOI] [PMC free article] [PubMed] [Google Scholar]
- 21.Innocenti GM, Frost DO. The postnatal development of visual callosal connections in the absence of visual experience or of the eyes. Exp Brain Res. 1980;39:365–375. doi: 10.1007/BF00239301. [DOI] [PubMed] [Google Scholar]
- 22.Lee AD, Leporé N, Lepore F, Voss P, Alary F, Chou Y-Y, Brun C, Barysheva M, Toga AW, Thompson PM. Fiber Architecture Differences in the Blind Visualized using Diffusion Tensor Imaging. Submitted to Cerebral Cortex 2009 [Google Scholar]
- 23.Leow AD, Chiang MC, Yanovsky I, Lee AD, Lu A, Klunder AD, Becker JT, Davis SW, Toga AW, Thompson PM. Statistical properties of Jacobian maps and inverse-consistent deformations in non-linear image registration. IEEE Trans Med Imaging. 2007;27:822 – 832. doi: 10.1109/TMI.2007.892646. [DOI] [PubMed] [Google Scholar]
- 24.Leporé N, Brun C, Pennec X, Chou Y-Y, Lopez OL, Aizeinstein HJ, Becker JT, Toga AW, Thompson PM. Mean Template for Tensor-Based Morphometry using Deformation Tensors. Proceedings, 10th International Conference on Medical Image Computing and Computer Assisted Intervention (MICCAI); Brisbane, Australia. Oct 29 – Nov 2; 2007. [DOI] [PubMed] [Google Scholar]
- 25.Leporé N, Chou Y-Y, Lopez OL, Aizeinstein HJ, Becker JT, Toga AW, Thompson PM. Fast 3D Fluid Registration of Brain Magnetic Resonance Images. Proceedings, SPIE conference on Physiology, Function and Structure from Medical Images; San Diego, CA. February 16 – 21; 2008a. [DOI] [PMC free article] [PubMed] [Google Scholar]
- 26.Leporé N, Brun C, Chou Y-Y, Chiang MC, Dutton RA, Hayachi KM, Luders E, Lopez OL, Aizenstein HJ, Toga AW, Becker JT, Thompson PM. Generalized Tensor-Based Morphometry of HIV/AIDS using multivariate statistics on deformation tensors. IEEE Trans Med Imaging. 2008b;27:129 – 141. doi: 10.1109/TMI.2007.906091. [DOI] [PMC free article] [PubMed] [Google Scholar]
- 27.Leporé N, Brun C, Chou Y-Y, Lee AD, Barysheva M, Pennec X, McMahon K, Meredith M, de Zubicaray GI, Wright M, Toga AW, Thompson PM. Best Individual Template Selection from Deformation Tensor Minimization. Proceedings, International Workshop on Biomedical Imaging (ISBI); Paris, France. April 14–17; 2008c. [DOI] [PMC free article] [PubMed] [Google Scholar]
- 28.Leporé N, Vachon P, Chou YY, Lepore F, Voss P, Brun C, Lee AD, Lassonde M, Toga AW, Thompson PM. Mapping of Brain Differences in Native Signing Congenitally and Prelingually Deaf Subjects, submitted to Hum. Brain Mapp. 2009 doi: 10.1002/hbm.20910. [DOI] [PMC free article] [PubMed] [Google Scholar]
- 29.Nichols TE, Holmes AP. Nonparametric permutation tests for functional neuroimaging: a primer with examples. Hum Brain Mapp. 2001;15:1–25. doi: 10.1002/hbm.1058. [DOI] [PMC free article] [PubMed] [Google Scholar]
- 30.Noppeney U, Friston KJ, Price CJ. Effects of visual deprivation on the organization of the semantic system. Brain. 2003;126:1620–1627. doi: 10.1093/brain/awg152. [DOI] [PubMed] [Google Scholar]
- 31.Noppeney U, Friston K, Ashburner J, Frackowiak R, Price C. Early visual deprivation induces structural plasticity in gray and white matter. Curr Biol. 2005;15:R488–R490. doi: 10.1016/j.cub.2005.06.053. [DOI] [PubMed] [Google Scholar]
- 32.Pantev C, Oostenveld R, Engelien A, Ross B, Roberts LE, Hoke M. Increased auditory cortical representation in musicians. Nature. 1998;392:811–814. doi: 10.1038/33918. [DOI] [PubMed] [Google Scholar]
- 33.Raz N, Amedi A, Zohary E. V1 activation in congenitally blind humans is associated with episodic retrieval. Cereb Cortex. 2005;15:1459–1468. doi: 10.1093/cercor/bhi026. [DOI] [PubMed] [Google Scholar]
- 34.Rizzolatti G, Luppino G. The motor cortical system. Neuron. 2001;31:889–901. doi: 10.1016/s0896-6273(01)00423-8. [DOI] [PubMed] [Google Scholar]
- 35.Roder B, Stock O, Bien S, Neville HJ, Rosler F. Speech processing activates visual cortex in congenitally blind humans. Eur J Neurosci. 2003a;16:930–936. doi: 10.1046/j.1460-9568.2002.02147.x. [DOI] [PubMed] [Google Scholar]
- 36.Roder B, Rosler F. Memory for environmental sounds in sighted, congenitally and late blind adults: Evidence for crossmodal compensation. Int J Psychophysiol. 2003b;50:27–39. doi: 10.1016/s0167-8760(03)00122-3. [DOI] [PubMed] [Google Scholar]
- 37.Schoth F, Burgel U, Dorsch R, Reinges MH, Krings T. Diffusion tensor imaging in acquired blind humans, Neurosci. Lett. 2006;398:178–182. doi: 10.1016/j.neulet.2005.12.088. [DOI] [PubMed] [Google Scholar]
- 38.Shafritz KM, Gore JC, Marois R. The role of the parietal cortex in visual feature binding. Proc Natl Acad Sci USA. 2002;99:10917–10922. doi: 10.1073/pnas.152694799. [DOI] [PMC free article] [PubMed] [Google Scholar]
- 39.Shattuck DW, Leahy RM. BrainSuite: an automated cortical surface identification tool. Med Image Anal. 2002;8:129–141. doi: 10.1016/s1361-8415(02)00054-3. [DOI] [PubMed] [Google Scholar]
- 40.Shimony JS, Burton H, Epstein AA, McLaren DG, Sun SW, Snyder AZ. Diffusion tensor imaging reveals white matter reorganization in early blind humans. Cereb Cortex. 2006;16:1653–1661. doi: 10.1093/cercor/bhj102. [DOI] [PMC free article] [PubMed] [Google Scholar]
- 41.Theoret H, Merabet L, Pascual-Leone A. Behavioral and neuroplastic changes in the blind: evidence for functionally relevant cross-modal interactions. J Physiol Paris. 2004;98:221–233. doi: 10.1016/j.jphysparis.2004.03.009. [DOI] [PubMed] [Google Scholar]
- 42.Thompson PM, Moussai J, Khan AA, Zohoori S, Goldkom A, Mega MS, Small GW, Cummings JL, Toga AW. Cortical Variability and Asymmetry in Normal Aging and Alzheimer’s disease. Cereb Cortex. 1998;8:492–509. doi: 10.1093/cercor/8.6.492. [DOI] [PubMed] [Google Scholar]
- 43.Thompson PM, Giedd JN, Woods RP, MacDonald D, Evans AC, Toga AW. Growth Patterns in the Developing Brain Detected By Using Continuum-Mechanical Tensor Maps. Nature. 2000;404:190–193. doi: 10.1038/35004593. [DOI] [PubMed] [Google Scholar]
- 44.Wiesel TN, Hubel DH. Comparison of the effects of unilateral and bilateral eye closure on cortical unit responses in kittens. J Neurophysiol. 1965a;28:1029–1040. doi: 10.1152/jn.1965.28.6.1029. [DOI] [PubMed] [Google Scholar]
- 45.Wiesel TN, Hubel DH. Extent of recovery from the effects of visual deprivation in kittens. J Neurophysiol. 1965b;28:1060–1072. doi: 10.1152/jn.1965.28.6.1060. [DOI] [PubMed] [Google Scholar]
- 46.Wittenberg GF, Werhahn KJ, Wassermann EM, Herscovitch P, Cohen LG. Functional connectivity between somatosensory and visual cortex in early blind humans. Eur J Neurosci. 2004;20:1923–1927. doi: 10.1111/j.1460-9568.2004.03630.x. [DOI] [PubMed] [Google Scholar]
- 47.Woods RP. MultiTracer: a Java-based tool for anatomic delineation of grayscale volumetric images. NeuroImage. 2003;19:1829–1834. doi: 10.1016/s1053-8119(03)00243-x. [DOI] [PubMed] [Google Scholar]
- 48.Yakovlev PI, Lecours AR. The myelogenetic cycles of regional maturation of the brain. In: Minkowksi A, editor. Regional Development of the Brain in Early Life. Blackwell; Oxford: 1967. pp. 3–70. [Google Scholar]
- 49.Yu C, Shu N, Li J, Qin W, Jiang T, Li K. Plasticity of the corticospinal tract in early blindness revealed by quantitative analysis of fractional anisotropy based on diffusion tensor tractography. NeuroImage. 2007;36:411–417. doi: 10.1016/j.neuroimage.2007.03.003. [DOI] [PubMed] [Google Scholar]
- 50.Zarei M, Johansen-Berg H, Smith S, Ciccarelli O, Thompson AJ, Matthews PM. Functional anatomy of interhemispheric cortical connections in the human brain. J Anat. 2006;209:311–20. doi: 10.1111/j.1469-7580.2006.00615.x. [DOI] [PMC free article] [PubMed] [Google Scholar]