
FIGURE 5.
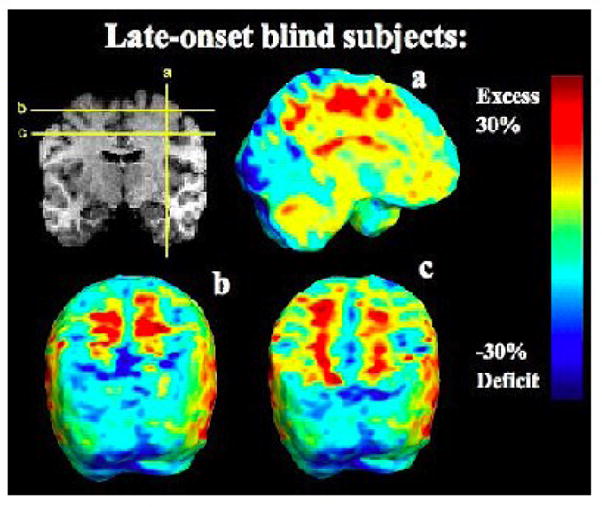
Volumetric excesses in the non-occipital white matter. These maps show the ratio of the mean volume in the LBs relative to that of the sighted controls at each voxel. The color bar displays the percentage difference in average volume between groups.