

Abstract
Transposable elements, particularly LTR-retrotransposons, comprise the primary vehicle for genome size expansion in plants, while DNA removal through illegitimate recombination and intrastrand homologous recombination serve as the most important counteracting forces to plant genomic obesity. Despite extensive research, the relative impact of these opposing forces and hence the directionality of genome size change remains unknown. In Gossypium (cotton), the 3-fold genome size variation among diploids is due largely to copy number variation of the gypsy-like retrotransposon Gorge3. Here we combine comparative sequence analysis with a modeling approach to study the directionality of genome size change in Gossypium. We demonstrate that the rate of DNA removal in the smaller genomes is sufficient to reverse genome expansion through Gorge3 proliferation. These data indicate that rates of DNA loss can be highly variable even within a single plant genus, and that the known mechanisms of DNA loss can indeed reverse the march toward genomic obesity.
Keywords: C-value, cotton, genome evolution, Gossypium, transposable elements
Plant genomes vary enormously in size, from approximately 63 Megabases (Mb) in Genlisea margaretae (1) to greater than 120 Gigabases (Gb) in members of the Liliaceae (2, 3). The genesis of this extraordinary variation has been of interest for over half a century (4, 5), and numerous studies have shown that most genome size variation in plants can be ascribed to differential accumulation of the repetitive fraction of the genome, particularly long terminal repeat (LTR) retrotransposons (6–15). Additionally, transposable element (TE) proliferation is a dynamic process, occurring repeatedly over short evolutionary timescales. For example, studies in maize suggest a doubling of its genome over as little as 3 million years due to TE accumulation alone (10, 11). The same pattern has been shown in Oryza australiensis, where three types of LTR-retrotransposons have proliferated recently and rapidly in episodic bursts that have doubled the genome within the last 2 million years (16). Similarly, copia- and LINE-like elements in some diploid member of Gossypium have amplified via episodic bursts within the last 5 million years, although at different times in each species' evolutionary history (17).
Several mechanisms of DNA loss have been shown to attenuate genome expansion through TE proliferation. One is intrastrand homologous recombination, thought to occur predominantly between the directly repeated LTRs of retrotransposons, typically evidenced by a remaining solo LTR (12, 18). A second mechanism is illegitimate recombination, which generally takes place via nonhomologous end-joining (NHEJ) or slip-strand mispairing, resulting in small deletions (19, 20). Comparisons of internally deleted LTR-retrotransposons from rice and Arabidopsis suggest that illegitimate recombination may be the driving force behind DNA removal in these taxa with smaller genomes (19, 20). In these studies, however, the rate of genome size expansion through TE proliferation is greater than that of DNA removal, leading ultimately to larger genomes.
Given the rapid and recent accumulation of TEs in many plant genomes, combined with a short half-life for LTR-retrotransposons (20), insights into deletion dynamics and their impact on the directionality of plant genome size change are likely to emerge from studies of relatively recently diverged taxa (21). The cotton genus, Gossypium, is an especially good model in this respect. Gossypium (Malvaceae) is a monophyletic genus comprising approximately 50 diploid species of small trees and shrubs that are distributed throughout the world (22–25). Diploid members contain 13 chromosomes and are divided into eight (A–G, K) genome groups based on chromosome pairing behavior and interspecific fertility in hybrids (26, 27). Haploid nuclear content ranges 3-fold, from an average 885 Mb in the New World, D-genome species, to 2572 Mb in the Australian, K-genome species (28). This wide range in genome sizes and a well established phylogeny make Gossypium an excellent model for studying the impact and dynamics of DNA removal as an evolutionary determinant of genome size.
Here, we focus on the abundant gypsy-like LTR-retrotransposon, Gorge3 (6). Using degenerate primers for the reverse transcriptase (RT) region of Gorge3, we amplified and performed phylogenetic analysis of 724 sequences from three Gossypium species that range 3-fold in genome size and from a phylogenetic sister group (24) to Gossypium, i.e., Gossypioides kirkii. Consistent with expectations from other studies in angiosperms, we show that recent episodic bursts of transposition have, in fact, occurred in each lineage, and that the magnitude of each burst is in direct positive correlation with genome size. In addition, however, we use a modeling approach to show that species with small genomes have experienced a faster rate of Gorge3 sequence removal relative to the rate of accumulation, leading to an overall decrease in genome size. The implication is that DNA removal is a powerful determinant of genome size variation among plants and that it can be a sufficiently strong force to not only attenuate, but reverse genome expansion through transposon accumulation.
Results
Phylogenetic Analysis and Timing of Transposition Events.
A total of 724 unique reverse transcriptase (RT) sequences from G. herbaceum (A), G. raimondii (D), G. exiguum (K), and Gossypioides kirkii (outgroup) were subjected to phylogenetic analysis using neighbor-joining (Fig. 1). The resulting phylogeny contained two Gossypium-specific clades consisting of sequences from all three Gossypium species. Lineage-specific sequences from the A- and K-genome species, which have the larger genomes, formed distinct clusters with short to medium branch lengths, while sequences from the D-genome and G. kirkii appeared to have longer branchs. However, recent amplification of Gorge3 even in the two species with small genomes, G. kirkii and G. raimondii (D-genome), was evidenced by small clusters with very short branch lengths present at the tips of multiple longer branches. Few nonlineage specific sequences were recovered from the taxa with larger genomes (G. herbaceum and G. exiguum).
Fig. 1.

Neighbor-joining analysis of 724 PCR amplified Gorge3 reverse transcriptase sequences. Green = A-genome, G. herbaceum, purple = K-genome, G. exiguum, blue = D-genome, G. raimondii, and orange = Gossypioides kirkii. Cotton specific clades are indicated in gray.
Evaluation of the lineage-specific transpositional nature and timing of Gorge3 in each genome revealed episodic bursts of activity since divergence from a common ancestor in all species, at different points in their respective evolutionary histories (Fig. 2). All A-genome pairwise comparisons among lineage-specific clades cluster at 95% sequence identity, suggesting a sudden burst of transposition approximately 2–3 million years ago, preceded and followed by relative quiescence. Similarly, the K-genome appears to have experienced a burst of Gorge3 transposition at approximately the same time as the A-genome. Although few lineage-specific D-genome sequences were sampled, most share greater than 99% sequence identity, suggesting very recent transpositional activity, perhaps within the last million years. Similarly, G. kirkii sequences clustered at 99% sequence identity, but also appear to have experienced a burst of transposition between 7 and 12 million years ago.
Fig. 2.

Lineage-specific nature and timing of Gorge3 transposition in Gossypium. (A) Neighbor-joining analyses for PCR amplified Gorge3 sequences are presented, with lineage-specific sequences in color and sequences originating before diversification in black. (B) The curves represent the distribution of pairwise comparisons among lineage-specific sequences for each genome. The bottom axis represents the percent divergence, the top axis is the estimated transposition time, and the y axis is the density of pairwise comparisons at a given time point.
Lineage-Specific Rates of DNA Gain Versus DNA Loss.
Due to the inherent bias in PCR amplification toward younger intact sequences, Gorge3 sequences from previously constructed random genomic shotgun sequence (GSS) libraries were used to quantitatively estimate the amount of Gorge3 accumulation and deletion in each lineage. A second round of neighbor joining analysis was performed on the 724 PCR amplified sequences plus 294 Gorge3 GSS sequences. The GSS sequences were partitioned into the three time periods (lineage-specific, Gossypium specific, and pre-Gossypium; see Methods) and the copy number and total number of Gorge3 Mb originating at each time point was estimated (Table 1).
Table 1.
Estimated copy number and total number of Mb of Gorge3 from various time points
| G. kirkii outgroup 588 Mb | G. raimondii D-genome 880Mb | G. herbaceum A-genome 1,667 Mb | G. exiguum Kgenome 2,460 Mb | |
|---|---|---|---|---|
| Lineage-specific | ||||
| >90% seq ID copies | 500 ± 1,000* | 789 ± 1,114 | 6,818 ± 3,515 | 12,089 ± 4,827 |
| Mb | † | † | 68 ± 35 | 111 ± 46 |
| Gossypium specific | ||||
| >80 <90% seq ID copies | 789 ± 1,114 | 16,363 ± 5,434 | 27,563 ± 7271 | |
| Mb | † | 163 ± 54 | 290 ± 74 | |
| Pre-Gossypium | ||||
| <80% seq ID copies | 3,001 ± 2,445 | 4,731 ± 2,725 | 22,272 ± 6,331 | 43,037 ± 9,063 |
| Mb | 30 ± 24 | 47 ± 27 | 223 ± 64 | 430 ± 90 |
*Lineage-specific estimate for G. kirkii includes all sequences with an average of greater than 80% sequence identity instead of 90%.
†Unable to estimate number of Megabases with this data.
Surprisingly, Gorge3 copy numbers were more abundant in, pre-Gossypium than at any other time point, for all taxa. Copy number estimates from this oldest time point in G. kirkii (3,001 ± 2,445) and the D-genome (4,731 ± 2,725) were not significantly different from one another, but many retained ancient copies of Gorge3 were identified in the A-genome (22,272 ± 6,331) and twice as many ancient copies were recovered from the K-genome (43,037 ± 9,063). Copy number estimates for Gossypium-specific and lineage-specific time points were so low in the G. kirkii and D-genomes that they cannot be accurately estimated at this level of sampling. However, a consistent decrease in the number of copies originating during these two time periods is observed in the A- and K-genomes. Approximately 16,360 ± 5,434 Gossypium-specific and only 6,818 ± 3,515 lineage-specific copies were recovered from the A genome. Similarly, 27,563 ± 7,271 Gossypium-specific and 12,089 ± 4,827 lineage-specific copies were identified in the K-genome. These copy numbers were subsequently used to estimate the total number of Mb from each time point in each genome, assuming the average Gorge3 is 9.7 kb in length. While approximately 830 total Mb of Gorge3 resides in the 2,460-Mb genome of G. exiguum, only 111 Mb originated specifically within the lineage. The same trend is observed in all of the genomes, with approximately 225 Mb pre-Gossypium and 60 Mb lineage-specific in the A-genome, and 50 Mb pre-Gossypium and only a few Mb lineage-specific in the D-genome.
Modeling the Directionality of Genome Size Change.
A simple growth model was used to infer changes in the rate of gain or loss of Gorge3 across the phylogeny (see Methods). Based on the estimated Gorge3 copy number in extant lineages (see above), the lineage-specific rates of gain or loss (indicated by numbers greater than or less than one, respectively) of Gorge3 DNA (95% confidence intervals in brackets) are: A-genome: 3.91 [2.02, 6.12], D-genome: −4.96 [−7.58, −2.50], K-genome: 11.12 [8.83, 13.89], G. kirkii genome: −3.99 [−6.23, −2.70] (Fig. 3). The common ancestor was estimated to contain 28,878 copies of Gorge3 (with a 95% confidence interval of [25,404–32,174]). Both A- and K-genomes are inferred to have undergone rapid expansion of Gorge3, while both the D-genome and G. kirkii have experienced loss of Gorge3 DNA (Fig. 4). Thus, it appears that genome contraction through deletion of Gorge3 elements has played a dominant role in shaping the G. raimondii and Gossypioides kirkii lineages, whereas genome expansion through Gorge3 proliferation is implicated in the other two lineages.
Fig. 3.

Phylogenetic relationships and estimated rates of Gorge3 gain and loss among diploid members of Gossypium. Branch lengths are to scale. Numbers above the branches represent the estimate of the exponential rate of change in Gorge3 DNA with confidence intervals in brackets. Taxa are shown at tips with entire genome size as well as the amount (in Mb) of extant DNA from Gorge3 elements.
Fig. 4.

Probability distributions for estimated parameters. We generated 1,000 replicate datasets for the current Gorge3 copy number by sampling uniformly between our 95% confidence intervals. (A) The frequency distribution of exponential rate parameters is shown for the four genomes. Orange: G. kirkii, Light blue: D, Green: A, Blue: K. Rates above 0 indicate that the number of Gorge3 elements is increasing, while numbers below 0 indicate that they are decreasing. In no case does the distribution overlap a rate of 0. (B) The frequency distribution of estimated number of Gorge3 elements in the common ancestor of the four genomes.
Discussion
Here, we investigated both the quantitative and temporal nature of gypsy-like Gorge3 evolution in Gossypium. Previous results indicate that copy number variation of this particular LTR-retrotransposon family is primarily responsible for the 3-fold variation in genome size observed among diploid members of the genus (6). Congruent with these findings, we show here that Gorge3 has amplified differentially and independently in each of the lineages studied, with the highest copy number of sequences in the largest (K) genome and the lowest in the smallest (D) genome. However, the transpositional history in each lineage is distinctive and different. While lineage-specific transposition is episodic in nature in all genomes investigated, transpositional events occurred at different times in the evolutionary history of each clade. Episodic bursts of transposition have also been demonstrated in Oryza australiensis (16), a relative of rice with a large genome, and some diploid members of Gossypium (17), suggesting that episodic, transpositional bursts may be a general phenomenon in angiosperm evolution. To the extent that this pattern holds, it raises intriguing questions about the mechanisms that govern relatively long periods of evolutionary stasis, as well as the nature of the “triggers” that release TEs from suppression. Stress and interspecific gene flow are known to disrupt epigenetic regulation, and hence these factors may well be involved; in this respect it is noteworthy that Gossypium contains many documented examples of interspecific hybridization (33).
Evidence for Genome Downsizing in Gossypium.
Comparisons between orthologous BACs from the A- and D-genomes have provided insight into the mechanisms and rates of DNA loss in Gossypium (32, 34). In a gene-rich region surrounding the CesA gene, both the genic and intergenic regions were highly conserved, but in the AdhA region this was not the case. Specifically, in this region the A-genome contained unique transposable element insertions and the D-genome exhibited a 2-fold higher rate of indels, most containing hallmarks of illegitimate recombination, suggesting a higher rate of deletion in the smaller genome. Solo LTRs, indicative of DNA loss through intrastrand homologous recombination, were also evident, suggesting that both mechanisms are operating to remove DNA in Gossypium.
Evidence presented here supports the interpretation that genome downsizing occurred in the D-genome lineage since its origin and despite TE proliferation. Our combined empirical and modeling approaches suggest that there is enormous lineage-specific variation in the gain/loss ratio of Gorge3 retrotransposons. The sequence data highlight an ancient and massive retrotranspositional event in the common ancestor of all Gossypium species as well as in the outgroup, Gossypioides kirkii. It is apparent that the A and K lineages have been unable to purge this ancient Gorge3 DNA and have concomitantly accumulated more lineage-specific Gorge3 copies. In contrast, the D-genome not only has discarded much of its ancient Gorge3 complement, but has also suppressed other rounds of massive TE proliferation. Our modeling results highlight the robust nature of this conclusion. Under most reasonable scenarios, the gain/loss ratios are significantly biased for loss in the taxa having smaller genomes.
One caveat of the current study is that of sequence identification. The GSS sequences used to estimate copy numbers from each genome were identified via similarity searches, and if in fact the D- and G. kirkii genomes posses a higher rate of small deletions, then the more degenerate Gorge3 sequences will be difficult to identify. This would lead to an underestimation of the total number of ancient copies residing in the smaller genomes. Every effort was made to avoid this potential pitfall by performing iterative blast searches within each GSS library to identify degenerate sequences with low sequence identity to Gorge3. Additionally, the GSS libraries represent a minimum level of sampling from each genome, so some of the paralogs for a particular transposition event may not be sampled; however, because there is no apparent variation in substitution rates among these taxa (35) and all of the GSS libraries were constructed in the same manner with the same genome coverage (6), it is reasonable to assume that any sampling bias will be relatively equal among the four genomes and the results comparable to one another.
One may question whether the observed evolutionary trends for Gorge3 are representative of the entire genome or if Gorge3 is subject to evolutionary pressures unique to its particular genomic milieu. For example, gypsy-like retrotransposons have been shown to preferentially insert into pericentromeric heterochromatin in A. thaliana (36). It is unknown whether Gorge3 exhibits similar insertion preferences or other biases, but the possibility remains that the inferences drawn here for rates of DNA loss and gain are not reflective of the genome overall. The veracity of our conclusions, both with respect to Gossypium and other angiosperms (and perhaps other eukaryotes), will only become clear following comparable studies in other genera, using multiple sequence types and with experimental designs that include sampling a diversity of taxa whose phylogenetic relationships are reasonably well known.
Conclusion
The present study demonstrates that genome size is a dynamic feature of plant genomes, even among recently diverged taxa within a single genus. As expected, some genomes appear to have a “one-way ticket to genomic obesity” (37), such as G. exiguum, where a low deletion rate and highly proliferative suite of gypsys indicate that it “feasts” without purging over long evolutionary timeframes. On the opposite extreme, G. raimondii tolerates little TE proliferation and, like Arabidopsis and rice, seems to be on the fast track to a more streamlined genome. The whys and wherefores of these variations remain mysterious, however; why is genome expansion differentially tolerated among lineages? Why are some TE families more successful than others, even among closely related taxa? What internal factors and external forces induce or prevent TE proliferation? Further comparative studies may help elucidate the particular species-specific attributes that allow or prevent surplus transposition leading to genome expansion.
Methods
Plant Material, PCR Amplification, and Phylogenetic Analysis.
Total genomic DNA from the A-genome species G. herbaceum (JMS; 1C = 1,667 Mb), the D-genome species G. raimondii (JFW; 1C = 880 Mb), the K-genome species G. exiguum (Gos 5184; 1C = 2,460 Mb), and the phylogenetic outgroup Gossypioides kirkii (JMS stock; 1C = 588 Mb) was extracted using the Plant DNeasy mini kit (Qiagen Inc.). The Gorge3 reverse transcriptase (RT) region was amplified using primers obtained from Dr. Mark Ungerer at Kansas State University. Primer sequences are as follows: Gorge3F: 5′GGA CCT GCT GGA CAA GGG NTW YAT HMG 3′, and Gorge3R 5′CAG GAA GCC CAC CTC CCK NWR CCA RAA 3′. PCR products were amplified in 20 μL reactions containing 1X PCR buffer (BioLine USA Inc.), 1.8 mM MgCl2, 500 μM dNTPs, 3.75 μM each primer, and 2.5 U TaqDNA polymerase (BioLine USA Inc.). The amplification profile was as follows: 94 °C for 3 min, followed by 35 cycles of 94 °C for 1 min, 45 °C for 2 min, and 72 °C for 1 min, and a final elongation step of 72 °C for 6 min. PCR products were excised from 1.0% agarose gels, purified using the Qiaquick gel purification kit (Qiagen Inc.), ligated into the pGEMT-easy vector (Promega), and subsequently transformed into Mach1 chemically competent cells (Invitrogen). Cloned PCR products were sequenced from one direction using the T7 primer and BigDye Terminator v3.1 (Applied Biosystems). Sequencing products were separated on an ABI 3730xl DNA analyzer (Applied Biosystems) at the Iowa State University DNA sequencing facility. Vector sequence was removed with Crossmatch (29) and primer sequences were removed by hand. Sequences were aligned using MUSCLE (30) and subsequently inspected by eye. Neighbor-joining analyses were performed on the aligned sequences using PAUP* (31). Distances were uncorrected (“p”) and missing data were ignored for affected pairwise comparisons. Lineage-specific transposition events were identified and dated as described in Hawkins et al. 2008 (17).
Estimated Amount of Postspeciation Gorge3 Accumulation and Deletion.
While PCR amplification of TEs is biased toward sequences that proliferated more recently, genomic shotgun sequences (GSS) comprise a putatively unbiased random sample of a genome. To quantitatively estimate the proportion of extant Gorge3 sequences originating at various evolutionary times and to circumvent PCR amplification bias, Gorge3 PCR sequences were queried against previously generated Gossypium GSS libraries (6) and 294 Gorge3 GSS sequences were recovered. The combined data set of 1,018 PCR and GSS sequences was subjected to neighbor-joining analysis and the approximate timing of the origin of each clade was determined (as described in 17). The number of GSS sequences originating within the three separate periods (lineage-specific, Gossypium specific, pre-Gossypium) was determined, and these numbers were used to estimate the copy numbers of Gorge3 from each period (6). The total number of Gorge3 Mb from each time was estimated by multiplying the copy number by 9.7 kb, the average length of Gorge3 in Gossypium (6, 32).
We wished to ascertain whether specific portions of the lineage (i.e., internodes) experienced biased gain/loss ratios of Gorge3. While there are many quantitative models of transposable element proliferation, we were most interested in describing gross changes in copy number. To this end, we applied a simple model for the change in Gorge3 copy number across the Gossypium phylogeny; for each lineage, the number of Gorge3 elements was assumed to follow exponential growth or decay (because each copy has the same chance of being deleted or transposed) with a fixed lineage-specific growth parameter. For example, the number of Gorge3 elements in the D-genome species is given by
where ND is the extant copy number in the D-genome species, NADK is the copy number in the common ancestor of the A, D, and K genome species, rD is the rate at which Gorge3 copy number changes and tD is the amount of evolutionary time between the common ancestor and the D-genome species. Since we possess estimates for the Gorge3 copy number in extant lineages, we were able to reconstruct the internodes using least-squared parsimony and minimizing the squared change in Gorge3 copy number along each internode and tree branch. This means that the rate of Gorge3 copy number change along an internode is the average of three rates (the ancestor of that node and the two descendant internodes). Thus, for our estimated number of extant Gorge3 copies we have a system of linear equations that can be solved for the rate of Gorge3 change along each branch of the tree:
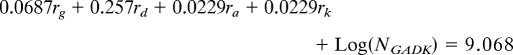 |
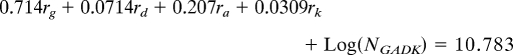 |
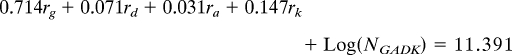 |
where ri is the rate of Gorge3 change along the terminal branch leading to genome i, and NGADK is the Gorge3 copy number in the common ancestor of all four species. This system of four equations has five unknowns (the four rates and the ancestral Gorge3 copy number). We defined a score function as the total amount of change in Gorge3 copy number along the phylogeny. Ancestral copy number was estimated by minimization of the score function. All of our growth rates are scaled to the standardized branch length.
While there are errors associated with our estimates of extant Gorge3 copy number, we performed the reconstruction 1,000 times by sampling uniformly within our 95% confidence intervals. In each case, the sign of the estimated growth rate was the same as that based on the estimates themselves.
Acknowledgments.
We thank Jordan Swanson for computational help, Mark Ungerer for providing primer sequences, Ashley Davidson for generation of sequence data, and Corrinne Grover for providing molecular clock data. This work was supported by the National Science Foundation Plant Genome Program.
Footnotes
The authors declare no conflict of interest.
This article is a PNAS Direct Submission.
References
- 1.Greihuber J, et al. Smallest angiosperm genomes found in Lentibulariaceae, with chromosomes of bacterial size. Plant Biol. 2006;8:770–777. doi: 10.1055/s-2006-924101. [DOI] [PubMed] [Google Scholar]
- 2.Bennett MD, Smith JB. Nuclear DNA amounts in angiosperms. Phil Trans Royal Soc London B. 1991;334:309–345. doi: 10.1098/rstb.1976.0044. [DOI] [PubMed] [Google Scholar]
- 3.Flavell RB, Bennett MD, Smith JB, Smith DB. Genome size and the proportion of repeated nucleotide sequence DNA in plants. Biochem Genet. 1974;12:257–269. doi: 10.1007/BF00485947. [DOI] [PubMed] [Google Scholar]
- 4.Mirsky AE, Ris H. The deoxyribonucleic acid content of animal cells and its evolutionary significance. J Gen Physiol. 1951;34:451–462. doi: 10.1085/jgp.34.4.451. [DOI] [PMC free article] [PubMed] [Google Scholar]
- 5.Thomas CA. The genetic organisation of chromosomes. Annu Rev Genet. 1971;5:237–256. doi: 10.1146/annurev.ge.05.120171.001321. [DOI] [PubMed] [Google Scholar]
- 6.Hawkins JS, Kim HR, Nason JD, Wing RA, Wendel JF. Differential lineage-specific amplification of transposable elements is responsible for genome size variation in Gossypium. Genome Res. 2006;16:1252–1261. doi: 10.1101/gr.5282906. [DOI] [PMC free article] [PubMed] [Google Scholar]
- 7.Hill P, Burford D, Martin DMA, Flavell AJ. Retrotransposon populations of Vicia species with varying genome size. Mol Genet Genomics. 2005;273:371–381. doi: 10.1007/s00438-005-1141-x. [DOI] [PubMed] [Google Scholar]
- 8.Meyers BC, Tingey SV, Morgante M. Abundance, distribution, and transcriptional activity of repetitive elements in the maize genome. Genome Res. 2001;11:1660–1676. doi: 10.1101/gr.188201. [DOI] [PMC free article] [PubMed] [Google Scholar]
- 9.Neumann P, Koblizkova A, Navratilova A, Macas J. Significant expansion of Vicia pannonica genome size mediated by amplification of a single type of giant retroelement. Genetics. 2006;173:1047–1056. doi: 10.1534/genetics.106.056259. [DOI] [PMC free article] [PubMed] [Google Scholar]
- 10.SanMiguel P, Gaut BS, Tikhonov A, Nakajima Y, Bennetzen JL. The paleontology of intergene retrotransposons of maize. Nat Genet. 1998;20:43–45. doi: 10.1038/1695. [DOI] [PubMed] [Google Scholar]
- 11.SanMiguel P, et al. Nested retrotransposons in the intergenic regions of the maize genome. Science. 1996;274:765–768. doi: 10.1126/science.274.5288.765. [DOI] [PubMed] [Google Scholar]
- 12.Shirasu K, Schulman AH, Lahaye T, Schulze-Lefert P. A contiguous 66-kb barley DNA sequence provides evidence for reversible genome expansion. Genome Res. 2000;10:908–915. doi: 10.1101/gr.10.7.908. [DOI] [PMC free article] [PubMed] [Google Scholar]
- 13.Vicient CM, et al. Retrotransposon BARE-1 and its role in genome evolution in the genus Hordeum. Plant Cell. 1999;11:1769–1784. doi: 10.1105/tpc.11.9.1769. [DOI] [PMC free article] [PubMed] [Google Scholar]
- 14.Vitte C, Bennetzen JL. Analysis of retrotransposon structural diversity uncovers properties and propensities in angiosperm genome evolution. Proc Natl Acad Sci USA. 2006;103:17638–17643. doi: 10.1073/pnas.0605618103. [DOI] [PMC free article] [PubMed] [Google Scholar]
- 15.Wicker T, et al. Analysis of a contiguous 211 kb sequence in diploid wheat (Triticum monococcum L.) reveals multiple mechanisms of genome evolution. Plant J. 2001;26:307–316. doi: 10.1046/j.1365-313x.2001.01028.x. [DOI] [PubMed] [Google Scholar]
- 16.Piegu B, et al. Doubling genome size without polyploidization: Dynamics of retrotransposition-driven genomic expansions in Oryza australiensis, a wild relative of rice. Genome Res. 2006;16:1262–1269. doi: 10.1101/gr.5290206. [DOI] [PMC free article] [PubMed] [Google Scholar]
- 17.Hawkins JS, Rapp RA, Hu G, Grafenberg J, Wendel JF. Phylogenetic determination of the pace of transposable element proliferation in plants: copia and LINE-like elements in Gossypium. Genome. 2008;51:11–18. doi: 10.1139/g07-099. [DOI] [PubMed] [Google Scholar]
- 18.Lim JK, Simmons MJ. Gross chromosome rearrangements mediated by transposable elements in Drosophila melanogaster. BioEssays. 1994;16:269–275. doi: 10.1002/bies.950160410. [DOI] [PubMed] [Google Scholar]
- 19.Devos KM, Brown J, Bennetzen JL. Genome size reduction through illegitimate recombination counteracts genome expansion in Arabidopsis. Genome Res. 2002;12:1075–1079. doi: 10.1101/gr.132102. [DOI] [PMC free article] [PubMed] [Google Scholar]
- 20.Ma J, Devos KM, Bennetzen JL. Analyses of LTR-retrotransposon structures reveal recent and rapid genomic DNA loss in rice. Genome Res. 2004;14:860–869. doi: 10.1101/gr.1466204. [DOI] [PMC free article] [PubMed] [Google Scholar]
- 21.Hawkins JS, Grover CE, Wendel JF. Repeated big bangs and the expanding universe: Directionality in plant genome size evolution. Plant Sci. 2008;174:557–562. [Google Scholar]
- 22.Cronn RC, Small RL, Haselkorn T, Wendel JF. Rapid diversification of the cotton genus (Gossypium: Malvaceae) revealed by analysis of sixteen nuclear and chloroplast genes. Amer J Bot. 2002;89:707–725. doi: 10.3732/ajb.89.4.707. [DOI] [PubMed] [Google Scholar]
- 23.Fryxell PA. A revised taxonomic interpretation of Gossypium L. (Malvaceae) Rheedea. 1992;2:108–165. [Google Scholar]
- 24.Seelanan T, Schnabel A, Wendel JF. Congruence and consensus in the cotton tribe. Syst Bot. 1997;22:259–290. [Google Scholar]
- 25.Wendel JF, Cronn RC. Polyploidy and the evolutionary history of cotton. Adv Agron. 2003;78:139–186. [Google Scholar]
- 26.Beasley JO. Hybridization, cytology, and polyploidy of Gossypium. Chron Bot. 1941;6:394–395. [Google Scholar]
- 27.Endrizzi JE, Turcotte K, Kohel RJ. Genetics, cytogenetics, and evolution of Gossypium. Adv Genet. 1985;23:271–375. [Google Scholar]
- 28.Hendrix B, Stewart JM. Estimation of the nuclear DNA content of Gossypium species. Ann Bot-London. 2005;95:789–797. doi: 10.1093/aob/mci078. [DOI] [PMC free article] [PubMed] [Google Scholar]
- 29.Green P. Phrap documentation. 1999. http://www.phrap.org/phrap.docs/phrap.html.
- 30.Edgar RC. MUSCLE: Multiple sequence alignment with high accuracy and high throughput. Nucleic Acids Res. 2004;32:1792–1797. doi: 10.1093/nar/gkh340. [DOI] [PMC free article] [PubMed] [Google Scholar]
- 31.Swofford DL. Sunderland, MA: Sinauer Associates; 2003. PAUP*. Phylogenetic analysis using parsimony (*and other methods) Version 4. [Google Scholar]
- 32.Grover CE, Kim HR, Wing RA, Paterson AH, Wendel JF. Microcolinearity and genome evoltuion in the AdhA region of diploid and polyploid cotton (Gossypium) Plant J. 2007;50:995–1006. doi: 10.1111/j.1365-313X.2007.03102.x. [DOI] [PubMed] [Google Scholar]
- 33.Cronn RC, Wendel JF. Cryptic trysts, genomic mergers, and plant speciation. New Phytol. 2004;161:133–142. [Google Scholar]
- 34.Grover CE, Kim H, Wing RA, Paterson AH, Wendel JF. Incongruent patterns of local and global genome size evolution in cotton. Genome Res. 2004;14:1474–1482. doi: 10.1101/gr.2673204. [DOI] [PMC free article] [PubMed] [Google Scholar]
- 35.Senchina DS, et al. Rate variation among nuclear genes and the age of polyploidy in Gossypium. Mol Biol Evol. 2003;20:633–643. doi: 10.1093/molbev/msg065. [DOI] [PubMed] [Google Scholar]
- 36.Peterson-Burch BD, Nettleton D, Voytas DF. Genomic neighborhoods for Arabidopsis retrotransposons: A role for targeted integration in the distribution of the Metaviridae. Genome Biol. 2004;5:R78. doi: 10.1186/gb-2004-5-10-r78. [DOI] [PMC free article] [PubMed] [Google Scholar]
- 37.Bennetzen JL, Kellogg EA. Do plants have a one-way ticket to genomic obesity? Plant Cell. 1997;9:1509–1514. doi: 10.1105/tpc.9.9.1509. [DOI] [PMC free article] [PubMed] [Google Scholar]