

Abstract
As obesity and its related health problems grow around the world, efforts to control and manage weight is increasing in importance. It is well known that altering and maintaining weight is problematic and this has led to specific studies trying to determine the cause of the difficulty. Recent research has identified that the body reacts to forced weight change by adapting individual total energy expenditure. Key factors are an adaptation of resting metabolic rate, non-exercise activity thermogenesis and dietary induced thermogenesis. We develop a differential equation model based on the first law of thermodynamics that incorporates all three adjustments along with natural age related reduction of the resting metabolic rate. Forward time simulations of the model compare well with mean data in both overfeeding and caloric restriction studies.
Keywords: energy balance equation, metabolic adaptation, non-exercise activity thermogenesis
1. Introduction
With two-thirds of all Americans estimated as overweight and of these one-third as obese [49], there is considerable interest in weight change and maintenance techniques. Caloric restriction or dieting is a popular method of reducing weight, however, it is not only difficult to adhere to, but also may at times not bring about the weight loss results we seek [5, 17, 19]. A similar phenomenon is also observed in overfeeding experiments where the weight gain is not as high as expected even after adjustments for altered body composition [21, 25, 27, 39].
There are three components of energy expenditure that contribute to adjustment during changes in energy intake. One reason that expected weight reduction may not be observed or weight loss maintenance difficult to achieve is due to metabolic adaptation. Metabolic adaptation occurs when the body adapts to caloric restriction by decreasing resting metabolic rate (RMR), the amount of energy expended while at rest. This decrease is beyond the expected decrease in RMR due to change in energy stores (body mass) [17, 29]. Metabolic adaptation has been observed in calorie restricted humans in clinical studies for 3-8 months [17, 29]. There has been discussion about whether this adjustment will eventually stabilize during longer periods of caloric restriction, however, a laboratory controlled longitudinal 11-year study of calorie restricted Rhesus monkeys found a metabolic adjustment of 13% lower than accounted by altered body composition [33]. There appears to be considerable variance in how much metabolic adaptation inhibits individual weight loss and this variance is currently a topic of serious investigation by medical researchers.
An adjustment has also been observed in the rate of energy expended due to the thermic effect of food during both overfeeding and caloric restriction studies[15, 27]. This adjustment exceeds the rate of energy expended during digestion beyond changes accounted for in body composition and was examined through a mathematical model in a recent paper by K. Hall [15].
Finally, an interesting phenomena observed in caloric restriction and overfeeding studies is the change in non-exercise activity thermogenesis or NEAT. The impact of NEAT on resistance to change in body mass has been the focus of several overfeeding studies [21, 25, 27, 39]. C.K. Martin et al. also found that physical activity levels decreased over three months of calorie restriction [29].
In order to fully understand how caloric intake impacts weight change, a mathematical model that incorporates observed clinical adaptations to change in intake could serve as a tool to set lifestyle weight reduction and maintenance goals accordingly. In this paper we develop and analyze a differential equation that models weight change and incorporates adaptations that defend baseline body mass.
Mathematical modeling of weight dynamics in humans has a long and scattered history [1, 2, 3, 14, 15, 23, 24]. Some of the models aggregate observed clinical and laboratory data to make estimates on expected outcomes. We will refer to this type of formula as a statistical model. Recent research has focused on deterministic energy balance models based on the first law of thermodynamics. In our attempt to understand the impact of metabolic adaptation on weight changes, we will extract ideas, parameter values, and terms from several of these recent models. In particular, we note that the following four ideas appearing in previous models were used to develop the model in this paper:
The Kozusko model in [23] incorporated metabolic adjustment and a nonlinear RMR term. The Kozusko model uses Kleiber's Law to model RMR which is discussed in Section 2.4.
The Chow-Hall model in [1] made simplifying modifications to the original system in [14] to arrive at a one dimensional differential equation.
The Hall model in [15] applies a multiplier effect for the adaptation of dietary induced thermogenesis.
The Christiansen-Garby-Sorenson model in [3] computes an efficiency parameter that accounts for the energy expended to store energy during weight gain.
The model presented here incorporates the ideas used above along with the following modifications:
We model resting metabolic rate by an affine function of body mass to a power based on a statistical model developed by Livingston and Kohlstadt [28].
We incorporate the continuous effects of aging on resting metabolic rate and on body mass.
We incorporate adaptation of non-exercise activity thermogenesis to changes in intake.
In the next section, we develop our model beginning with the concept of energy balance.
2. Model Development
2.1. The Energy Balance Principle
The energy balance principle discussed in physiology and nutrition literature is based on the application of the first law of thermodynamics to an open system [6]. The human body is considered an open system because energy can be added to the system by input of mass flow in the form of food. The first law reduces to the usual energy balance equation seen in nutrition and physiology literature as:
| (1) |
where R is the rate of kcal/d that are stored or lost, I is the rate of kcal/d that is ingested and E is the rate of kcal/d expended [22, 31].
For specific cases, the terms in (1) need to be developed accordingly based on assumptions behind what we are examining. For example, in [40], the terms and parameters in the energy balance model were developed to understand how a fetus grows in utero. Each term was constructed with attention given to how this value is or can be measured and validated. In some cases, parameters and variables were formulated to simplify the measurements or mathematics, with justification that these assumptions do not overly reduce the quality of the model results. In a similar manner, we now develop formulations for each of the quantities R, I and E in the energy balance equation. Because of the large number of variables and parameters, we summarize the description of all notation in Table 1.
Table 1.
Legend of Notation
| Notation | Description | Estimation | Units | |
|---|---|---|---|---|
| Energy Balance Terms | R | Rate of energy accretion | N/A | kcal/day |
| I | Rate of energy intake | Time averaged estimate | kcals/day | |
| E | Rate of energy expended | N/A | kcals/day | |
| DIT | Dietary induced thermogenesis | N/A | kcals/day | |
| PA | Volitional activity | N/A | kcals/day | |
| RMR | Resting energy requirements | Livingston-Kohlstadt | kcals/day | |
| NEAT | Non-exercise activity thermogenesis |
N/A | kcals/day | |
| State Variables | F(t) | Fat mass on day t | N/A | kg |
| FFM(t) | Fat free mass on day t | FFM = α1F + b | kg | |
| W | Total body mass | W=FFM+F | kg | |
| Parameters | G | Time averaged kcals of glucose |
N/A | kcal |
| f | Proportion of FFM(t) of muscle tissue available | 0.30 ≤ f ≤ 0.50 | N/A | |
| cl | Caloric value of kg of fat free mass | 955.384 | kcals/kg | |
| cf | Caloric value of kg of fat mass | 7165 | kcals/kg | |
| β | DIT = βI | 0.04 ≤ β ≤ 1.14 | N/A | |
| m | Proportion of body mass related to PA | N/A | kcals/kg/d | |
| aF, aM | Body mass proportionality | aF = 248, aM = 293, | N/A | |
| constant in Livingston-Kohlstadt | ||||
| pF, pM | Exponent of body mass in Livingston-Kohlstadt |
pF = 0.4356, pM = 0.4330 | N/A | |
| yF, yM | Proportion age decrease to RMR in Livingston-Kohlstadt |
yF = 5.09, yM = 5.92 | N/A | |
| A0 | Initial Age | A0 > 0 | years | |
| A | Age | A = A0 + t/365 | days | |
| a | Percent of metabolic adaptation | 0 ≤ a ≤ 1 | N/A | |
| e | Efficiency of depositing stored energy | Male: e = 0.82 Female: e = .83 |
N/A N/A |
|
| α1 | Slope of linear relationship between FFM and F |
Male: aα1 = 0.56 Female: α1 = 0.32 |
N/A N/A |
|
| b |
y-intercept of linear relationship between FFM and F |
b > 0, baseline data |
kg | |
| α | W = αF + b | α = α1 + 1 | N/A | |
| r | Proportion change in NEAT to change in E |
r = 2/3 |
The following is a summary of the list of assumptions behind our model.
The model is developed for a non-diabetic adult who is not involved in strenuous exercise. According to CDC estimates, the lack of regular high levels of physical activity accounts for 4 out of 5 Americans [31].
The caloric equivalent of glucose and glycogen levels are approximated by a time averaged constant, G, measured in kcals. The time interval over which this constant is determined is on the order of one week. This constant does not need to be measured for the purposes of this model.
Total kcals of food ingested per day is approximated by a time averaged constant, I measured in kcals/day. The time interval over which this constant is determined is on the order of one week. This parameter can be estimated using traditional methods.
Fat free mass is a function of fat mass. We obtain a linear approximation correlating fat free mass to fat mass. The nonlinear relationship between fat free mass and fat mass has been observed by G. Forbes in [7] and recently re-examined in [13].
The change in NEAT is directly proportional to the change in E [27].
Based on clinical observations The kcals/day attributed to dietary induced thermogenesis is a direct proportion of total kcals/day ingested. This proportion, ω ranges from 4-15% of total caloric intake per day. Similar to the term formulated for DIT in [15], when the rate of energy ingested changes, DIT is assume to adjust by a multiplicative constant factor, β, which is greater than 1 for overfeeding situations and between zero and one for calorie restriction cases.
As in the Chow-Hall model, the rate kcals/day due to volitional physical activity is assumed to be entirely weight bearing. That is, we assume that the kcals expended in physical activity that is non-weight bearing is negligible. Similar to the Chow-Hall model, we also formulate this expenditure as a direct proportion of body mass.
Energy is reqUired to store energy. We model this by an efficiency parameter for how much the rate of net energy gained changes to stored energy, which is estimated in [3] to be about 83% for women and 82% for men.
2.2. The Rate of Energy Storage, R
Energy that is not used by the body is stored in the form of glycogen, lipids and protein [18]. Glycogen is a storage molecule of the body's short-term energy resource, glucose [9]. During normal periods in which an individual does not perform prolonged exercise or fasting, the body attempts to keep the concentration of glucose in the bloodstream at 80 – 100 mg per 100mL of blood [9]. Because of the regulatory mechanism that works to maintain the glucose/glycogen level in a narrow range, we can assume its time averaged value to be constant. We remark here that this assumption has been compared to successfully to observed data in [1]. Similar to the Chow-Hall model [1], we denote the total time averaged amount of glucose and glycogen in the body by the constant G, expressed in terms of kcals of glucose energy.
Lipids (mainly in the form of fatty acids) are the nutrients containing the most energy per unit mass[18]. Unlike glucose, fat can be stored in large quantities for extended lengths of time in the form of triacylglycerols under the adipose tissue spread throughout the external human body. Therefore, fat mass is the main long-term energy storage mechanism of the human body. We denote the total kg of fat mass of the body at time t by the function F(t).
Protein's building blocks, amino acids, can be broken down and transformed to glucose to be used for energy through amino acid metabolism [18]. Although there are small amounts of protein stored in the liver, the major portion is contained in the body's muscle tissue (Gilbert (2000)). It is estimated that 30 to 50% of total fat free mass is stored as muscle tissue [20]. If we denote the total kg fat free mass on day t by FFM(t), we have that fFFM(t) is the proportion of FFM(t) of muscle tissue available as energy reserve. Total body mass, W , is a sum of fat free mass and fat mass:
G. Forbes had observed an algebraic relationship between fat mass and fat free mass [7] . The Forbes curve developed for women in [7],
considers FFM as an increasing function of FM and has been recently re-examined by K. Hall in [13]. At this time, we will only consider a linear approximation of this correlation:
where α1, b are positive constants. The linear approximation yields,
| (2) |
where α = 1 + α1. Estimations of the parameters α1 and b will be discussed in the simulation section.
Separating R in the three different components, G, FFM(t), F(t) we have
| (3) |
where cl is the caloric value of a kg of usable fat free mass and cf is the caloric value of usable fat mass. The values of cl and cf were obtained from [3] and appear in Table 1.
Because G is a time averaged constant, . Substituting this and the formula relating FFM(t) to F(t) in (2) yields
where λ = clfα + cf.
2.3. The Rate of Energy Intake, I
Applying the concept of time averaging (see [1]), the rate of intake, I, is the total time averaged rate in kcal/day of food ingested. This value is estimated in the simulation section by using benchmark percentages based on age, weight and gender.
2.4. The Rate of Energy Expenditure, E
The rate of energy expenditure consists of four different quantities; the kcals/day used for dietary induced thermogenesis (DIT), volitional physical activity (exercise) (PA), basal metabolic rate (RMR), and non-exercise activity thermogenesis (NEAT) [10]:
| (4) |
DIT is the energy involved in processing food. This consists of digestion, absorption, metabolization, storage and transport of ingested food and is estimated to account for 4-15% of total energy expenditures [10]. Although DIT was observed to be sensitive to amount of protein ingested, we do not examine this aspect of DIT [46]. In the case of an aggregated composition of food intake, we assume that DIT is a direct proportion of the rate of energy intake, I, with proportionality constant, ω. In [15], the adjustment to calorie reduction on DIT was examined by multiplying ω by an adjustment factor. In fact, such an adjustment has also been observed in overfeeding studies by a factor of up to 14% [27]. We model the adjustment by a multiplier that is greater than 1 for the overfeeding case and less than one in the calorie restriction case. As in [15] we absorb the multiplier into one constant β.
Therefore, the energy expended for dietary induced thermogenesis is
By physical activity, PA, we specifically mean volitional exercise such as sports and fitness related activity. PA can accounts for 20-40% of total energy expenditures [10]. Strenuous exercise or starvation cause glycogen stores to deplete [9]. As a result the liver begins to produce ketone bodies as an alternative energy source. Because we are not modeling extreme cases such as starvation, we assume the physical activity is light to moderate and does not deplete glycogen stores. Some of PA is what we refer to as weight bearing activity and some of PA is non-weight bearing. Weight bearing activities involve activities that require us to carry our body weight. For example, walking and running are examples of weight bearing activities. As in the Chow-Hall model we assume that kcals used for non-weight bearing activity is negligible.
Thus, the rate of weight bearing exercise is estimated as a direct proportion of body mass and so we model PA by,
where m is the proportionality constant in kcals/kg/day.
An individual's RMR is the rate of energy required to sustain life. RMR is measured in controlled conditions. The subject must be in a relaxed (preferably just having awakened), postabsorptive state (12 hours or more of fasting) [10]. Thus, the direct determination of RMR is not simple. There exists several simple statistical formulas that estimate of RMR depending on sex, total body mass, height, and age. These formulas are based on extensive experimental data which was analyzed using predictive regression equations. Although these estimates work well in most situations, they tend not to be as reliable in extreme cases such as obesity [36].
The most commonly used formula is the statistically based Harris-Benedict equation [16], which assumes that RMR is affinely related to body mass. There are many other formulas found in the literature and a summary of several of the most common can be found in [44]. We used published data to compare different formulas in the literature against RMR data and found the statistically generated formula proposed by Livingston and Kohlstadt provides the best estimates of RMR [28]. The Livingston-Kohlstadt formula is an affine function of body mass to a power:
| (5) |
where aM = 293, aF = 248, pM = 0.4330, pF = 0.4356, yM = 5.92, yF = 5.09, W represents body mass, and A represents age.
In order to view Equation (5) as a continuous function of age, we consider A as a time varying function, A = A0 + t/365, where A0 is the age of the individual at t = 0. Metabolic adaptation during calorie restriction results in a basal metabolic rate that is lower than expected [29]. The expected basal metabolic rate based on body mass in our model is given by Equation (5). If a is the percent of metabolic adaptation where 0 ≤ a ≤ 1, then we model the contribution of resting metabolic rate with adaptation to energy expenditures by
Individual activity that is non-volitional is characterized as nonexercise activity thermogenesis (NEAT) [27]. NEAT is the thermogenesis that accompanies physical activities other than volitional exercise, such as the activities of daily living, fidgeting, spontaneous muscle contraction, and maintaining posture. The possibility that NEAT might mediate resistance to fat gain was studied in [27]. Spontaneous physical activity (a component of NEAT) is a familial trait that shows marked inter-individual differences in its contribution to daily energy expenditure [34, 42]. The work in [27] was conducted to determine if changes in NEAT could explain the wide variations in individual weight gain due to overfeeding.
Interestingly, NEAT is found to change during both over-feeding experiments [25, 27] and caloric restriction in obese individuals [5]. Specifically, subjects in over-feeding experiments were found to increase involuntary movements such as fidgeting [27]. Likewise, subjects who were caloric restricted decreased NEAT by altering posture and decreasing involuntary fidgeting [5].
NEAT is an extremely difficult quantity to measure even in very controlled settings. In the study published in [27] subjects were monitored to conduct volitional exercise at constant, low levels, which was confirmed through questionnaires and direct measures of physical activity. Although the energy expended in volitional physical activity changes with body composition (as we have modeled PA), the study makes the assumption that these changes are small and negligible in order to obtain an estimate of the change in NEAT. When this assumption was made in the overfeeding study in [27], the change in NEAT was estimated by computing total volitional and non-volitional expenditures before and after overfeeding and subtracting the corresponding DIT and RMR expenditures. In this manner, estimates for the change in NEAT over time were related to the change in E. Observations in [27] found that the change in NEAT was equal to 2/3 the change in E. Based on this conclusion, if we make the assumption that the change in NEAT is directly proportional to the change in E, we have:
where r represents the proportionality constant relating the change in NEAT to the change in E. Expanding E using (4) and applying the linearity of the Δ operation yields:
Integration over time allows us to solve for NEAT in terms of the remaining energy expenditures:
where C is a constant of integration.
For the purpose of simulations initial NEAT can be estimated by benchmark percentages (10% of E) appearing in the literature [10, 31] and as a result C can be solved for in terms of the initial conditions.
Combining each term we have formulated for energy expenditure yields
| (6) |
The Christiansen-Garby-Sorenson model addresses the fact that energy is required to store energy. As part of their model development, they take special care to factor in this requirement. Based on empirical data, the authors calculate an efficiency of energy storage constant, e which can be considered as a multiplier of the rate of energy in minus the rate of energy expended to convert to the rate of energy stored. This efficiency constant was estimated to be around 82% for men and 83% for women. Likewise, energy is required to unpack energy stores, however the efficiency value is not known for this case so we assume as in previous models that this value is e = 1. Applying this concept and the expressions obtained for R, I and E and substituting into Equation (1) we obtain the final model,
| (7) |
with initial condition
where
3. Mathematical Analysis
In this section we address the existence, uniqueness and non-negativity of solutions to (7). The right hand side of Equation 7 is continuous guaranteeing an interval of existence of the solution on [0, ∈) where ∈ > 0 [12]. In order to guarantee non-negativity of solutions, we require the right hand side of the differential equation be quasi-positive, that is, dF/dt ≥ 0 whenever F = 0 [30]. The right hand side is quasi-positive exactly when
| (8) |
.
Because the model assumptions have not been developed for a case where fat stores have been completely depleted as in the case of starvation, the above restriction makes realistic sense in terms of what Equation (7) is essentially modeling. A starvation model where F may be allowed to go to zero has been developed in [41].
To guarantee existence for all time, let us assume on the contrary that there is a b0 such that the limt→b0 F(t) = ∞. Then for some T > 0, there is a subsequence tk with tk → b0 and F(tk) increasing to infinity.
But then substitution into the differential equation yields
which implies F′(tk) → −∞ which creates a contradiction. Therefore under condition (8) a non-negative solution to the initial value problem exists for all time t ≥ 0
4. Parameter Estimations, Numerical Simulations, and Comparison to Experimental Data
A program was written in Maple that simulates the model with an input of baseline information. Using data from an overfeeding study [43] and three caloric restriction studies [8, 35, 45] we are able to compare actual mean data to model estimates. We emphasize that parameter estimates were not determined using these data sets. Table 2 describes all parameter values that are universal to numerical simulations.
Table 2.
Constants that are universal to all simulations.
| Constant | Value | Reference |
|---|---|---|
| r | r = 2/3 | Overfeeding study: [27] |
| e* | e = 0.83 - women and e = 0.82 - men. | Estimate derived in: [3] |
| cl, cf | cl = 955.384, cf = 7165, | Estimate obtained from: [3] |
| aM, aF, pM, pF, yM, yF | aM = 293, aF = 248, aM = 0.4330, pF = 0.4356, yM = 5.92, yF = 5.09 | Statistically determined in: [28] |
| α1 men | α1 = 0.54; slope between data points: (28.4kg, 67.7kg) (23.6kg,65.1kg) | Weight loss study: [37] |
| α1 women | α1 = 0.324; slope between data points: (44.2kg,49.6kg) and (37.7kg,47.5kg) | Weight loss study: [11] |
| f | f = 0.30 | Estimate from: [19] |
| β | β = 1.14: overfeeding, β = 0.075: caloric restriction | Estimates from: [27, 46] |
| a* |
a = 0.334, 0.059 for a 500 kcal/day reduction to baseline for 3 months, 6 months a = 0.27, 0.053 for a very low calorie diet; 3 month and 6 month |
Percentages calculated from data in [29] |
The parameter e is required only for overfeeding simulations and the parameter a is nonzero for caloric restriction simulations.
4.1. A comparison to an overfeeding study: Simulation 1
In [43], 23 men with mean age 20 were fed 1000 over baseline intake and observed for a 100 day period. The model was simulated using the baseline age, weight and RMR provided in [43]. NEAT is a extremely difficult to measure directly and baseline values are never provided in the literature. To estimate baseline values of NEAT, we use the benchmark values of adaptive thermogenesis in [31] that estimate adaptive thermogenesis as 10% of total expenditures. We also estimate baseline DIT to be 0.075 of baseline intake. For a summary of baseline information, we refer to Table 3.
Table 3.
Baseline information used to simulate model compared to data in [43].
| Baseline Information | Measured in study | Estimated through benchmark percentages |
|---|---|---|
| RMR | 1634 kcal/day | |
| E | 60% of E is RMR: 2723.33 kcal/day | |
| DIT | 7.5% of E: 203.25 kcal/day | |
| NEAT | 10% of E: 272.33 kcal/day | |
| PA | E-RMR-NEAT-DIT: 612.75 kcal/day | |
| FFM | 53.4 kg | |
| F | 6.9kg | |
| W | 60.3kg |
The time series solution of baseline information in Table 3 for weight, fat mass and NEAT up to 100 days are shown in Figure 1.
Figure 1.

Simulation of baseline data in [43] for F(t),W and NEAT.
The satisfying model comparison of data from [43] at the 100 day mark is given in Table 4.
Table 4.
Comparison of model with and without NEAT term to data in [43] at 100 days. Fat mass and fat free mass are overestimated if NEAT term is not included.
| Actual | Model with NEAT term | Model without NEAT term | |
|---|---|---|---|
| Weight in kg | 68.4 | 68.4 | 72.5 |
| Fat Mass in kg | 12.3 | 12.2 | 15 |
| Fat Free Mass in kg | 56.1 | 56.1 | 57.5 |
We remark that the data in [43] is fairly homogenous (all participants around the same age) and the standard deviation of the baseline and final values from the study is low.
4.2. Three Calorie Restriction Studies - Simulations 2,3,4
Simulation 2 serves to compare model estimates to aggregate data published in [8]. The data in [8], which we apply baseline information to simulate the model, involved 24 females on an 800kcal/d liquid diet for 12 weeks. The average age of women in the study was 42.1 years. Because this study is similar to the 890 kcal/day diet applied in [29], we apply the metabolic adaptation observed [29] at the 3 month mark of a = 2.7%.
Simulation 3 compares model estimates to aggregate data published in [45]. In this study, 108 women were placed on an 800 kcal/d diet for 21 days in a closed metabolic ward. As in the previous simulation, we apply the 3 month percentage metabolic adaptation seen in [29] of a = 2.7%.
Finally, Simulation 4 placed six women on a low calorie diet of 25% below baseline for 6 months. In this study, baseline caloric intake is not provided, and as a result, we estimated baseline intake by dividing the estimate for baseline RMR by 60%. Taking 25% of the total caloric intake baseline numbers yielded a 588.38 kcal/d restriction which was similar to the 500 kcal/d restriction in [29]. In the 500 kcal/d analysis in [29], we obtain a = 0.059 at the 6 month mark.
A summary of baseline data for Simulations 2,3 and 4 are provided in Table 5 and a summary of end value comparisons appear in Table 6. The importance of including a term for NEAT and applying metabolic adaption are seen by comparison to model simulations without these modifications. In fact, estimates without NEAT and metabolic adaptation indicate weight loss that is lower than observed. We remark that the simulation using baseline information from [35] had more error than the other two studies. This error may be due to estimation error on exactly how many kcals subjects in this study actually reduced by.
Table 5.
| Reference | Quantity | Value* |
|---|---|---|
| [8] | RMR | 1662.5 kcal/day |
| E | 2770.83kcal/day* | |
| DIT | 207.81 kcal/day* | |
| NEAT | 277.08 kcal/day* | |
| PA | 623.44 kcal/day* | |
| FFM | 53.5 kg | |
| F | 48.0kg | |
| W | 102.5 kg | |
| a | 0.027 | |
| [45] | RMR | 1662.13 kcal/day* |
| E | 2770.21kcal/day* | |
| DIT | 207.77 kcal/day* | |
| NEAT | 277.02 kcal/day* | |
| PA | 623.30 kcal/day* | |
| FFM | 50.9 kg | |
| F | 49.9kg | |
| W | 100.8 kg | |
| a | 0.027 | |
| [35] | RMR | 1412.12 kcal/day* |
| E | 2353.53 kcal/day* | |
| DIT | 176.51 kcal/day* | |
| NEAT | 235.35 kcal/day* | |
| PA | 529.54 kcal/day* | |
| FFM | 45.7 kg | |
| F | 27.8 kg | |
| W | 73.5 kg | |
| a | 0.059 |
Baseline information not provided; benchmark percentages used as in Table 3.
Table 6.
4.3. Theoretical simulations
The beauty of a mathematical model is that you now can provide longer time projections than possible in controlled experiments. To this end, we simulated the baseline information in [35] and [43] for a five year period. Figure 2 depicts a simulation of the model of weight loss with metabolic adaptation of 5% using the baseline information in [35] projected over five years. Likewise, Figure 3 projects weight gain with overfeeding of a 1000 kcal/day over baseline from data in [43] and the resulting simulation over five years. Finally, we simulated a case of no caloric change so we can observe the effects of natural aging on weight gain. As depicted in Figure 4 we see the incremental increase of weight over a 20 year period for a female with baseline weight of 52kg and age 38.
Figure 2.
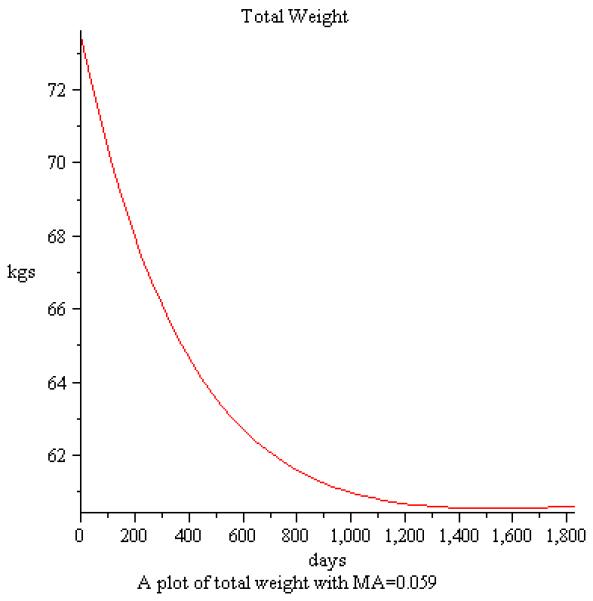
Simulation of weight loss over a five year period using baseline information from [35].
Figure 3.
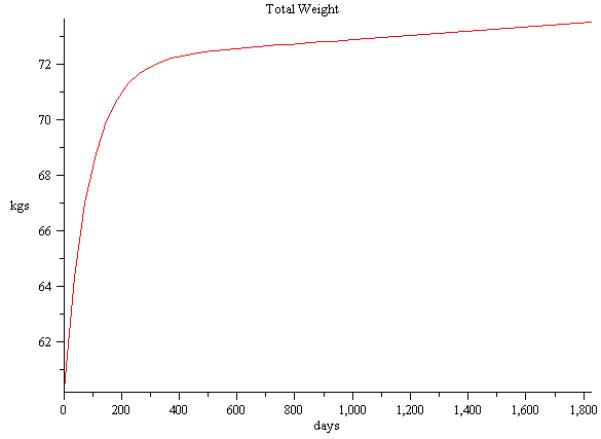
Simulation of weight gain over a five year period using baseline information from [43].
Figure 4.

Simulation of weight gain over a five year period using baseline information from [43].
5. Conclusion
One major concern in measuring energy expenditures is the difficulty one has in obtaining comprehensive data on its components, NEAT in particular. As part of our model formulation, we develop a term based on clinical observations to directly quantify NEAT as a time dependent function. The model presented here also quantifies metabolic adaptation due to caloric restriction that serve to defend baseline body weight. Although the question of how much each of these adaptations affect changes in individual body mass, model comparisons to published data justify the existence of adaptations on weight change due to both overfeeding and caloric restriction.
Limitations of the model assumptions need to be examined for future work. The model was developed for non-diabetic healthy individuals, however, with 2/3 of the United States population as overweight, there is a significant portion of the population undergoing weight related medical issues. In addition, the model comparisons provided evaluate the model against statistically aggregated data. In order to validate model reliability, comparisons need to be made to individual data.
Acknowledgements*
We would like to thank Jules Hirsch for the leads and discussion provided that generated some of the ideas in this model.
The third author is supported by NIH grant RO1 DK56650-04. The last author is supported by NIH grant K23-DK068052.
Contributor Information
Diana M. Thomas, Department of Mathematical Sciences Montclair State University Montclair, NJ 07043, USA
Ashley Ciesla, Department of Mathematical Sciences Montclair State University Montclair, NJ 07043, USA.
James A. Levine, Department of Medicine Endocrine Research Unit Mayo Clinic and Mayo Foundation Rochester, MN 55905, USA.
John G. Stevens, Department of Mathematical Sciences Montclair State University Montclair, NJ 07043, USA
Corby K. Martin, Pennington Biomedical Research Center Ingestive Behavior Laboratory Baton Rouge, LA 70808, USA
REFERENCES
- 1.Chow CC, Hall KD. The dynamics of human weight change. PLoS Comp. Biolg. 2008;4:e1000045. doi: 10.1371/journal.pcbi.1000045. [DOI] [PMC free article] [PubMed] [Google Scholar]
- 2.Christiansen E, Garby L. Prediction of body weight changes caused by changes in energybalance. Eur J Clin Invest. 2002;32:826–30. doi: 10.1046/j.1365-2362.2002.01036.x. [DOI] [PubMed] [Google Scholar]
- 3.Christiansen E, Garby L, Srensen TIA. Quantitative analysis of the energy requirements for development of obesity. Journal of Theoretical Biology. 2005;234:99106. doi: 10.1016/j.jtbi.2004.11.012. [DOI] [PubMed] [Google Scholar]
- 4.Deriaz O, Tremblay A, Bouchard C. Non linear weight gain with long term overfeeding in man. Obes. Res. 1993;1(3):179–85. doi: 10.1002/j.1550-8528.1993.tb00609.x. [DOI] [PubMed] [Google Scholar]
- 5.Doucet E, St-Pierre S, Almeras N, Despres J, Bouchard C, Tremblay A. Evidence for the existence of adaptive thermogenesis during weight loss. British Journal of Nutrition. 2001;85:715–723. doi: 10.1079/bjn2001348. [DOI] [PubMed] [Google Scholar]
- 6.Folger H. Elements of Chemical Reaction Engineering. 4th Edition Prentice Hall; 1986. [Google Scholar]
- 7.Forbes GB. Lean body mass-body fat interrelationships in humans. Nutr. Rev. 1987;45:225–231. doi: 10.1111/j.1753-4887.1987.tb02684.x. [DOI] [PubMed] [Google Scholar]
- 8.Foster GD, Wadden TA, Peterson FJ, Letizia KA, Bartlett SJ, Conill AM. A controlled comparison of three very-low-calorie diets: effects on weight, body composition, and symptoms. Am. J. Clin. Nutr. 1992;55(81):1–7. doi: 10.1093/ajcn/55.4.811. [DOI] [PubMed] [Google Scholar]
- 9.Gilbert GF. Basic Concepts in Biochemistry. McGraw-Hill Health Professions Division; 2000. [Google Scholar]
- 10.Gropper S, Smith J, Groff J,J. Advanced Nutrition and Human Metabolism. Thomson Wadsworth Pub.; 2005. [Google Scholar]
- 11.Hainer V, Stunkard AJ, Kuneov M, Parzkov J, tich V, Allison DB. Intrapair resemblance in very low calorie diet-induced weight loss in female obese identical twins. I. J. Obesity, August 2000. 2000;24(8):1051–1057. doi: 10.1038/sj.ijo.0801358. [DOI] [PubMed] [Google Scholar]
- 12.Hale J. Ordinary Differential Equations. 2nd Ed. Krieger; 1980. [Google Scholar]
- 13.Hall KD. Body fat and fat-free mass interrelationships: Forbes Theory revisited. Br. J. Nutr. 2007;97:1059–1063. doi: 10.1017/S0007114507691946. [DOI] [PMC free article] [PubMed] [Google Scholar]
- 14.Hall KD. Computational model of in vivo human energy metabolism during semi starvation and refeeding. Am. J. Physiol. Endroc. Metabl. 2006;291:E23–27. doi: 10.1152/ajpendo.00523.2005. [DOI] [PMC free article] [PubMed] [Google Scholar]
- 15.Hall K, Jordan P. Modeling Weight Loss Maintenance To Help Prevent Body Weight Regain. Amer. J. Clin. Nutri. 2008 doi: 10.3945/ajcn.2008.26333. to appear. [DOI] [PubMed] [Google Scholar]
- 16.Harris J, Benedict F. A Biometric Study of Human Basal Metabolism. Proc Sci U S. 1918;4(12):370373. doi: 10.1073/pnas.4.12.370. [DOI] [PMC free article] [PubMed] [Google Scholar]
- 17.Heilbronn LK, Jonge L, Frisard MI, DeLany JP, Larson-Meyer DE, Rood J, Nguyen T, Martin CK, Volaufova J, Most MM, Greenway FL, Smith SR, Deutsch WA, Williamson DA, Ravussin E. Effect of 6-Month Calorie Restriction on Biomarkers of Longevity, Metabolic Adaptation, and Oxidative Stress in Overweight Individuals A Randomized Controlled Trial. JAMA. 2006;295(13):1539–1548. doi: 10.1001/jama.295.13.1539. [DOI] [PMC free article] [PubMed] [Google Scholar]
- 18.Hein M, Best LR, Pattison S, Arena S. Introduction to General, Organic, and Biochemistry. Sixth Edition Brooks/Cole; 1997. [Google Scholar]
- 19.Heymsfield SB, Harp JB, Reitman ML. Why do obese patients not lose more weight when treated with low calorie diets? A mechanistic perspective. Am. J. Clin. Nutr. 2007;85:346–54. doi: 10.1093/ajcn/85.2.346. [DOI] [PubMed] [Google Scholar]
- 20.Heymsfield SB, Smith R, Aulet M, Bensen B, Lichtman S, Wang J, Pierson RN., Jr Appendicular skeletal muscle mass: measurement by dual-photon absorptiometry. Am. J. Clin. Nutr. 1990;52:214–218. doi: 10.1093/ajcn/52.2.214. [DOI] [PubMed] [Google Scholar]
- 21.Hirsch, J. J. Cerebrum: The Dana Forum on Brain Science. Obesity: Matter over Mind? 2003;5(1):7–18. [Google Scholar]
- 22.Jequier E, Tappy, L. L. Regulation of Body Weight in Humans. Physiol. Rev. 1999;79:451–480. doi: 10.1152/physrev.1999.79.2.451. [DOI] [PubMed] [Google Scholar]
- 23.Kozusko FP. Body weight, setpoint, metaboic adaptation and human starvation. Bull. Math. Biol. 2001;63:393–403. doi: 10.1006/bulm.2001.0229. [DOI] [PubMed] [Google Scholar]
- 24.Kozusko F. The effects of body composition on set point based weight loss. Math and Comp. Modelling. 2002;29:1–7. [Google Scholar]
- 25.Leibel RL, Rosenbaum M, Hirsch M,J. Changes in energy expenditure resulting from altered body weight in man. New England J. of Med. 1995;332:621–627. doi: 10.1056/NEJM199503093321001. [DOI] [PubMed] [Google Scholar]
- 26.Nonexercise activity thermogenesis (NEAT): environment and biology. Am J Physiol Endocrinol Metab. 2004;286:E675E685. doi: 10.1152/ajpendo.00562.2003. [DOI] [PubMed] [Google Scholar]
- 27.Levine JA, Eberhardt NL, Jensen MD. Role of nonexercise activity thermogenesis in resistance to fat gain in humans. Science. 1999;283(5399):R212–214. doi: 10.1126/science.283.5399.212. [DOI] [PubMed] [Google Scholar]
- 28.Livingston E, Kohlstadt I. Simplified resting metabolic rate-predicting formulas for normalsized and obese individuals. Obesity Research. 2005;13(7):1255–1262. doi: 10.1038/oby.2005.149. [DOI] [PubMed] [Google Scholar]
- 29.Martin CK, Heilbronn LK, Jonge L. de , DelLany JP, Volaufova J, Anton SD, Redman LM, Smith SR, Ravussin E. Effect of Calorie Restriction on Resting Metabolic Rate and Spontaneous Physical Activity. Obesity. 2007;15(12):2965–2973. doi: 10.1038/oby.2007.354. [DOI] [PubMed] [Google Scholar]
- 30.Martin RH. Robert E. Krieger.; Melbourne, FL.: 1987. Nonlinear operators and differential equations in Banach spaces. [Google Scholar]
- 31.McArdle WD, Katch FI, Katch VL. Exercise Physiology: Energy, Nutrition, and Human Performance. 5th Edition Lippincott, Williams and Wilkins; 2001. [Google Scholar]
- 32.Newman C. Why are we so fat? J. National Geographic. 2004:46–61. [Google Scholar]
- 33.Poehlman ET. Reduced Metabolic Rate after Caloric Restriction-Can We Agree on How to Normalize the Data? J. of Clin. Endocrinology & Metabolism. 2003;88(1):14–15. doi: 10.1210/jc.2002-021672. [DOI] [PubMed] [Google Scholar]
- 34.Ravussin E, Lillioja S, Anderson TE, Christin L, Bogardus C. Determinants of 24-hour energy expenditure in man. Methods and results using a respiratory chamber. J. Clin. Invest. 1986;78:15681578. doi: 10.1172/JCI112749. [DOI] [PMC free article] [PubMed] [Google Scholar]
- 35.Redman LM, Heilbronn LK, Martin CK, Alfonso A, Smith SR, Ravussin E. Effect of Calorie Restriction with or without Exercise on Body Composition and Fat Distribution. J. of Clin. End. & Metab. 2007;92(3):865872. doi: 10.1210/jc.2006-2184. [DOI] [PMC free article] [PubMed] [Google Scholar]
- 36.Roozalia T, Rising. R, Brown D, Lifshitz F. Comparison of several equations and derivation of a new equation for calculating basal metabolic rate in obese children. J. Amer. Col. Nutr. 1998;4:333–336. doi: 10.1080/07315724.1998.10718771. [DOI] [PubMed] [Google Scholar]
- 37.Ross R, Dagnone D, Jones PJH, Smith H, Paddags A, Hudson R, Janssen I. Reduction in Obesity and Related Comorbid Conditions after Diet-Induced Weigbt Loss or Exercise-Induced Weight Loss in Men. Ann Intern Med. 2OOO;133:92–1O3. doi: 10.7326/0003-4819-133-2-200007180-00008. [DOI] [PubMed] [Google Scholar]
- 38.Rubner M. Die Vertretungswerthe der hauptsächlichsten organischen Nahrungsstoffe im. Thierkösrper. Zeitschrift fur Biologie. 1883;19:536562. [Google Scholar]
- 39.Sims EAH. Experimental obesity, dietary-induced thermogenesis and their clinical implications. Clin. in Endocr. and Metab. 1976;5:377395. doi: 10.1016/s0300-595x(76)80027-8. [DOI] [PubMed] [Google Scholar]
- 40.Thomas D, Clapp JF, Shernce S. A foetal energy balance equation based on maternal exercise and diet. J. Roy. Soc. Interface. 2008;5(21):449–455. doi: 10.1098/rsif.2007.1161. [DOI] [PMC free article] [PubMed] [Google Scholar]
- 41.Song B, Thomas DM. Dynamics of Starvation in Humans. J. of Math. Biol. 2007;54(1) doi: 10.1007/s00285-006-0037-7. [DOI] [PubMed] [Google Scholar]
- 42.Toubro S, Christensen NJ, Astrup A. Reproducibility of 24-h energy expenditure, substrate utilization and spontaneous physical activity in obesity measured in a respiration chamber. Int. J. Obes. Relat. Metab. Disord. 1995;19:544–49. [PubMed] [Google Scholar]
- 43.Tremblay A, Desprs JP, Thriault G, Fournier G, Bouchard C. Overfeeding and energy expenditure in humans. Am. J Clin. Nutr. 1992;56::857–62. doi: 10.1093/ajcn/56.5.857. [DOI] [PubMed] [Google Scholar]
- 44.Wang Z, Heshka S, Gallagher D, Boozer CN, Kotler DP, Heymsfield SB. Resting energy expenditure-fat-free mass relationship: new insights provided by body composition modeling. Am. J. Physiol. Endocrinol. Metab. 2000;279:539–45. doi: 10.1152/ajpendo.2000.279.3.E539. [DOI] [PubMed] [Google Scholar]
- 45.Webster JD, Garrow JS. Weight loss in 1 08 obese women on a diet supplying 800 kcal/d for 21 d. Am. J. Clin. Nutr. 1989;50:41–45. doi: 10.1093/ajcn/50.1.41. [DOI] [PubMed] [Google Scholar]
- 46.Westerterp KR. Diet induced thermogenesis. Nutrition and Metabolism. 2004:1–5. doi: 10.1186/1743-7075-1-5. [DOI] [PMC free article] [PubMed] [Google Scholar]
- 47.White CR, Seymour RS. Mammalian basal metabolic rate is proportional to body mass2/3. PNAS. 2003;100(7):40464049. doi: 10.1073/pnas.0436428100. [DOI] [PMC free article] [PubMed] [Google Scholar]
- 48.Obesity and Overweight Facts. WHO report; 2003. [Google Scholar]
- 49. (NIH Publication No. 03-4158).Statistics Related to Overweight and Obesity. [Google Scholar]
- 50.Data are for the U.S.,1999-2002. National Center for Health Statistics; Body Measurements. [Google Scholar]