

SUMMARY
Aflatoxin biosynthesis in Aspergillus parasiticus requires at least 17 enzyme activities (from acetate). Although the activities of most aflatoxin biosynthetic enzymes have been established, the mechanisms that govern transport and sub-cellular localization of these enzymes are not clear. We developed plasmid constructs that express Nor-1 fused to a green fluorescent protein reporter (EGFP) to monitor transport and localization of this early pathway enzyme in real time in Aspergillus parasiticus. Plasmids expressing EGFP fused to Nor-1 were introduced into A. parasiticus B62 (carries non-functional Nor-1). Transformants were screened for increased aflatoxin accumulation (restored Nor-1 activity) on coconut agar medium and for EGFP expression using fluorescence microscopy. Increased aflatoxin accumulation was confirmed by TLC and ELISA. Nor-1 fused to EGFP at either the N- or C- terminus functionally complemented non-functional Nor-1 in B62 and increased aflatoxin synthesis to wild-type (N-terminus) or lower levels (C-terminus). We detected full-length Nor-1 fusion proteins in transformants with increased aflatoxin accumulation (Western blot) and determined that the expression plasmid integrated at the nor-1 locus in these cells (Southern blot). Confocal laser scanning microscopy (CLSM) demonstrated that Nor-1 fusion proteins localized in the cytoplasm and vacuoles of fungal hyphae grown on aflatoxin-inducing solid media for 48 h; control EGFP (no Nor-1) did not localize to vacuoles until 72 h. The highest rate of aflatoxin synthesis coincided with the highest rate of transport of Nor-1 fusion proteins to the vacuole strongly suggesting that Nor-1 is synthesized in the cytoplasm and transported to the vacuole to carry out an early step in aflatoxin synthesis.
INTRODUCTION
Aflatoxins are biologically active secondary metabolites produced predominantly by Aspergillus parasiticus and A. flavus (Bhatnagar et al. 2003, Cotty et al. 1994) on economically important crops including peanuts, cottonseed, corn, and tree nuts (Ellis et al. 1991). Aflatoxin contamination in food and feed results in significant economic losses and human health risks in many regions of the world. Human exposure to aflatoxins occurs by ingestion of contaminated crops or products derived from animals given contaminated feed; exposure can lead to acute toxicity including hepatotoxicity, teratogenicity, immunotoxicity, and even death (Dvorackova 1990); aflatoxins are also among the most potent naturally occurring carcinogens known (Dvorackova 1990). Aflatoxin biosynthesis is a complex process that requires at least 17 enzyme activities (from acetate) (Dutton 1988; Trail et al. 1995; Yu et al. 2004). Although most aflatoxin enzyme activities have been identified, the mechanisms that govern transport and sub-cellular localization of these enzymes within a fungal cell are not completely understood. In a previous cell fractionation study conducted in our laboratory, Nor-1 was detected mainly in the cytoplasm and was associated with structures similar in size to ribosomes (Zhou 1997). In a separate study, we used immunogold labeling and transmission electron microscopy (TEM) analysis of Nor-1 in fungal colonies grown for 24–48 h on solid aflatoxin-inducing medium (Lee et al. 2004) to confirm the cytoplasmic location. In contrast to Nor-1, we demonstrated in this same study that the late aflatoxin enzyme OmtA (Lee et al. 2004) appears initially in the cytoplasm and then localizes to the vacuole at a time when maximum rates of aflatoxin accumulation are observed. Similar patterns of localization were observed for GFP fusions with the middle pathway enzyme Ver-1 (Hong and Linz 2008). These data prompted us to hypothesize that the early aflatoxin pathway steps occur predominantly in the cytoplasm while the middle and late conversions occur in the vacuole, possibly to protect cells from the toxic endproduct.
nor-1 encodes a 31 kDa NADPH-dependent ketoreductase which is involved in conversion of norsolorinic acid (NA) to averantin (AVN) (Zhou and Linz 1999). Early aflatoxin pathway intermediates including NA do not possess a bisfuran ring with a double bond; the presence of this double bond is strongly associated with DNA adduct formation, mutation, and cancer (Mori et al. 1985). To begin to test the hypothesis stated above and to conduct a more detailed analysis on synthesis and transport of Nor-1, we conducted confocal laser scanning microscopy (CLSM) on living fungal cells that express EGFP fused to Nor-1 to track transport and sub-cellular localization of Nor-1 in real time. Based on these analyses, we now propose that Nor-1 is synthesized in the cytoplasm and transported to vacuoles of fungal hyphae where it carries out an early step in aflatoxin synthesis.
EXPERIMENTAL/MATERIALS AND METHODS
Strains and culture conditions
A. parasiticus B62 (nor-1, niaD, br-1) was used as the recipient strain for plasmids (carry niaD selectable marker) that express EGFP fused to Nor-1. B62 was derived from A. parasiticus ATCC24690 (nor-1, br-1) by spontaneous mutation using potassium chlorate selection (Horng et al. 1990). A. parasiticus B3-15, in which EGFP expression is driven by the ver-1 promoter, was used as a control (expresses EGFP only) for time-course experiments (Hong and Linz 2008). A. parasiticus strains were cultured in YES liquid medium (2% yeast extract, 6% sucrose, pH 5.8) at 30°C in the dark with shaking at 150 rpm for genomic DNA isolation, total protein extraction, measurement of mycelial dry weight, and analysis of aflatoxin concentration as described previously (Liang et al. 1997). Czapek-Dox medium (CZ; Difco Laboratories, Detroit, MI) supplemented with 1% peptone was used to grow strain B62 for transformation. CZ agar supplemented with 20% sucrose was used as a selective medium to culture B62 transformants. Coconut agar medium (CAM) was used to screen for aflatoxin accumulation in B62 transformants (under UV at 365 nm) (Chang et al. 1992) and for EGFP expression by fluorescence microscopy (Hong and Linz 2008). We conducted CLSM analysis of fungal colonies grown on YES or YEP (2% yeast extract, 6% peptone, pH 5.8) agar blocks; this slide culture procedure was performed with minor modifications (Liang 1996) of the method of Harris (1986) as described previously (Hong and Linz 2008). Either potato dextrose agar (PDA; Difco Laboratories, Detroit, MI) or CZ agar was used for spore preparation (Skory et al. 1992).
Construction of plasmids expressing EGFP fused to Nor-1
Plasmids designed to express EGFP fused to Nor-1 (N- or C-terminus) (Fig. 1) were constructed using a nor-1 promoter/ORF (open reading frame) fragment or separate nor-1 promoter and ORF fragments, plus an egfp ORF fragment, a nor-1 terminator fragment, and pAPCGFPVFNB (AP = Aspergillus parasiticus; CGFPVF = fusion of GFP to C-terminus of Ver-1; NB = niaD selectable marker, B orientation) as a plasmid backbone (Hong and Linz 2008). To express Nor-1::EGFP (C-terminal fusion), a 2.4 kb nor-1 promoter/ORF fragment and a 1.8 kb nor-1 terminator fragment were generated by PCR with Pfu DNA polymerase (Stratagene, La Jolla, CA), appropriate primers, and cosmid NorA (Liang et al. 1996) as a template using standard procedures (Maniatis et al. 1989) (see Table 1 for all primer sequences). PCR was performed in a Gene Amp PCR System 2400 thermal cycler (Perkin-Elmer Life Sciences Inc., Boston, MA). The reaction conditions for thermal cycling depended on the primers and the target size: typical conditions were 94°C for 5 min followed by 25 cycles of denaturation at 94°C for 1 min, annealing for 1 min (see Table 1 for primer annealing temperatures), and extension at 72°C (time dependent on PCR fragment size: 2 min/kb). The reactions were completed with a final extension at 72°C for 10 min. The PCR fragment carrying the nor-1 promoter was digested with PacI and NotI and cloned into pAPCGFPVFNB (Hong and Linz 2008) cut with the same enzymes to generate pAPCGFPNVNB. A PCR fragment carrying the nor-1 terminator was digested with FseI and AscI and cloned into pAPCGFPNVNB cut with the same enzymes to generate pAPCGFPNFNB (CGFPNF = GFP fused to C-terminus of Nor-1) (Fig. 1).
FIG. 1.
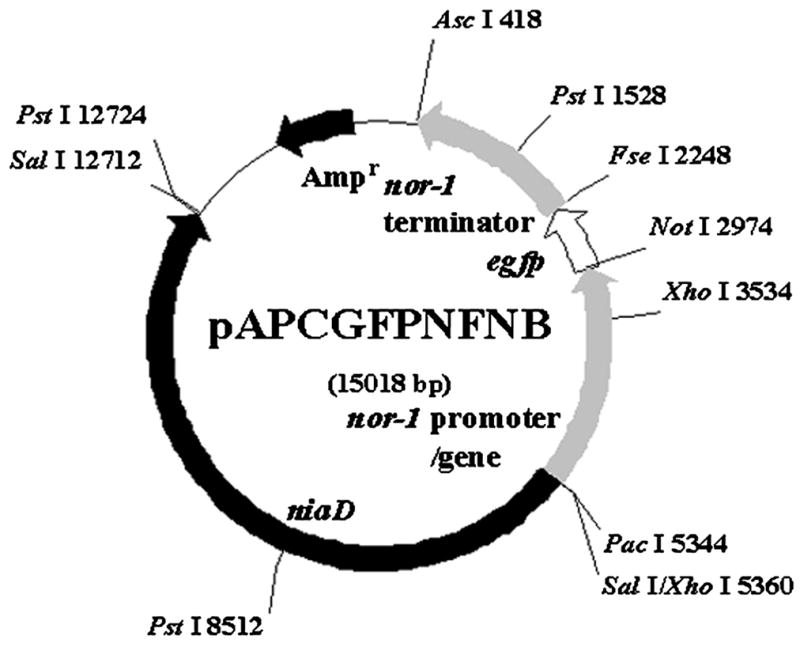
Restriction endonuclease map of plasmid pAPCGFPNFNB. The 2.4 kb nor-1 promoter/ORF was fused in frame to the 0.7 kb egfp coding region, followed by the 1.8 kb nor-1 terminator. The 7.4 kb niaD fragment was inserted as a selectable marker for transformation of the recipient strain B62 (niaD).
TABLE 1.
Primer sequences used in this study.
| Primera | Sequenceb | Restriction Enzyme Site |
Annealing Temp (°C) |
|---|---|---|---|
| nor-1 promoter/ORF (C)- F | 5′TCAGTCTTAATTAATTGTACAAA--GGCCTCCTA 3′ | PacI | 50 |
| nor-1 promoter/ORF (C)- R | 5′TTCGTCGCGGCCGCCAGCCACCC--AGGGGAGTTGAGA 3′ | NotI | 50 |
| nor-1 terminator- F | 5′CTCAACGGCCGGCCTAGGACTCC--AGTGACGACGAA 3′ | FseI | 55 |
| nor-1 terminator- R | 5′ACGGACGGCGCGCCCCTCGATGA--TGATGCTCT 3′ | AscI | 55 |
| egfp ORF (CL) - F | 5′AGTGCGGCCGCGGAGCTGGTGC--AGGCGCTGGAGCCATGGTGAGCA--AGGGCGAGGAGCTGTTC 3′ | NotI | 65 |
| egfp ORF (CL) - R | 5′GTCGGCCGGCCTTTACTTGTACA--GCTCGTCCAT 3′ | FseI | 65 |
| nor-1 promoter (N)- F | 5′TCAGTCTTAATTAATTGTACAAA--GGCCTCCTA 3′ | PacI | 50 |
| nor-1 promoter (N)- R | 5′CTAAGGCGGCCGCTCATTATGTC--ACGG 3′ | NotI | 50 |
| egfp ORF (N) - F | 5′CCGGGCGGCCGCATGGTGAGCA--AGGGCGAG 3′ | NotI | 60 |
| egfp ORF (N) - R | 5′GCCGCGATCGCCCTTGTACAGCT--CGTCCATGCC 3′ | sgfI | 60 |
| nor-1 ORF (N) - F | 5′GTGGCGATCGCGGTGCAGGCGCT--ATGAACGGATCACTTAGCCAGCAC3′ | sgfI | 60 |
| nor-1 ORF (N) - R | 5′GTCGGCCGGCCGCTACCAGGGG--AGTTGAGATCC 3′ | FseI | 60 |
| nor-1 promoter (PCR assay)- F | 5′ CAAAATTGACATGAGCAGATCT3′ | None | 60 |
| nor-1 terminator (PCR assay)- R | 5′ ACCGCGCCTTTCTGGACCA 3′ | None | 60 |
C represents C-terminal egfp fusion, CL represents C-terminal egfp fusion containing a long hinge region, and N represents N-terminal egfp fusion. Also, F represents forward primers and R represents reverse primers.
Underlined sequences show the position of the restriction enzyme sites.
We constructed plasmid pAPCGFPLNFNB (CGFPLNF = GFP fused to the C-terminus of Nor-1 via long hinge region) that contains a longer hinge region between the nor-1 ORF and the egfp ORF. The egfp ORF fragment in pAPCGFPNFNB was replaced with a modified egfp ORF fragment cut with NotI and FseI to provide additional amino acids between Nor-1 and EGFP to allow correct fusion protein folding (see hinge region sequence, Fig. 2).
FIG. 2.

Sequence comparison of the hinge region in plasmids carrying egfp fused to nor-1. (A) pAPCGFPNFNB. (B) pAPCGFPLNFNB. (C) pAPNGFPNFNB. These plasmids differ in the length of the hinge region between the nor-1 and egfp ORFs, and the location of the two regions.
To express EGFP::Nor-1 (N-terminal fusion), a 1.3 kb nor-1 promoter fragment and a 1.0 kb nor-1 ORF fragment were generated separately by PCR with Pfu DNA polymerase, appropriate primers, and cosmid NorA (Liang et al. 1996) as a template using standard procedures (Maniatis et al. 1989). The 0.7 kb egfp ORF fragment was generated by PCR with Pfu DNA polymerase and appropriate primers using pEGFP-N1 (Clonetech Laboratories, Palo Alto, CA) as a template. The PCR fragments were cloned into the SmaI site of pUC19, resulting in pUCGFP (egfp ORF), pUCNOR (nor-1 ORF), and pUCNORP (nor-1 promoter). The DNA fragment containing the nor-1 ORF was subcloned from pUCNOR into pUCGFP cut with SgfI and SalI, resulting in pUCGFPNOR. The DNA fragment containing the nor-1 promoter was then subcloned from pUCNORP into pUCGFPNOR cut with EcoRI and NotI, resulting in pUCNORPGFPNOR. Finally, DNA fragments containing the nor-1 promoter, the egfp ORF, and the nor-1 ORF were subcloned from pUCNORPGFPNOR into pAPCGFPNFNB cut with PacI and FseI, resulting in pAPNGFPNFNB (NGFPNF = GFP fused to N-terminus of Nor-1).
Transformation of A. parasiticus B62 with pAPCGFPNFNB, pAPCGFPLNFNB, or pAPNGFPNFNB was performed by a polyethylene glycol method (Oakley et al. 1987) with minor modifications as described previously (Skory et al. 1990).
Analysis of aflatoxin and pathway intermediate by TLC and ELISA
Aflatoxin and pathway intermediates were extracted from fungal mycelia by the method of Roze et al. (2004). TLC was conducted on cell extracts using a TEA solvent system (toluene-ethyl acetate-acetic acid; 50:30:4 [v/v/v]) (Chang et al. 2004). AFB1 concentration in cell extracts was determined by direct competitive enzyme-linked immunosorbent assay (ELISA) with AFB1 monoclonal antibodies (kindly provided by J. Pestka, Michigan State University) as described previously (Pestka 1988).
Western blot analysis of EGFP fused to Nor-1
Protein extracts were prepared for Western blot analysis as described previously (Hong and Linz 2008). Protein concentration in extracts was determined by a modified Bradford assay using a commercial Protein Assay reagent (Bio-Rad Laboratories, Hercules, CA) (Bradford 1976). Approximately 30–50 μg of total proteins were separated by 12% sodium dodecyl sulfate-polyacrylamide gel electrophoresis (SDS-PAGE). Immunodetection was carried out with IgG antibody against Nor-1 protein (Lee et al. 2004) or EGFP (Clonetech Laboratories, Palo Alto, CA) as a primary antibody, goat anti-rabbit IgG alkaline phosphatase conjugate (Sigma Chemical Co., St. Louis, MO) as a secondary antibody, and a BCIP/NBT (5′-bromo-4-chloro-3-indolyl phosphate/nitroblue tetrazolium) colorimetric detection system (Roche Molecular Biochemicals, Indianapolis, IND). A Benchmark pre-stained protein ladder (Invitrogen, Carlsbad, CA) was used as a molecular mass marker.
Southern hybridization and PCR analyses
Genomic DNA was isolated by a phenol-chloroform method (Ausubel et al. 2008) with minor modifications (Skory et al. 1990). Southern hybridization analyses were conducted using standard procedures (Maniatis et al. 1989). Approximately 10 μg of genomic DNA cut with SalI were separated by agarose gel electrophoresis and transferred onto a nylon membrane (Nytran supercharge membrane, Schleicher and Schell Inc., Keene, NH) by capillary action. Radio-labeled DNA probes were generated with [α-32P]dCTP (Perkin-Elmer life sciences Inc., Boston, MA), the Random Primer DNA Labeling System (Invitrogen, Carlsbad, CA), and the 0.7 kb egfp ORF fragment using a procedure provided by the manufacturer.
PCR analyses were performed with genomic DNA and primers specific to the nor-1 promoter or terminator (Table 1) to confirm plasmid integration sites and to determine if the fusion protein carried a functional Nor-1 protein. DNA sequence analysis of DNA fragments carrying nor-1 fused to egfp was conducted at the Research Technology Support Facility (RTSF) at Michigan State University.
Microscopy
For conventional fluorescence microscopy, coverslips from slide culture were washed three times with phosphate-buffered saline (PBS) and observed using a Nikon Labophot fluorescence microscope (Nikon Inc., Melville, NY) with a 450–490 nm excitation/520 nm emission filter. For CLSM, coverslips from slide culture were removed from YES or YEP agar blocks at appropriate time points after inoculation.
Fungal vacuoles were stained with FM 4–64 (membranes) or 7-amino-4-chloromethylcoumarin (CMAC; vacuolar lumen) (Ohneda et al. 2002; Shoji et al. 2006) as described previously (Hong and Linz 2008). Coverslips were observed using a Zeiss LSM 5 Pascal or Zeiss LSM 510 Meta CLSM (Carl Zeiss Inc., Germany). All single optical sections and extended focus images from Z-stacks (Z-section interval: 0.46 μm) were captured using a Zeiss Plan-APOCHROMAT (63×/1.40 Oil) objective. EGFP fluorescence (488 nm excitation/509 nm emission) was detected using a BP 505–530 emission filter set under excitation with the 488 nm argon-ion laser line. FM 4-64 fluorescence (558 nm excitation/734 nm emission) was detected using a LP 650 emission filter set under excitation with the 633 nm helium-neon laser line. CMAC fluorescence (353 nm excitation/466 nm emission) was detected using a BP 420–480 emission filter set under excitation with the 405 nm diode laser line. To quantify numbers of vacuoles carrying EGFP, large- and medium-sized vacuoles (>5μm) were counted in 2 or 3 hyphae from 1 microscopic field and this was repeated in a total 40 fields. The data were analyzed statistically by two-way ANOVA followed by Tukey’s test for multiple comparisons using SigmaStat (SPSS Inc., Chicago, IL). Statistical significance among samples was defined by a P value not greater than 0.05 (P≤0.05).
Time-course of aflatoxin accumulation
Conidia (2 × 10⁶) were cultured in 100 ml of YES at 30°C in the dark with shaking at 150 rpm as described previously (Liang et al. 1997). Flasks were removed at appropriate time points after inoculation for analyses of mycelial dry weight and aflatoxin concentration. Mycelia were harvested by filtration through Miracloth (Calbiochem, La Jolla, CA), frozen in liquid nitrogen, and stored at −80°C. Slide culture was performed as described above. Coverslips were removed at appropriate time points after inoculation for analysis of aflatoxin concentration.
Mycelial dry weight was determined after complete drying of the harvested mycelia at 100°C. For analysis of aflatoxin accumulation in slide culture, aflatoxins were extracted from agar blocks with 5 ml of chloroform and then 5 ml of acetone. These extracts were combined, dried by evaporation, and the pellet was dissolved in 1 ml of 70% methanol. AFB1 concentration in the filtrate and extract was determined by ELISA as described above.
RESULTS
Transformation of A. parasiticus B62 with expression plasmids and screening for aflatoxin and EGFP in transformants
Five to ten μg of pAPCGFPNFNB, pAPCGFPLNFNB, or pAPNGFPNFNB were transformed into 108 protoplasts of A. parasiticus B62 (nor-1, niaD, br-1) generating 877 transformants. B62, a leaky mutant derived from A. parasiticus SU-1 (wild type), accumulates small quantities of aflatoxin and large quantities of the early aflatoxin pathway intermediate norsolorinic acid (NA); B62 carries a mutation in nor-1 that generates a non-functional Nor-1 protein due to a specific amino acid substitution (see below). None of the 197 transformants carrying pAPCGFPNFNB demonstrated increased AFB1 accumulation compared to the recipient strain B62 (as measured by halo size on CAM). Seven of the 197 transformants (isolates N7, N31, N43, N51, N60, N70, and N128) appeared to express functional EGFP (EGFP [+]) based on fluorescence microscopy (data not shown).
We performed similar screening on all 300 transformants carrying pAPCGFPLNFNB. Only 1 transformant (isolate LN196) demonstrated increased AFB1 accumulation compared to B62. This transformant also accumulated less orange pigment than B62; this orange pigment was confirmed by NMR, TLC, and ELISA to contain predominantly norsolorinic acid (NA) (Lee et al. 1971; Reynolds and Pestka 1991; Trail et al. 1994). All 300 transformants were then screened for EGFP expression under the fluorescence microscope. Isolate LN196 appeared to express EGFP (EGFP [+]). Forty-seven other transformants were EGFP (+) but did not accumulate increased levels of AFB1.
We conducted similar analysis on 380 transformants carrying pAPNGFPNFNB. Forty-four transformants accumulated increased quantities of AFB1 compared to B62. Forty-two out of these 44 transformants also did not accumulate NA; the other 2 isolates (NN182 and NN227) did accumulate reduced quantities of NA compared to B62. All 380 transformants were then screened for EGFP expression by fluorescence microscopy. All 44 transformants including isolates NN4, NN6, and NN24, which accumulated increased levels of AFB1, were EGFP (+).
TLC and ELISA analyses of transformants
To confirm complementation of non-functional Nor-1 in A. parasiticus B62 by Nor-1 fusion proteins, we performed TLC and ELISA analyses on chloroform/acetone extracts from transformants. Isolate LN196 (carries pAPCGFPLNFNB) produced 20 fold more AFB1 than the recipient strain B62 (Fig. S1B) but still accumulated lower but detectable levels of NA (Fig. S1A). Isolates NN4, NN6, and NN24 (carry pAPNGFPLNFNB) produced similar amounts of AFB1 as SU-1 (Fig. 3A) (approximately 300 fold greater quantities than B62) while NN182 and NN227 accumulated about 50% of the AFB1 accumulated by SU-1 (Fig. 3B) (approximately 150 fold greater quantities than B62). All 6 of these isolates accumulated detectable but reduced quantities of NA as compared to B62. These data suggest that transformants carrying pAPNGFPNFNB express an EGFP::Nor-1 fusion that functionally complements non-functional Nor-1 in A. parasiticus B62.
FIG. 3.

TLC and ELISA analyses of extracts from transformants carrying pAPNGFPNFNB and the recipient strain B62. (A) TLC analysis of fungal cell extracts. Lanes: 1, B62 (recipient strain); 2, NN182 (increased AFB1, EGFP [+]); 3, NN227 (increased AFB1, EGFP [+]); 4, NN4 (increased AFB1, EGFP [+]); 5, NN6 (increased AFB1, EGFP [+]); and 6, NN24 transformants (increased AFB1, EGFP [+]); A, aflatoxin B1, B2, G1, and G2 standard mixture. N, norsolorinic acid (NA) standard. TEA (toluene-ethyl acetate-acetic acid; 50:30:4 [v/v/v]) was used as a solvent system. Fluorescence was detected under UV light at 365 nm. (B) ELISA analysis of fungal cell extracts from transformants carrying pAPNGFPNFNB. Extracts include (from left to right): SU-1 (wild type); B62 (recipient), NN1 (EGFP [−]), NN145 (EGFP [+]), NN182 (increased AFB1, EGFP [+]), NN227 (increased AFB1, EGFP [+]), NN4 (increased AFB1, EGFP [+]), NN6 (increased AFB1, EGFP [+]), and NN24 (increased AFB1, EGFP [+]).
Western blot analysis of EGFP fused to Nor-1
We performed Western blot analysis on transformed cells grown in liquid YES for 48 h using anti-Nor-1 antibody or anti-EGFP antibody (Fig. 4A and B) to confirm that transformants expressed full-length EGFP::Nor-1 fusion proteins. A 58 kDa fusion protein was detected in isolates NN182, NN227, NN4, NN6, and NN24 (carry pAPNGFPNFNB) with either antibody; this represents the expected mass of full-length fusion protein (Nor-1, 31 kDa; EGFP, 27 kDa) (Fig. 4A and B). Anti-Nor-1 antibodies also detected a 31 kDa Nor-1 protein in strain SU-1, B62, and all transformants. There was no observable degradation of either the Nor-1 fusion proteins or native Nor-1 at any time point analyzed. These data suggest that full-length Nor-1 fusion protein is produced in isolates NN182, NN227, NN4, NN6, and NN24 and that this protein is not subject to turnover during the 72 h growth period.
FIG. 4.

Western blot analysis Nor-1 fusion proteins in transformants carrying pAPNGFPNFNB, the recipient strain B62, and the wild-type strain SU-1. Transformants, strain B62, and strain SU-1 were grown in 100 ml of YES for 48 h at 30 °C with shaking at 150 rpm. Approximately 30–50 μg of proteins were separated by 12% SDS-PAGE, transferred onto PVDF membranes, and probed with Nor-1 or EGFP polyclonal antibody. (A) Nor-1 antibody detection. Lanes: 1, SU-1 (wild-type); 2, B62 (recipient strain); 3, NN182 (increased AFB1, EGFP [+]); 4, NN227 (increased AFB1, EGFP [+]); 5, NN4 (increased AFB1, EGFP [+]); 6, NN6 (increased AFB1, EGFP [+]); and 7, NN24 (increased AFB1, EGFP [+]); M, molecular mass marker. EGFP fused to Nor-1 has a molecular mass of 58 kDa, and the 31 kDa protein represents native Nor-1. (B) EGFP antibody detection. Lanes: 1, SU-1 (wild-type); 2, B62 (recipient strain); 3, NN182 (increased AFB1, EGFP [+]); 4, NN227 (increased AFB1, EGFP [+]); 5, NN4 (increased AFB1, EGFP [+]); 6, NN6 (increased AFB1, EGFP [+]); 7, NN24 (increased AFB1, EGFP [+]); and 8, rEGFP. Recombinant EGFP (rEGFP) was used as a positive control and, the 30 kDa rEGFP contains a 27 kDa EGFP fused to a 3 kDa protein for affinity chromatography purification.
Similar analysis was conducted on isolate LN196 carrying pAPCGFPLNFNB; this transformant produced a 58 kDa fusion protein detectable with both anti-Nor-1 (Fig. S2) and anti-EGFP (data not shown). In contrast, isolate LN2 did not accumulate increased AFB1, did not express EGFP, and did not produce the 58 kDa fusion protein (Fig. S2).
Do Nor-1 fusion proteins carry wild-type Nor-1 protein?
We determined if the Nor-1 fusion protein expressed in transformants was responsible for complementation of non-functional Nor-1 in B62. The recipient strain B62 produces a non-functional Nor-1; we did not know the site of the mutation (Bennett and Goldblatt, 1973; Lee et al. 1971). To determine the mutation site in nor-1 in B62, we cloned non-functional nor-1 from B62 by PCR and analyzed the nucleotide sequence of the PCR products. A single point mutation (T → C) was identified at nucleotide residue 790 in nor-1 in B62 that resulted in a leucine to proline substitution. Transformants could theoretically produce fusion proteins carrying either a wild-type Nor-1 or non-functional Nor-1 depending on the site of plasmid integration into the chromosome (Fig. 5). To determine if the Nor-1 fusion protein carried a functional Nor-1 protein (wild type), we performed PCR with an egfp, nor-1 promoter primer pair or egfp, nor-1 terminator primer pair (Table 1) and conducted DNA sequence analysis on the DNA fragments. Isolates NN182, NN227, NN4, NN6, NN24, and LN196 carried wild-type nor-1 in the Nor-1 fusion protein (data not shown).
FIG. 5.

Schematic for integration of pAPCGFPLNFNB into the nor-1 locus. (A) nor-1 locus. (B) Plasmid integration upstream of the point mutation in nor-1. (C). Plasmid integration downstream of the point mutation in nor-1. (D) 3′ nor-1 integration (nor-1 terminator). Integration of pAPCGFPLNFNB upstream of the point mutation in nor-1 or into 3′ nor-1 results in production of an Nor-1::EGFP fusion carrying functional Nor-1 protein. Integration of the plasmid downstream of the point mutation in nor-1 results in production of an Nor-1::EGFP fusion carrying non-functional Nor-1 protein. However, a functional Nor-1 protein is produced by the recombinant nor-1 gene adjacent to the nor-1 fusion gene. M, point mutation. Abbreviations for the DNA fragments are as follows; nor-1 p, nor-1 promoter; nor-1 t, nor-1 terminator.
Analysis of integration sites of pAPCGFPLNFNB and pAPNGFPNFNB in the chromosome
Southern hybridization analysis was performed on transformants carrying pAPCGFPLNFNB or pAPNGFPNFNB. Plasmid pAPCGFPLNFNB could theoretically integrate by homologous recombination at one or more of three sites: (1) niaD; (2) 3′ nor-1 terminator; (3) 5′ nor-1 promoter/ORF (open reading frame) region (Fig. 5). For plasmid pAPNGFPNFNB integration could occur at (1) niaD (2) 3′ nor-1/ORF or (3) 5′ nor-1. Southern hybridization and PCR analyses confirmed that pAPNGFPNFNB integrated at the 3′ nor-1 terminator/ORF region in isolates NN182, NN227, NN4, NN6, and NN24 (increased AFB1, EGFP [+]). In isolates NN182 and NN4, a second copy of the plasmid integrated at the niaD locus by single-crossover (Fig. 6 and Fig. S4). The analyses also showed that in isolate NN244 (EGFP [−]), a single plasmid integrated at the niaD locus by single-crossover (Fig. 6). We also conducted Southern hybridization analysis on isolate LN196 (increased AFB1, EGFP [+]). The analysis confirmed that the plasmid integrated at each of the three locations including 3′and 5′ nor-1 and niaD (Fig. S3 and Fig. S4).
FIG. 6.

Southern hybridization analysis of plasmid integration sites in transformants carrying pAPNGFPNFNB. Genomic DNA was isolated from A. parasitisus, digested with SalI, and hybridized with an egfp gene probe. Lanes: 1, B62 (recipient strain); 2, NN1 (EGFP [−]); 3, NN145 (EGFP [+]); 4, NN183 (EGFP [+]); 5, NN244 (EGFP [−]); 6, NN182 (increased AFB1, EGFP [+]); 7, NN227 (increased AFB1, EGFP [+]); 8, NN4 (increased AFB1, EGFP [+]); 9, NN6 (increased AFB1, EGFP [+]); and 10, NN24 (increased AFB1, EGFP [+]). 3′ nor-1/ORF region integrants resulted in a 13.3 kb DNA fragment, 5′ nor-1 integrants resulted in a 9.1 kb DNA fragment, and niaD integrants resulted in a 15.9 kb DNA fragment.
Confocal Laser Scanning Microscopy (CLSM)
We analyzed the sub-cellular location of Nor-1 fusion proteins in isolates LN196 (C-terminal fusion) and NN6 (N-terminal fusion) by CLSM after 24, 48, and 72 h culture on a solid aflatoxin-inducing medium (YES; slide culture) (Fig. 7). B3-15 and B62 were also analyzed as controls. EGFP fluorescence was not detected at any time point in the recipient strain B62 (Fig. 7A and data not shown). EGFP fluorescence was not detected in B3-15, LN196, or NN6 at 24 h (Fig. 7B and data not shown). However, Nor-1 fusion proteins localized in the cytoplasm of NN6 and LN196 at 48 h (Fig. 7C and data not shown) and EGFP localized in the cytoplasm of B3-15 in agreement with previous work. Of particular significance, the Nor-1 fusion protein localized to the lumen of 75% of the vacuoles in LN196 and NN6 at 48 h (Fig. 7C to F). The identity of the vacuoles was confirmed with the vacuolar membrane dye FM 4-64 and the vacuolar lumen dye CMAC (Fig. 7). FM 4-64 stains endosomal compartments like endosomes as well as vacuoles in Saccharomyces cerevisiae (Vida and Emr 1995). The vacuolar lumen-specific dye CMAC is enzymatically converted to a blue fluorescent derivative in the vacuolar lumen (Shoji et al. 2006). NN6 did not produce any EGFP fluorescence when it was cultured on non-aflatoxin-inducing media (YEP) (Fig. 7H). These data were consistent with previous observations that peptone as a sole carbon source does not support aflatoxin gene expression and aflatoxin accumulation (Buchanan and Lewis 1984; Skory et al. 1993); these data also suggest that expression of the fusion protein was under regulation of the nor-1 promoter.
Fig. 7.

Sub-cellular localization of EGFP fused to Nor-1 in transformants NN6 and LN196. Fungal vacuoles were stained with 8 μM FM 4-64 or 10 μM CMAC and observed using a Zeiss LSM 5 Pascal or Zeiss LSM 510 Meta confocal laser scanning microscope (CLSM) after 24, 48, and 72 h incubation at 30°C on aflatoxin-inducing media (YES) or non-aflatoxin-inducing media (YEP) agar blocks (slide culture). (A) The recipient strain B62 (negative control) stained with CMAC at 48 h on YES. Blue fluorescent vacuoles were observed in hyphae but green fluorescence was not detected. (B) NN6 stained with FM 4-64 at 24 h on YES. Red fluorescent vacuolar membranes were observed in hyphae but green fluorescence was not detected. (C) and (D) NN6 stained with FM 4-64 at 48 h on YES. The EGFP::Nor-1 fusion localized in red fluorescent vacuoles and the cytoplasm. An extended focus image was captured from Z-stacks (Z-section interval: 0.46 μm) in panel D. (E) and (F) LN196 stained with CMAC at 48 h on YES. The Nor-1::EGFP fusion localized in vacuoles. (G) NN6 stained with FM 4-64 at 72 h on YES. The EGFP::Nor-1 fusion localized in vacuoles. (H) NN6 stained with FM 4-64 at 72 h on YEP. Red fluorescent vacuolar membranes were observed in hyphae. Each panel shows a red fluorescence image (FM 4-64) or a blue fluorescence image (CMAC) (top left), a green fluorescence image (EGFP) (top right), a transmitted image (bright field or differential interference contrast [DIC]) (bottom left), and a merged image (bottom right) except for panel (D) in which only a merged image is shown and for panel (C) in which only red and green fluorescence images are shown. Scale bars, 10 μm.
In a previous study, we reported that EGFP localizes in the cytoplasm of strain B3-15 at 48 h but localizes in vacuoles at 72 h (Hong and Linz 2008) (in B3-15, EGFP is fused directly to the Ver-1 promoter and does not include any amino acids in the Ver-1 ORF). Therefore, the timing of vacuolar localization of EGFP in B3-15 was compared with that of the Nor-1 fusion protein in NN6. The total number of green fluorescent vacuoles was analyzed at 48 and 72 h. Pairwise multiple comparisons confirmed that the level of vacuolar localization of green fluorescence in B3-15 at 48 h (7%) was significantly less than in NN6 at 48 h (75%) (P<0.05) (Table 2). However, at 72 h, there was no significant difference in the level of vacuolar localization in NN6 (83%) and B3-15 (83%).
TABLE 2.
Comparison of vacuolar localization of EGFP in transformant B3-15 with that of EGFP::Nor-1 in transformant NN6
% = # of green fluorescent vacuoles/# of large- and mid-size of vacuoles (> 5 μm) in 40 microscopic fields (2–3 hyphae per field)
Time-course of AFB1 accumulation
Isolates NN6 and B3-15 were cultured in YES liquid media and on YES agar blocks (slide culture). AFB1 accumulation in these transformants was analyzed after 24, 48, and 72 h incubation. Dry weights of these fungal isolates were similar at each time point in liquid culture suggesting that they grew at similar rates under the experimental conditions (Fig. 8A). A transition from active growth to stationary phase was observed between 48 and 72 h in liquid culture as described previously (Chiou et al. 2002; Liang et al. 1997). AFB1 was not detected in the transformants at 24 h, but high levels of AFB1 were detected between 24 and 48 h in both liquid and slide culture as reported previously (Fig. 8A and B) (Chiou et al. 2002; Liang et al. 1997). Very little additional aflatoxin accumulation was observed between 48 and 72 h. These data strongly suggested that the highest rate of aflatoxin synthesis coincided with highest rate of transport of Nor-1 fusion proteins to the vacuole. Therefore, we propose that localization of Nor-1 to the vacuole is associated with aflatoxin biosynthesis and not with aflatoxin protein turnover. In contrast, control EGFP expressed in B3-15 localized to the vacuole after rates of aflatoxin synthesis declined suggesting that EGFP is either stored or turned over in that organelle.
Fig. 8.

AFB1 accumulation in transformant NN6 (EGFP::Nor-1) and transformant B3-15 (EGFP only). (A) AFB1 was measured after 24, 48, and 72 h incubation at 30oC with shaking at 150 rpm in YES medium. (B) AFB1 was measured after 24, 48, and 72 h incubation at 30°C on YES agar.
DISCUSSION
Our data strongly suggest that the early aflatoxin pathway enzyme Nor-1 is synthesized in the cytoplasm and then is transported to vacuoles. The highest rate of Nor-1 transport to vacuoles occurs at a time when maximum rates of aflatoxin accumulation are observed. Based on these observations, we hypothesize that the vacuole is the primary site of aflatoxin synthesis and that Nor-1 participates in the synthesis at that location. We did not detect any degradation of Nor-1 or Nor-1 fusion protein by Western blot analysis from 24 to 48 h suggesting that recycling of these proteins did not occur during aflatoxin synthesis. Because we previously demonstrated vacuolar localization of OmtA (Lee et al. 2004) and Ver-1 (Hong and Linz 2008), we now hypothesize that most, if not all, aflatoxin synthesis occurs within the vacuole.
Fusion of EGFP to either the N- or C-terminus of Nor-1 resulted in complementation of non-functional Nor-1 in the recipient strain B62. However, complementation of non-functional Nor-1 occurred in only one of nearly 500 transformants carrying plasmids expressing C-terminal fusions and three copies of the expression vector were present in this strain (LN196). In contrast, the quantity of Nor-1 enzyme activity was much greater with N-terminal fusions (7 to 15 fold higher as measured by the quantity of AFB1 accumulated) despite the fact that only a single copy of the expression vector was detected in these transformants. Similarly, increasing the length of the hinge region did not appear to generate any significant improvement in the number of transformants with increased ability to accumulate AFB1; however, the longer hinge region did markedly increase the number of EGFP(+) transformants with plasmids expressing C-terminal fusions. Western blot analysis demonstrated that the absolute quantity of Nor-1 fusion protein was similar in these two classes of transformants (short and long hinge regions). Together, these observations suggest that fusion of EGFP at the C-terminus of Nor-1 blocks some critical function of this enzyme but does not affect the activity of EGFP carried in the same protein molecule. nor-1 encodes an NADPH-dependent ketoreductase (Zhou and Linz 1999) and we previously observed an amino acid motif (Gly-X-Gly-X-X-Leu) similar to the conserved NADP binding motif (Gly-X-Gly-X-X-Ala) starting at Gly, (amino acid residue 35) and another amino acid motif (Tyr-Gly-Val-Ser-Lys-Leu-Ala-Ala-Asn-Tyr-Met) found in the family of short-chain alcohol dehydrogenases starting at Tyr (amino acid residue 291) (Trail et al. 1994). We speculate that C-terminal fusion of EGFP may interfere with the function of one or both of these domains in Nor-1, resulting in a large decrease in Nor-1 activity.
We confirmed that the early aflatoxin pathway enzyme Nor-1 localized in the cytoplasm and, contrary to our hypothesis, in the vacuolar lumen in A. parasiticus grown on a solid aflatoxin-inducing medium at 48 h. This result also is in contrast to previous observations, in which Nor-1 was primarily observed in the cytoplasm at 24– 48 h using transmission electron microscopy (TEM) after immunogold labeling (Lee et al. 2004) and cell fractionation (Zhou 1997). One possible explanation for this discrepancy is that we used live samples in real time in this study instead of fixed samples in the previous study. Alternatively, the acidic pH (pH 5–6) of vacuoles may have negatively affected binding of Nor-1 antibody to Nor-1 localized in vacuoles in the previous study. Also, grinding of mycelia under liquid nitrogen for cell fractionation may have disrupted intact vacuoles in the cell fractionation study.
Supplementary Material
FIG. S1. TLC and ELISA analyses of extracts from transformants carrying pAPCGFPLNFNB and the recipient strain B62. (A) TLC analysis of fungal cell extracts. Lanes: 1, B62 (recipient strain); 2, LN2 (EGFP [−]); 3, LN1 (EGFP [+]); 4, LN6 (EGFP [+]); and 5, LN196 (increased AFB1, EGFP [+]). A, aflatoxin B1, B2, G1, and G2 standard mixture. N, norsolorinic acid (NA) standard. TEA (toluene-ethyl acetate-acetic acid; 50:30:4 [v/v/v]) was used as a solvent system. Fluorescence was detected under UV at 365 nm. (B) ELISA analysis of fungal cell extracts from transformants carrying pAPCGFPLNFNB. Cell extracts include (from left to right) SU-1, B62, LN2 (EGFP [−]), LN1 (EGFP [+]), LN6 (EGFP [+]), and LN196 (increased AFB1, EGFP [+]).
FIG. S2. Western blot analysis Nor-1::EGFP in transformants carrying pAPCGFPLNFNB, the recipient strain B62, and the wild-type strain SU-1. Fungal proteins were extracted from transformants, B62, and SU-1 grown in 100 ml of YES for 48 h at 30 °C with shaking at 150 rpm. Approximately 30–50 μg of proteins were separated by 12% SDS-PAGE, transferred onto PVDF membranes, and probed with Nor-1 polyclonal antibody. Lanes: 1, SU-1 (wild-type); 2, B62 (recipient strain); 3, LN2 (EGFP [−]); 4, LN1 (EGFP [+]); 5, LN6 (EGFP [+]); and 6, LN196 (increased AFB1, EGFP [+]). M, molecular mass marker. Nor-1::EGFP fusion has a molecular mass of 58 kDa, and the 31 kDa protein represents native Nor-1.
FIG. S3. Southern hybridization analysis of plasmid integration in transformants carrying pAPCGFPLNFNB. Genomic DNA was isolated from A. parasitisus, digested with SalI, and hybridized with an egfp gene probe. Lanes: 1 LN2 (EGFP [−]); 2, LN1 (EGFP [+]); 3, LN6 (EGFP [+]); 4, LN196 (increased AFB1, EGFP [+]); and 5, B62 (recipient strain). 3′ nor-1 integrants resulted in a 13.3 kb fragment, 5′ nor-1/ORF region integrants resulted in a 9.1 kb fragment, and niaD integrants resulted in a 15.9 kb fragment.
Fig. S4. Schematic for Southern hybridization analysis of integration sites of pAPNGFPNFNB into the chromosome. (A) nor-1 locus. (B) 3′nor-1/ORF region integration. (C) 5′ nor-1 integration. (D) niaD locus. (E) niaD integration. Restriction endonucleases; S = SalI, Xh = XhoI. egfp was used as a probe.
Acknowledgments
This work was supported by the National Institutes of Health Grant CA52003-17 and the Michigan Agricultural Experiment Station. We thank Dr. Melinda K. Frame (Center for Advanced Microscopy at Michigan State University) for help in confocal laser scanning microscopy and Dr. Stephen A. Osmani (Ohio State University) for providing a repeated Gly-Ala sequence for the hinge region in EGFP fused to Nor-1.
Footnotes
Publisher's Disclaimer: This is a PDF file of an unedited manuscript that has been accepted for publication. As a service to our customers we are providing this early version of the manuscript. The manuscript will undergo copyediting, typesetting, and review of the resulting proof before it is published in its final citable form. Please note that during the production process errors may be discovered which could affect the content, and all legal disclaimers that apply to the journal pertain.
References
- Ausubel FM, Brent R, Kingston RE, Moore DD, Seidman JG, Smith JA, Struhl K. Current Protocols in Molecular Biology. John Wiley and Sons; New York: 2008. [Google Scholar]
- Bennett JW, Goldblatt LA. Isolation of mutants of Aspergillus flavus and Aspergillus parasiticus with altered aflatoxin producing ability. Sabouraudia. 1973;11:235–241. [PubMed] [Google Scholar]
- Bhatnagar D, Ehrlich KC, Cleveland TE. Molecular genetic analysis and regulation of aflatoxin biosynthesis. Appl Microbiol Biotechnol. 2003;61:83–93. doi: 10.1007/s00253-002-1199-x. [DOI] [PubMed] [Google Scholar]
- Bradford MM. A rapid and sensitive method for the quantitation of microgram quantities of protein utilizing the principle of protein-dye binding. Anal Biochem. 1976;72:248–254. doi: 10.1016/0003-2697(76)90527-3. [DOI] [PubMed] [Google Scholar]
- Buchanan RL, Lewis DF. Regulation of aflatoxin biosynthesis: effect of glucose on activities of various glycolytic enzymes. Appl Environ Microbiol. 1984;48:306–310. doi: 10.1128/aem.48.2.306-310.1984. [DOI] [PMC free article] [PubMed] [Google Scholar]
- Chang PK, Skory CD, Linz JE. Cloning of a gene associated with aflatoxin B1 biosynthesis in Aspergillus parasiticus. Curr Genet. 1992;21:231–233. doi: 10.1007/BF00336846. [DOI] [PubMed] [Google Scholar]
- Chang PK, Yabe K, Yu J. The Aspergillus parasiticus estA-encoded esterase converts versiconal hemiacetal acetate to versiconal and versiconol acetate to versiconol in aflatoxin biosynthesis. Appl Environ Microbiol. 2004;70:3593–3599. doi: 10.1128/AEM.70.6.3593-3599.2004. [DOI] [PMC free article] [PubMed] [Google Scholar]
- Chiou CH, Miller M, Wilson DL, Trail F, Linz JE. Chromosomal location plays a role in regulation of aflatoxin gene expression in Aspergillus parasiticus. Appl Environ Microbiol. 2002;68:306–315. doi: 10.1128/AEM.68.1.306-315.2002. [DOI] [PMC free article] [PubMed] [Google Scholar]
- Cotty PJ, Bayman P, Egel DS, Elias DS. Agriculture, aflatoxins, and Aspergillus. In: Powell KA, Fenwick A, Peberdy JF, editors. The genus Aspergillus. Plenum Press; New York, NY: 1994. pp. 1–27. [Google Scholar]
- Dutton MF. Enzymes and aflatoxin biosynthesis. Microbiol Rev. 1988;52:274–295. doi: 10.1128/mr.52.2.274-295.1988. [DOI] [PMC free article] [PubMed] [Google Scholar]
- Dvorackova I. Aflatoxins and human health. CRC Press; Boca Raton, FL: 1990. [Google Scholar]
- Ellis WO, Smith JP, Simpson BK, Oldham JH. Aflatoxins in food: occurrence, biosynthesis, effects on organisms, detection, and methods of control. Crit Rev Food Sci Nutr. 1991;30:403–439. doi: 10.1080/10408399109527551. [DOI] [PubMed] [Google Scholar]
- Harris JL. Modified method for fungal slide culture. J Clin Microbiol. 1986;24:460–461. doi: 10.1128/jcm.24.3.460-461.1986. [DOI] [PMC free article] [PubMed] [Google Scholar]
- Hong SY, Linz JE. Functional expression and subcellular localization of the aflatoxin enzyme Ver-1 fused to enhanced green fluorescent protein. Appl Environ Microbiol. 2008 doi: 10.1128/AEM.01185-08. (in press) [DOI] [PMC free article] [PubMed] [Google Scholar]
- Horng JS, Chang PK, Pestka JJ, Linz JE. Development of a homologous transformation system for Aspergillus parasiticus with the gene encoding nitrate reductase. Mol Gen Genet. 1990;224:294–296. doi: 10.1007/BF00271564. [DOI] [PubMed] [Google Scholar]
- Lee L, Bennett JW, Goldblatt LA, Lundin RE. Norsolorinic acid from a mutant strain of Aspergillus parasiticus. J Am Oil Chem Soc. 1971;48:93–94. doi: 10.1007/BF02635696. [DOI] [PubMed] [Google Scholar]
- Lee LW, Chiou CH, Klomparens KL, Cary JW, Linz JE. Subcellular localization of aflatoxin biosynthetic enzymes Nor-1, Ver-1, and OmtA in time-dependent fractionated colonies of Aspergillus parasiticus. Arch Microbiol. 2004;181:204–214. doi: 10.1007/s00203-003-0643-3. [DOI] [PubMed] [Google Scholar]
- Liang SH. PhD Dissertation. Michigan State University; 1996. The function and expression of the ver-1 gene and localization of the Ver-1 protein involved in aflatoxin biosynthesis in Aspergillus parasiticus. [Google Scholar]
- Liang SH, Skory CD, Linz JE. Characterization of the function of the ver-1A and ver-1B genes, involved in aflatoxin biosynthesis in Aspergillus parasiticus. Appl Environ Microbiol. 1996;62:4568–4575. doi: 10.1128/aem.62.12.4568-4575.1996. [DOI] [PMC free article] [PubMed] [Google Scholar]
- Liang SH, Wu TS, Lee R, Chu FS, Linz JE. Analysis of mechanisms regulating expression of the ver-1 gene, involved in aflatoxin biosynthesis. Appl Environ Microbiol. 1997;63:1058–1065. doi: 10.1128/aem.63.3.1058-1065.1997. [DOI] [PMC free article] [PubMed] [Google Scholar]
- Maniatis T, Fritsch EF, Sambrook J. Molecular Cloning: a Laboratory Manual. Cold Spring Harbor Laboratory; Cold Spring Harbor, New York: 1989. [Google Scholar]
- Mori H, Kitamura J, Sugie S, Kawai K, Hamasaki T. Genotoxicity of fungal metabolites related to aflatoxin B1 biosynthesis. Mutat Res. 1985;143:121–125. doi: 10.1016/s0165-7992(85)80021-x. [DOI] [PubMed] [Google Scholar]
- Oakley BR, Rinehart JE, Mitchell BL, Oakley CE, Carmona C, Gray GL, May GS. Cloning, mapping and molecular analysis of the pyrG (orotidine-5′-phosphate decarboxylase) gene of Aspergillus nidulans. Gene. 1987;61:385–399. doi: 10.1016/0378-1119(87)90201-0. [DOI] [PubMed] [Google Scholar]
- Ohneda M, Arioka M, Nakajima H, Kitamoto K. Visualization of vacuoles in Aspergillus oryzae by expression of CPY-EGFP. Fungal Genet Biol. 2002;37:29–38. doi: 10.1016/s1087-1845(02)00033-6. [DOI] [PubMed] [Google Scholar]
- Pestka JJ. Enhanced surveillance of foodborne mycotoxins by immunochemical assay. J Assoc Off Anal Chem. 1988;71:1075–1081. [PubMed] [Google Scholar]
- Reynolds G, Pestka JJ. Enzyme-linked immunosorbent assay of versicolorin A and related aflatoxin biosynthetic precursors. J Food Prot. 1991;54:105–108. doi: 10.4315/0362-028X-54.2.105. [DOI] [PubMed] [Google Scholar]
- Roze LV, Beaudry RM, Keller NP, Linz JE. Regulation of aflatoxin synthesis by FadA/cAMP/protein kinase A signaling in Aspergillus parasiticus. Mycopathologia. 2004;158:219–232. doi: 10.1023/b:myco.0000041841.71648.6e. [DOI] [PubMed] [Google Scholar]
- Shoji JY, Arioka M, Kitamoto K. Vacuolar membrane dynamics in the filamentous fungus Aspergillus oryzae. Eukaryot Cell. 2006;5:411–421. doi: 10.1128/EC.5.2.411-421.2006. [DOI] [PMC free article] [PubMed] [Google Scholar]
- Skory CD, Chang PK, Cary J, Linz JE. Isolation and characterization of a gene from Aspergillus parasiticus associated with the conversion of versicolorin A to sterigmatocystin in aflatoxin biosynthesis. Appl Environ Microbiol. 1992;58:3527–3537. doi: 10.1128/aem.58.11.3527-3537.1992. [DOI] [PMC free article] [PubMed] [Google Scholar]
- Skory CD, Chang PK, Linz JE. Regulated expression of the nor-1 and ver-1 genes associated with aflatoxin biosynthesis. Appl Environ Microbiol. 1993;59:1642–1646. doi: 10.1128/aem.59.5.1642-1646.1993. [DOI] [PMC free article] [PubMed] [Google Scholar]
- Skory CD, Horng JS, Pestka JJ, Linz JE. Transformation of Aspergillus parasiticus with a homologous gene (pyrG) involved in pyrimidine biosynthesis. Appl Environ Microbiol. 1990;56:3315–3320. doi: 10.1128/aem.56.11.3315-3320.1990. [DOI] [PMC free article] [PubMed] [Google Scholar]
- Trail F, Chang PK, Cary J, Linz JE. Structural and functional analysis of the nor-1 gene involved in the biosynthesis of aflatoxins by Aspergillus parasiticus. Appl Environ Microbiol. 1994;60:4078–4085. doi: 10.1128/aem.60.11.4078-4085.1994. [DOI] [PMC free article] [PubMed] [Google Scholar]
- Trail F, Mahanti N, Rarick M, Mehigh R, Liang SH, Zhou R, Linz JE. Physical and transcriptional map of an aflatoxin gene cluster in Aspergillus parasiticus and functional disruption of a gene involved early in the aflatoxin pathway. Appl Environ Microbiol. 1995;61:2665–2673. doi: 10.1128/aem.61.7.2665-2673.1995. [DOI] [PMC free article] [PubMed] [Google Scholar]
- Vida TA, Emr SD. A new vital stain for visualizing vacuolar membrane dynamics and endocytosis in yeast. J Cell Biol. 1995;128:779–792. doi: 10.1083/jcb.128.5.779. [DOI] [PMC free article] [PubMed] [Google Scholar]
- Yu J, Chang PK, Ehrlich KC, Cary JW, Bhatnagar D, Cleveland TE, Payne GA, Linz JE, Woloshuk CP, Bennett JW. Clustered pathway genes in aflatoxin biosynthesis. Appl Environ Microbiol. 2004;70:1253–1262. doi: 10.1128/AEM.70.3.1253-1262.2004. [DOI] [PMC free article] [PubMed] [Google Scholar]
- Zhou R. PhD Dissertation. Michigan State University; 1997. The function, accumulation, and localization of the Nor-1 protein involved in aflatoxin biosynthesis; the function of the fluP gene associated with sporulation in Aspergillus parasiticus. [Google Scholar]
- Zhou R, Linz JE. Enzymatic function of the Nor-1 protein in aflatoxin biosynthesis in Aspergillus parasiticus. Appl Environ Microbiol. 1999;65:5639–5641. doi: 10.1128/aem.65.12.5639-5641.1999. [DOI] [PMC free article] [PubMed] [Google Scholar]
Associated Data
This section collects any data citations, data availability statements, or supplementary materials included in this article.
Supplementary Materials
FIG. S1. TLC and ELISA analyses of extracts from transformants carrying pAPCGFPLNFNB and the recipient strain B62. (A) TLC analysis of fungal cell extracts. Lanes: 1, B62 (recipient strain); 2, LN2 (EGFP [−]); 3, LN1 (EGFP [+]); 4, LN6 (EGFP [+]); and 5, LN196 (increased AFB1, EGFP [+]). A, aflatoxin B1, B2, G1, and G2 standard mixture. N, norsolorinic acid (NA) standard. TEA (toluene-ethyl acetate-acetic acid; 50:30:4 [v/v/v]) was used as a solvent system. Fluorescence was detected under UV at 365 nm. (B) ELISA analysis of fungal cell extracts from transformants carrying pAPCGFPLNFNB. Cell extracts include (from left to right) SU-1, B62, LN2 (EGFP [−]), LN1 (EGFP [+]), LN6 (EGFP [+]), and LN196 (increased AFB1, EGFP [+]).
FIG. S2. Western blot analysis Nor-1::EGFP in transformants carrying pAPCGFPLNFNB, the recipient strain B62, and the wild-type strain SU-1. Fungal proteins were extracted from transformants, B62, and SU-1 grown in 100 ml of YES for 48 h at 30 °C with shaking at 150 rpm. Approximately 30–50 μg of proteins were separated by 12% SDS-PAGE, transferred onto PVDF membranes, and probed with Nor-1 polyclonal antibody. Lanes: 1, SU-1 (wild-type); 2, B62 (recipient strain); 3, LN2 (EGFP [−]); 4, LN1 (EGFP [+]); 5, LN6 (EGFP [+]); and 6, LN196 (increased AFB1, EGFP [+]). M, molecular mass marker. Nor-1::EGFP fusion has a molecular mass of 58 kDa, and the 31 kDa protein represents native Nor-1.
FIG. S3. Southern hybridization analysis of plasmid integration in transformants carrying pAPCGFPLNFNB. Genomic DNA was isolated from A. parasitisus, digested with SalI, and hybridized with an egfp gene probe. Lanes: 1 LN2 (EGFP [−]); 2, LN1 (EGFP [+]); 3, LN6 (EGFP [+]); 4, LN196 (increased AFB1, EGFP [+]); and 5, B62 (recipient strain). 3′ nor-1 integrants resulted in a 13.3 kb fragment, 5′ nor-1/ORF region integrants resulted in a 9.1 kb fragment, and niaD integrants resulted in a 15.9 kb fragment.
Fig. S4. Schematic for Southern hybridization analysis of integration sites of pAPNGFPNFNB into the chromosome. (A) nor-1 locus. (B) 3′nor-1/ORF region integration. (C) 5′ nor-1 integration. (D) niaD locus. (E) niaD integration. Restriction endonucleases; S = SalI, Xh = XhoI. egfp was used as a probe.