Abstract
The 3T3-L1 murine cell line is a robust and widely used model for the study of adipogenesis and processes occurring in mature adipocytes. The fibroblastic like cells can be induced by hormones to differentiate into mature adipocytes. In this study, the metabolic phenotype associated with differentiation of the 3T3-L1 cell line has been studied using gas chromatography-mass spectrometry, 1H nuclear magnetic resonance spectroscopy, liquid chromatography-mass spectrometry, direct infusion-mass spectrometry, and 13C substrate labeling in conjunction with multivariate statistics. The changes in metabolite concentrations at distinct periods during differentiation have been defined including alterations in the TCA cycle, glycolysis, the production of odd chain fatty acids by α-oxidation, fatty acid synthesis, fatty acid desaturation, polyamine biosynthesis, and trans-esterification to produce complex lipids. The metabolic changes induced during differentiation of the 3T3-L1 cell line were then compared with the metabolic differences between pre- and postdifferentiation primary adipocytes. These metabolic alterations reflect the changing role of the 3T3-L1 cells during differentiation, as well as possibly providing metabolic triggers to stimulate the processes which occur during differentiation.
Keywords: metabolomics, fatty acid α-oxidation, metabonomics, systems biology
the 3t3-l1 murine cell line was developed by Green and Kehinde (7, 8) and is a derivative of the 3T3 mouse fibroblast cell line. It has become a well-established and widely used model for the study of the biochemical processes undergone during mammalian adipogenesis. In the preconfluent state 3T3-L1 cells morphologically and biochemically resemble fibroblasts (9, 10). However, once the cells reach 100% confluence they can be differentiated into mature adipocytes by initial treatment with insulin, which activates the IGF-I receptor, dexamethasone, a synthetic glucocorticoid, and 1-methyl-3-isobutylxanthine, a cyclic nucleotide phosphodiesterase inhibitor increasing cAMP and cGMP, activating cyclic nucleotide-dependent protein kinases (21). The process is robust and relatively uniform with 70–90% of cells differentiating and mirroring reactions to lipogenic/lytic hormones, morphological changes, and metabolic processes observed during mammalian adipocyte development (20).
A recent resurgence in the use of the 3T3-L1 adipose differentiation model has accompanied the development of the global “obesity crisis.” The adipocyte is not merely a lipid depository but a key metabolic regulator responsible for the production of cytokines, metabolic substrates, and adipokines, wielding influence over metabolism both locally and on a systemic level. Therefore, research has concentrated on the deregulation of metabolism within adipose tissue that may contribute to the wider effects of Type 2 diabetes mellitus, the metabolic syndrome, and obesity (12, 13, 27).
The differentiation of preadipocyte cells into mature adipocytes requires a complex interaction of metabolic pathways that as yet remain to be fully defined. A diverse range of pathways have been implicated as vital to the differentiation process including polyamine biosynthesis (1), essential fatty acid pathways (24), eicosanoid biosynthesis (16), fatty acid desaturation (3), as well as fatty acid synthesis (25) and the TCA cycle (14). Many of these pathways may be critical to differentiation at specific points during the process, either being perturbed by a process associated with differentiation or alternatively providing metabolic cues to induce other processes. In this study, the metabolic changes associated with adipocyte differentiation of the 3T3-L1 cell line have been studied using combined gas chromatography-mass spectrometry (GC-MS), 1H nuclear magnetic resonance (NMR) spectroscopy, liquid chromatography-mass spectrometry (LC-MS), direct infusion-mass spectrometry (DI-MS), and 13C substrate labeling detected by heteronuclear single quantum coherence (HSQC) NMR and GC-MS in conjunction with multivariate statistics. The metabolic changes identified were then compared and contrasted to the metabolic differences between pre- and postdifferentiation primary adipocytes observed using GC-MS and LC-MS. This has defined the metabolic phenotype of differentiating 3T3-L1 preadipocytes as they mature into adipocyte cells.
MATERIALS AND METHODS
Cell culture.
3T3-L1 preadipocytes were grown in T75 flasks and maintained in Dulbecco's modified Eagle's medium (DMEM) (high glucose 4.5 g/l; Sigma-Aldrich) supplemented with 10% (vol/vol) new born calf serum (Sigma-Aldrich), 50 units/ml penicillin, and 50 μg/ml streptomycin (Sigma-Aldrich) in a humidified 5% CO2 incubator at 37°C. The T75 flasks were assigned to groups of three flasks each corresponding to 0, 2, 4, 8, 16, 24, 72, 120, and 216 h time points during the differentiation process. At 2 days postconfluent cells were induced to differentiate with DMEM supplemented with 10% vol/vol fetal bovine serum (FBS, Invitrogen), 1 μM dexamethasone (Sigma-Aldrich), 0.5 mM isobutylmethylxanthine (Sigma-Aldrich), 100 nM insulin (Sigma-Aldrich), 50 units/ml penicillin, and 50 μg/ml streptomycin. The cells were maintained in this medium for 72 h as this was found to improve the reproducibility of differentiation between flasks. After 72 h the medium was replaced with DMEM supplemented with 10% FBS, 100 nM insulin, 50 units/ml penicillin, and 50 μg/ml streptomycin. The medium was subsequently changed for DMEM supplemented with 10% FBS, 50 units/ml penicillin, and 50 μg/ml streptomycin every 48 h.
Oil red O staining and intracytoplasmic lipid accumulation.
Cell cultures were washed with PBS and fixed overnight with 10% formalin in PBS at 4°C. The cultures were then incubated for 1 h with 0.3% oil red O (Sigma-Aldrich) in 60% isopropanol at room temperature and washed with PBS. Digital images of the cells were taken with a Nikon D100 camera. The stain was extracted from the cells with 60% isopropyl alcohol for 1 h (10 ml/flask) and 1 ml measured at 510 nm in a spectrophotometer.
Cell collection.
Cells were collected and metabolites extracted at 0, 2, 4, 8, 16, 24, 72, 120, and 216 h time points following the initiation of differentiation. Cells were collected by removing the media and washing each T75 flask with 10 ml of PBS. Cells were then washed with 1.5 ml trypsin-EDTA solution (5 BAEE units trypsin/ml, 1.8 μg EDTA/ml; Sigma-Aldrich) for 2 min at 37°C to remove the cells from the surface of the flask. 8.5 ml DMEM supplemented with 10% (vol/vol) newborn calf serum, 50 units/ml penicillin, and 50 μg/ml streptomycin was added to each flask. The DMEM containing the cells was transferred to a falcon tube and centrifuged at 200 g for 2 min to pellet the cells. The remaining medium was removed, and the cells were washed with physiological saline (0.9% NaCl) solution.
Metabolite extraction.
Metabolites were extracted from 3T3-L1 cells by a modified Bligh and Dyer method (2). Methanol-chloroform (2:1 600 μl) was added to 5 mg cell pellets, and the samples were sonicated for 15 min. Chloroform-water (1:1) was then added (200 μl of each). Samples were centrifuged (16.1 g, 20 min), and the organic and aqueous phases were separated and stored at −80°C until analysis. Of these fractions, 100 μl of the organic phase was used for LC-MS, and the remaining organic phase was used for GC-MS. Prior to analysis the organic fractions were dried in a fume hood. For the aqueous phase, 100 μl of the aqueous phase was taken for GC-MS analysis, and the remaining aqueous phase sample was used for 1H NMR spectroscopy. Prior to further analysis the aqueous fractions were dried in an evacuated centrifuge (Eppendorf, Hamburg, Germany).
GC-MS analysis.
Dried aqueous-phase samples were derivatized by adding 30 μl of methoxyamine hydrochloride solution (20 mg/ml in pyridine, Sigma-Aldrich), vortex mixed for 1 min, and then incubated at 25°C for 17 h. Samples were silylated with 30 μl of N-methyl-N-trimethylsilyltrifluoroacetamide (MSTFA; Macherey-Nagel, Germany) for 1 h at 25°C (9).
Acid-catalyzed methyl esterification was used to derivatize the organic phase samples for total fatty acid content. Chloroform-methanol (1:1, 0.25 ml) and BF3-methanol (10%; 0.125 ml) were added to the organic phase and incubated at 90°C for 90 min. Water (0.15 ml; mQ) and hexane (0.3 ml) were added, and the samples were vortex mixed for 1 min and left to form a bilayer. The aqueous phase was discarded, and the organic layer evaporated to dryness prior to reconstitution in analytical grade hexane (200 μl) before GC-MS analysis.
All GC-MS analyses were made using a Trace GC Ultra coupled to a Trace DSQ II single-quadrupole mass spectrometer (Thermo Scientific, Cheshire, UK). Derivatized aqueous samples were injected with a split ratio of 25 onto a 30 m × 0.25 mm 5% phenylpolysilphenylene-siloxane column with a 0.25 μm ZB-5 ms stationary phase (Phenomenex). The injector temperature was 230°C, and the helium carrier gas was used at a flow rate of 1.2 ml/min. The initial column temperature of 70°C was increased by 10°C/min to 130°C and then increased at a rate of 5°C/min to 230°C followed by an increase of 20°C/min to 310°C and held for 5 min [transfer line temperature = 250°C; ion source = 250°C; electron ionization (EI) = 70 eV]. The detector was turned on after 240 s, and full-scan spectra were collected using 3 scans/s over a range of 50–650 m/z.
The derivatized organic samples were injected with a split ratio of 25 onto a 30 m × 0.25 mm 70% cyanopropyl polysilphenylene-siloxane 0.25 μm TR-fatty acid methyl ester (FAME) stationary phase column (Thermo Electron). The injector temperature and the helium carrier gas flow rate were as above. The column temperature was 60°C for 2 min, increased by 15°C/min to 150°C, and then increased at a rate of 4°C/min to 230°C (transfer line = 240°C; ion source = 250°C, EI = 70 eV). The detector was set as above for the ZB-5 ms column.
GC-MS chromatograms were processed using Xcaliber (version 2.0; Thermo Electron). Each individual peak was integrated and then normalized. Overlapping peaks were separated using traces of single ions. Peak assignment was based on mass fragmentation patterns matched to the National Institute of Standards and Technology (NIST) library, previously reported literature, and a FAME standard mix (Supelco 37 Component FAME Mix; Sigma-Aldrich).
1H-NMR spectroscopy.
Dried extracts were dissolved in 600 μl of D2O and buffered in 200 mM disodium phosphate, 40 mM monosodium phosphate (pH 7.4) containing 1 mM sodium-3-(trimethylsilyl)-2,2,3,3-tetradeuteriopropionate (TSP; Cambridge Isotope Laboratories, Andover, MA) and 0.02 M sodium azide. Samples were analyzed using a DRX Avance II+ spectrometer interfaced to a 5-mm TXI ATMA probe (Bruker BioSpin, Rheinstetten, Germany) at a proton frequency of 500.13 MHz. A presaturation pulse sequence for water suppression based on the first increment of a nuclear Overhauser-effect spectroscopy pulse sequence was used to saturate the residual water proton signal (relaxation delay = 2 s, t1 = 4 μs, mixing time = 50 ms, presaturation applied during the relaxation time and mixing time). We collected 256 transients into 64k data points over a spectral width of 8,000 Hz at 300K. NMR spectra were processed in ACD 1D NMR Manager (version 8; Advanced Chemistry Development Inc, Toronto, Canada), multiplied by an exponential weighting function of 1 Hz, Fourier transformed, phased, baseline corrected, and referenced to TSP at 0.0 ppm. The NMR spectra were integrated using 0.04-ppm integral regions between 0.2 and 9.56 ppm (excluding water resonance between 4.20 and 5.08 ppm). Spectra were normalized to total integrated area to account for differences in concentration between samples and assigned by comparison with previous literature and Chenomx NMR suite 5.0 libraries.
DI-MS.
Mass spectrometric analysis was performed using a Thermo Finnigan LTQ equipped with a Finnigan Surveyor pump and Finnigan Micro AS Autosampler.
The organic-phase samples for DI-MS were reconstituted in 500 μl methanol-tetrahydrofuran (2:1 vol/vol). We added 100 μl of each sample to a 96-well plate. Samples were analyzed in duplicate in both positive and negative mode. The sample was introduced via infusion at 10 μl/min and ionized in a standard electrospray source with sheath gas flow of 12 units, auxiliary gas flow of 1 unit, and sweep gas flow of 1 unit, capillary temperature of 290°C, and spray voltage of 5 kV. The capillary and tube lens voltages for positive mode analysis were set to 40 and 80 V, respectively. In negative mode the capillary voltage was −50 V; the tube lens voltage was set to −200 V. The scan range was set at 100–1,100 m/z in profile. DI-MS chromatograms were processed using Xcaliber (version 2.0; Thermo Electron). The mass data were summed from the chromatogram for the period of sample injection, and the exact masses were exported; the data points were summed between M and M+1, normalized to total metabolite concentration, and integrated. Tandem mass spectrometry (MS/MS) data were collected using a flow rate of 15 μl/min and a collision energy of 35 V; all other parameters were as above.
UPLC-MS analysis.
Chromatography was performed using an ACQUITY UPLC system (Waters, Centennial Park, Elstree, Hertfordshire, UK) equipped with an Acquity UPLC 1.7 μm Bridged Ethyl Hybrid (BEH) C8 column (2.1 × 100 mm Waters) that was kept at 65°C and coupled to a Micromass QTof-Ultima with a Z-spray electrospray source. The electrospray source was operated in positive ion mode with the source temperature set at 100°C and a cone gas flow of 50 l/h. The desolvation gas temperature was 300°C, and the nebulizer gas flow rate was set at 600 l/h. The capillary voltage was 3 kV, and the cone voltage was 50 V. The binary solvent system used was solvent A: HPLC-grade water (chromosolv plus Sigma-Aldrich), 1% 1 M ammonium acetate (NH4Ac, Fluka), 0.1% formic acid (Fluka), and solvent B: analytical-grade acetonitrile (chromosolv Sigma-Aldrich)/isopropanol (Fisher Scientific) 5:2, 1% 1 M NH4Ac, 0.1% formic acid (19). The temperature of the sample organizer was set at 4°C. Mass spectrometric data were collected in full scan mode from 100–1,500 m/z from 0–14 min with a scan duration of 0.5 s and an interscan delay of 0.1 s.
Organic-phase metabolites were reconstituted in methanol-chloroform (2:1, 1 ml). Aliquots of diluted organic phase sample (5 μl) were injected onto the C8 column. The column mobile phase was held at 50% solvent B for 0.5 min followed by an increase from 50 to 100% solvent B over 0.5–6.5 min. The mobile phase was then held at 100% B for 3.5 min. Between 10 and 10.25 min the mobile phase was returned to 50% B held for 3.75 min to re-equilibrate the column. The total UPLC cycle was 14 min. The eluent flow rate was 600 μl/min.
MS/MS was used for the identification of selected lipids. MS/MS runs were performed using ESI+ mode and collision energies of 16, 20, 25, 30, 35, and 40 V and a mass range of 100–1,500 m/z. Other conditions were as described above.
Data were processed using Micromass MarkerLynx Applications Manager (Waters). Each peak was detected, noise-reduced, and integrated. The ion intensities for each peak were detected and normalized. Lipids were identified using tandem mass spectrometry data.
Multivariate analysis.
Multivariate data analysis was performed using SIMCA-P+ 11.0 (Umetrics, Umeå, Sweden). NMR, DI-MS, and UPLC-MS data sets were mean-centered and Pareto-scaled prior to analysis. Pareto scaling involves weighting each of the variables by the square root of that variable's variance and increasing the importance of low-concentration metabolites while still minimizing the impact of noise in the subsequent analysis. GC-MS data sets were scaled to unit variance (UV) as only manually fitted peaks were analyzed. UV scaling weights each of the variables by the variable's group standard deviation and therefore does not bias models toward large-concentration metabolites. Data sets were analyzed using principal component analysis (PCA), partial least squares (PLS), and partial least squares discriminant analysis (PLS-DA). Metabolite changes responsible for clustering or regression trends within the pattern recognition models were identified by interrogating the corresponding loadings plot. Metabolites identified in the VIP/coefficients plots were deemed to have changed globally if they contributed to separation in the models with a confidence limit of 95% or greater as determined by a jack-knifing routine within the SIMCA package.
13C glucose substrate labeling study.
At 2 days postdifferentiation medium was removed from the T75 flasks and replaced with DMEM [10% (vol/vol) fetal bovine serum, 50 units/ml penicillin, 50 μg/ml streptomycin], and either 4.5 g/l 12C unlabeled glucose (n = 6) or 4.5 g/l 1-13C-glucose (n = 7).
After 2 days cells were collected and metabolites were extracted as previously described. Dried organic-phase extracts were dissolved in 600 μl of deuterated chloroform. Samples were analyzed using a DRX Avance II+ spectrometer interfaced to a 5-mm TXI ATMA probe.
GC-MS analysis of organic and aqueous phases was also carried out as previously described. Enrichment of metabolites was identified by calculating isotope ratios.
Preparation of 13C and 12C labeled palmitate solution.
We heated 75 ml of PBS to 37°C. Bovine serum albumin (20 g) was added to the PBS. Separately deionized water (15 ml), 95% ethanol solution (10 ml), and Na2CO3 (0.106 g) were mixed under nitrogen. Either unenriched palmitate (0.2115 g) or U-13C labeled palmitate (0.2247 g) was added and then heated to ∼78°C to evaporate the ethanol. The fatty acid solution was added to the albumin solution and well mixed. The palmitate-albumin mixture was dialyzed (Spectra/Por dialysis tubing; molecular weight cut-off 6,000–8,000) in deionized water at 4°C overnight.
13C palmitate substrate labeling study.
At 2 days postdifferentiation medium was removed from the T75 flasks and replaced with DMEM (serum-free, 50 units/ml penicillin, and 50 μg/ml streptomycin) and either 70 μM unenriched palmitate (n = 6) or 70 μM U-13C labeled palmitate (n = 6).
GC-MS analysis of organic and aqueous phases was also carried out as previously described. Enrichment of metabolites was identified by calculating isotope ratios of the M and M+1 ions for the parent ion of the fragmentation pattern.
RESULTS
3T3-L1 cell line.
High-resolution 1H-NMR spectroscopy, GC-MS, LC-MS, and DI-MS analysis, combined with multivariate pattern recognition, were used to profile metabolism within differentiating 3T3-L1 murine cells. The combination of these analytical tools was used to maximize the coverage of the metabolome within the cells. High resolution 1H-NMR spectroscopy detected 25 identifiable metabolites. GC-MS detected 100–150 defined peaks from aqueous-phase samples and 60–70 defined peaks from organic-phase samples. Matching the mass spectra detected with those held in the NIST library identified 60% of metabolites for aqueous extracts and 65% for lipids. Of the species detected using DI-MS negative mode ionization that contribute to separation in the multivariate models 40% (∼150) were identified both in terms of lipid class and their fatty acyl moieties. Of the species detected using LC-MS that contribute to separation in the multivariate models 60% were identified using MS/MS.
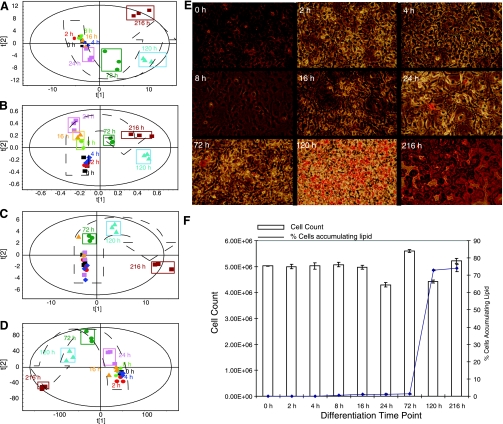
Across all multivariate models used to examine the individual spectra/chromatograms a similar trend in the separation of time points was detected whereby the earliest time points showed only subtle variation before diverging steadily up to 24 h. This trend for the first 24 h was along principal component (PC) 2, which represents the second highest amount of correlated variation detected in the dataset. Significant separation then occurs for the latter time points (24–120 h) along PC 1, which represents the highest amount of correlated variation detected in the dataset. By 216 h clustering along component 2 has returned to a position similar to the earliest time points; however, separation along component 1 remained altered (Fig. 1, A–D).
Fig. 1.
A: partial least squares (PLS) scores plot showing clustering of aqueous phase metabolites analyzed by gas chromatography-mass spectrometry (GC-MS) extracted from 3T3-L1 cells at 0, 2, 4, 8, 16, 24, 72, 120, and 216 h time points during the differentiation process. (R2 = 0.63, Q2 = 0.97). The PLS model was formed by cross correlating the metabolic profile (x-variables) against the time of differentiation (y-variable). B: PLS scores plot showing clustering of aqueous-phase metabolites analyzed by 1H-NMR extracted from 3T3-L1 cells at 0, 2, 4, 8, 16, 24, 72, 120, and 216 h time points during the differentiation process. (R2 = 0.99, Q2 = 0.97). The PLS model was formed by regressing against time. C: PLS scores plot showing clustering of organic-phase metabolites analyzed by GC-MS extracted from 3T3-L1 cells at 0, 2, 4, 8, 16, 24, 72, 120, and 216 h time points during the differentiation process. (R2 = 0.99, Q2 = 0.98). The PLS model was formed by regressing against time. D: principal component analysis (PCA) scores plot showing clustering of metabolites analyzed by liquid chromatography-mass spectrometry (LC-MS) extracted from 3T3-L1 cells at 0, 2, 4, 8, 16, 24, 72, 120, and 216 h time points during the differentiation process. (R2 = 0.73, Q2 = 0.61). E: oil red O-stained images of differentiating 3T3-L1 adipocytes at time points 0–216 h. F: graph showing cell counts and the percentage of differentiating cells at time points 0–216 h.
3T3-L1 preadipocyte differentiation and intracytoplasmic lipid accumulation.
Oil red O-stained images of the differentiating cells demonstrated that the cells maintained a fibroblastic like morphology for the early time points. By 16 h a number of cells had altered their morphology to a more rounded phenotype. By 120 h the cells were beginning to resemble adipocytes and accumulate lipid as indicated by the stain. The staining for the final time point showed mature 3T3-L1 cells with a rounded morphology and lipid-containing vesicles; 75% of the total number of cells differentiated. Spectrophotometric measurement at 510 nm of the eluted oil red O from the stained cells confirmed that the cells had begun to accumulate lipid by 120 h and had significantly differentiated by 216 h (Fig. 1, E and F).
Total fatty acid metabolism.
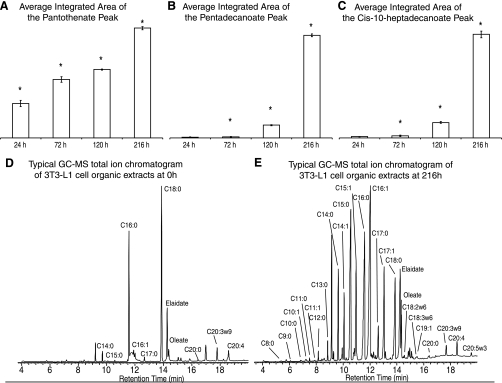
The total fatty acid concentrations were measured using GC-MS analysis of their methyl esterified derivatives from the organic phase of the cell extracts. Between 24 and 72 h, the even chained fatty acids (C8:0, 10:0, 12:0, 14:0) and the Δ9 desaturase products C14:1, C16:1, and C18:1 increased in concentration as detected by their contribution to PC 2 of the PCA model used to analyze the FAME dataset. In addition pantothenate, a key constituent of co-enzyme A, was detected at 72 h (Fig. 2A) and was accompanied by a decrease in the concentration of acetate, which is in part produced from the β-oxidation product acetyl-CoA. Also increased in concentration was carnitine, a key metabolite involved in fatty acid transport across the membrane of several cellular organelles. Accumulation of even chained fatty acids continued 72–120 h (C8:0, C10:0, C14:0) as detected in the loading coefficients for PC 1. In addition this increase was accompanied by an increase in odd chain fatty acids (C9:0, C11:0, C13:0, C15:0, C17:0) (Fig. 2B). The increase in the concentration of these odd chain fatty acids also pre-empted an increase in the concentration of their desaturation products (C11:1, C15:1, C17:1, C19:1) (Fig. 2C). Pantothenate and carnitine concentrations continued to increase up to 216 h, while acetate concentrations decreased by 120 h. At 216 h a decrease in the concentration of all omega-6 fatty acid pathway intermediates and a decrease in the end products of the omega-3 pathway (5,8,11,14,17–20:5 and 4,7,10,13,16,19–22:6) were detected. At this time point there was also a continued increase in the even chain fatty acids (C8:0, 10:0, 12:0 14:0), their monounsaturated products, and palmitoleate, accompanied by continued increase in odd chain fatty acids (C9:0, 11:0, 13:0, 15:0 and 17:0) and monounsaturated odd chain fatty acids (C11:1, 15:1, 17:1). The concentration of larger chain fatty acids decreased (20:0, 24:0, 24:1) across the time course. The concentration of palmitate increases between 16–24 h before decreasing, alongside stearate, for the remainder of the differentiation process (Fig. 2, D and E). Accompanying the changes observed in the concentrations of the essential fatty acid pathway intermediates, the concentration of arachidonic acid esterified to phospholipids increased at 24 h and again at the 216 h time point.
Fig. 2.
A: bar graph showing the average integrated area of the pantothenate peak at 24, 72, 120, and 216 h time points as measured by 1H-NMR spectroscopy. Standard error bars are shown. *P < 0.05 calculated between adjacent time points. B: graph showing the average integrated area of the pentadecanoate peak (C15:0) peak at 24, 72, 120, and 216 h time points as measured by GC-MS of fatty acid methyl esters (FAMEs). Standard error bars are shown. *P < 0.05 calculated between adjacent time points. C: bar graph showing the average integrated area of the cis-10-heptadecanoate peak at 24, 72, 120, and 216 h time points. Standard error bars are shown. *P < 0.05 calculated between adjacent time points. D: a typical GC-MS total ion chromatogram (TIC) from the analysis of methyl esterification-derivatized 3T3-L1 cell organic extracts from the 0 h time point. Metabolites are identified from exact retention times and comparison of corresponding mass spectrum with the National Institute of Standards and Technology (NIST) database and a FAME standard mix. E: a typical GC-MS TIC from the analysis of methyl esterification-derivatized 3T3-L1 cell organic extracts from the 216 h time point. Metabolites are identified from exact retention times and comparison of corresponding mass spectrum with the NIST database and a FAME standard mix.
Carbohydrate metabolism.
Concentrations of glycolytic and TCA cycle intermediates were measured using 1H-NMR and GC-MS analysis of their methoximated and silylated derivatives from the aqueous phase of the cell metabolite extraction. During the first 4 h of differentiation a number of TCA cycle intermediates increased in concentration including succinate, fumarate, and malate. For the first 2 h of the differentiation process this was also accompanied by an increase in glycolysis as indicated by increases in lactate and pyruvate and a decrease in glucose-6-phosphate. Both changes were accompanied by an increase in the concentration of ATP. Between 8 and 16 h the concentrations of the latter intermediates (succinate, fumarate, and malate) in the TCA cycle decreased as the concentrations of the early intermediates isocitrate and citrate increased, indicating the change in steady state for the two halves of the cycle. At the same time the concentrations of glucose and galactose increased and lactate decreased, suggestive of a decrease in glycolytic flux consistent with greater coupling between glycolytic flux and the TCA cycle. By 72 h, corresponding to the identified initiation of lipid accumulation, the concentration of the TCA cycle intermediates fumarate, malate, isocitrate, and citrate increased; a corresponding increase in ATP concentrations suggests that the flux of the TCA cycle was also increased. The concentration of glucose was also reduced at this time point. The TCA cycle intermediates continued to increase at 120 h, with the concentrations of succinate, fumarate, malate, and citrate all increasing across this time period. Accompanying upregulation of glycolytic flux was established with observed decreases in the concentrations of glucose, fructose, and galactose and increases in pyruvate and lactate between 24 h and 120 h. At 216 h TCA cycle and glycolytic intermediates were decreased in concentration as the cells reached terminal differentiation; at this time point the concentrations of glucose, galactose, and fructose were increased and those of pyruvate, lactate, succinate, fumarate, malate, isocitrate, and citrate were decreased compared with 120 h.
Amino acid metabolism.
Concentrations of amino acids and polyamine biosynthesis intermediates were measured using 1H-NMR spectroscopy and GC-MS analysis. The concentration of glutamine increased after 4 h and again after 16 h with a concomitant decrease in the concentration of glutamate. Polyamine metabolism was also altered during differentiation with an increase in the concentration of the putrescine precursors aspartate and ornithine detected prior to an increase in the concentration of putrescine detected after 24 h. The levels of the polyamine pathway metabolites, including putrescine, then decreased by 216 h.
Complex lipids and free fatty acids.
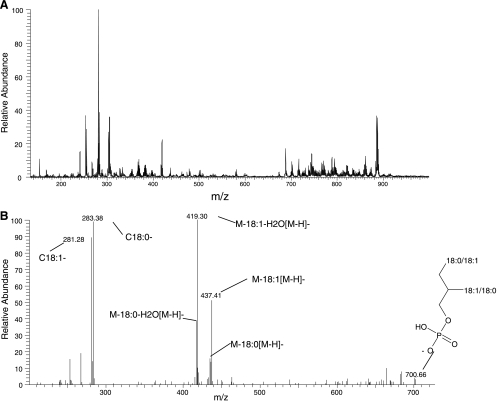
Concentrations of free fatty acids and glycerophospholipids were measured using DI-MS (Fig. 3). LC-MS was used to measure the concentrations of glycerophospholipids and triacylglycerols (TAGs).
Fig. 3.
Direct infusion of 3T3-L1 cell lipid extraction in negative mode. A: direct infusion mass spectrum of 3T3-L1 cell lipid extraction fraction. B: MS/MS spectrum of an ion at 701 m/z. Daughter ions are labeled.
Free fatty acids.
At 24 h an increase in even chain saturated and unsaturated fatty acids was detected as was an increase in the intermediates and end products of the omega-3 and omega-6 fatty acids. By 72 h there was an increase in the concentrations of even chain unsaturated fatty acids accompanied by an increase in the concentrations of odd chain saturated and unsaturated fatty acids that continued to the 216 h time point. The concentrations of the longer chain unsaturated even chain fatty acids were decreased by 120 h as were the concentrations of the omega-6 fatty acid pathway intermediates. At the conclusion of the study there was a detected increase in the concentration of α-linolenic acid and concomitant decrease in the essential fatty acid pathway intermediates and end products. A continued decrease in the longer, even chain fatty acids was also detected at 216 h.
TAGs.
The composition of TAGs was also altered with an increase in the incorporation of odd chain saturated and unsaturated fatty acids and a concomitant decrease in the concentration of even chain fatty acids at 72 h. Accumulation of odd chain fatty acids continued at 120 h with a concomitant decrease in even long chain fatty acids. By 216 h the concentration of TAGs esterified with odd chain fatty acids continued to increase while an associated decrease in the concentration of TAGs incorporating C16:0 and C18:0 was detected.
13C glucose labeling study.
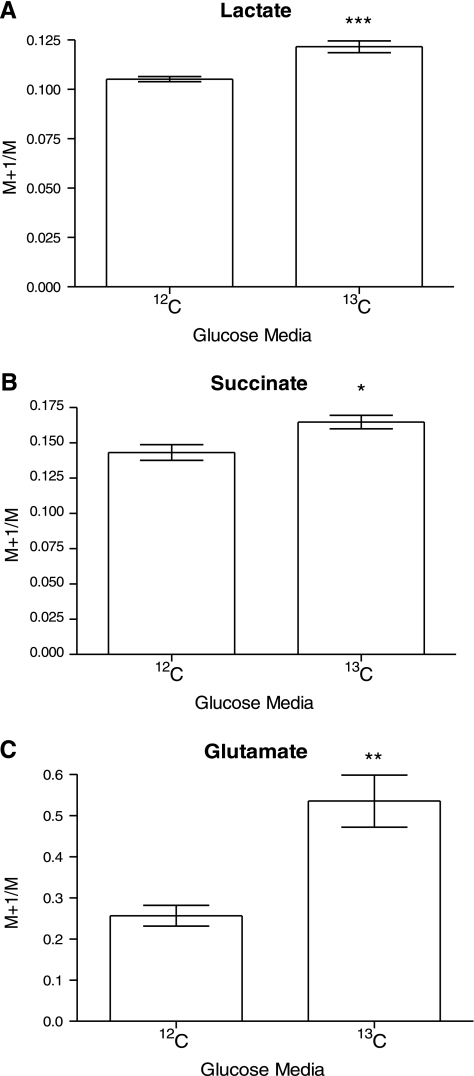
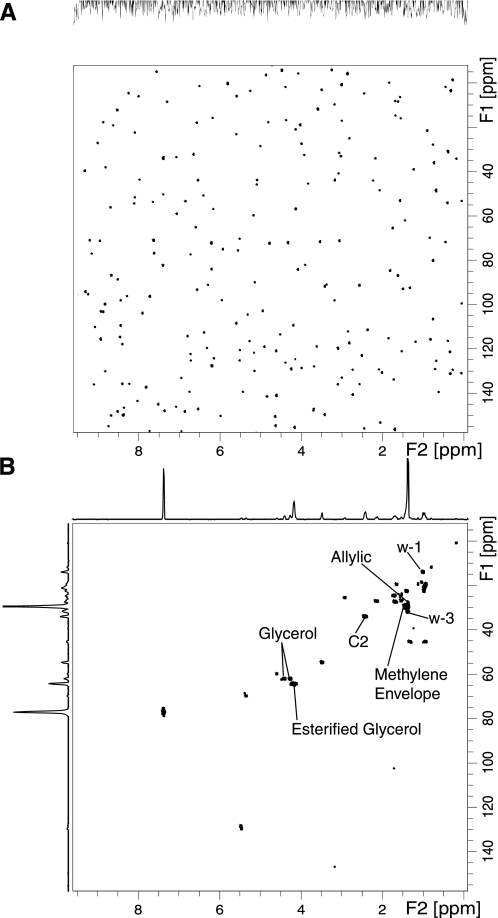
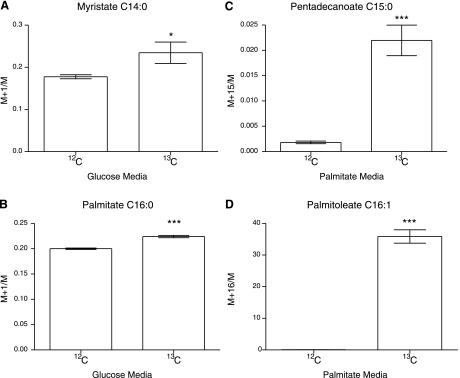
13C enrichment of a number of key metabolites was measured using HSQC NMR analysis of the organic-phase metabolites and GC-MS analysis of the organic and aqueous phases. When using 1-13C-glucose as a substrate we found lactate, succinate, and glutamate to be enriched when analyzed by GC-MS (Fig. 4), as were the lipid resonances in HSQC spectra corresponding to ω-1–3 resonances, allylic carbons, terminal lipid resonances (CH3 resonances), the methylene envelope, and esterified and nonesterified glycerol (Fig. 5). Further investigation, by GC-MS, of the enrichment of individual fatty acid species demonstrated that both C14:0 and C16:0 had clearly incorporated 13C from glucose (Fig. 6, A and B).
Fig. 4.
A: graph showing GC-MS M+1/M ion ratio for lactate when using 1-13C-glucose and unlabeled glucose, showing enrichment of lactate. B: graph showing GC-MS M+1/M ion ratio for succinate when using 1-13C-glucose and unlabeled glucose, showing enrichment of succinate. C. Graph showing GC-MS M+1/M ion ratio for glutamate when using 1-13C-glucose and unlabeled glucose, showing enrichment of glutamate. *P < 0.05, **P < 0.01, ***P < 0.005.
Fig. 5.
Heteronuclear single quantum coherence (HSQC) NMR spectra of organic extraction phase of 3T3-L1 cells exposed to unlabeled (A) or 1-13C-glucose (B). Key: ω 1–3 carbon signals, allylic carbons, C1–3 signals, the methylene envelope, and esterified and nonesterified glycerol 13C cross peaks are labeled.
Fig. 6.
A: graph showing GC-MS M+1/M ion ratio for myristate when using 1-13C-glucose and unlabeled glucose, showing enrichment of myristate. B: graph showing GC-MS M+1/M ion ratio for palmitate when using 1-13C-glucose and unlabeled glucose, showing enrichment of palmitate. C: graph showing GC-MS M+1/M ion ratio for pentadecanoate when using U-13C-palmitate and unlabeled palmitate, showing enrichment of pentadecanoate. D: graph showing GC-MS M+1/M ion ratio for palmitoleate when using U-13C-palmitate and unlabeled palmitate, showing enrichment of palmitoleate. *P < 0.05, ***P < 0.005.
13C palmitate labeling study.
13C enrichment of a range of metabolites was identified using GC-MS analysis of the organic and aqueous phases. Pentadecanoate was found to be enriched, confirming the observed increase in odd chain fatty acid abundance detected by analysis of the total pool of free fatty acids (Fig. 6C). The palmitate desaturation product palmitoleate was also found to be enriched with 13C in accordance with the observed activity of the Δ9 desaturase from the metabolomic studies (Fig. 6D).
Primary adipocytes.
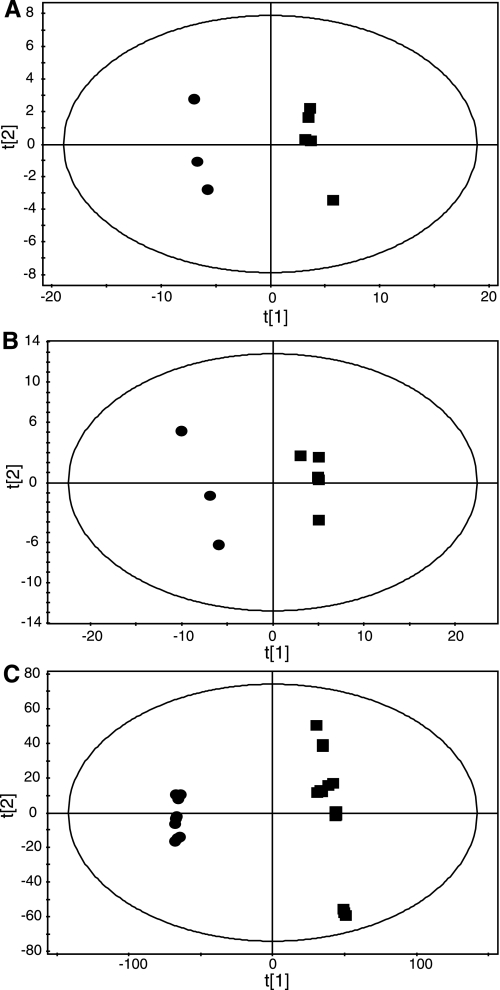
GC-MS and LC-MS, combined with multivariate pattern recognition, were used to compare metabolic differences between primary preadipocytes and differentiated primary adipocytes (Fig. 7).
Fig. 7.
A: partial least squares discriminant analysis (PLS-DA) scores plot showing clustering of organic-phase metabolites analyzed by GC-MS extracted from primary preadipocytes (▪) and differentiated primary adipocytes (•) (R2 = 0.76, Q2 = 0.97). B: PLS-DA scores plot showing clustering of aqueous-phase metabolites analyzed by GC-MS extracted from primary preadipocytes (▪) and differentiated primary adipocytes (•) (R2 = 0.71, Q2 = 0.96) C: PLS-DA scores plot showing clustering of organic-phase metabolites analyzed by LC-MS extracted from primary preadipocytes (▪) and differentiated primary adipocytes (•) (R2 = 0.443, Q2 = 0.99).
Total fatty acid metabolism.
The total fatty acid concentrations were measured using GC-MS analysis of their methyl esterified derivatives from the organic phase of the cell extracts. An increase in the concentrations of the shorter chain fatty acids (C12:0 and C14:0) and concomitant decrease in the concentrations of the longer chain fatty acids (C16:0, C18:0, C20:0, C 22:0, and C24:0) were observed in the differentiated primary adipocytes compared with the primary preadipocytes. The odd chain length fatty acids (C13:0 and C15:0) and the Δ9 desaturase products (C14:1, C16:1, C18:1, C19:1, C20:1, and C24:1) were also identified as increased in concentration in the differentiated primary adipocytes.
Carbohydrate metabolism.
Concentrations of glycolytic and TCA cycle intermediates were measured using GC-MS analysis of their methoximated and silylated derivatives from the aqueous phase of the cell metabolite extraction. The concentrations of glucose-6-phosphate, lactate, fumarate, and malate were all found to be increased in the differentiated primary adipocytes compared with the primary preadipocytes. A comparable result to the changes identified in the 3T3-L1 cell line.
TAGs.
The composition of TAGs was altered during differentiation of the primary adipocytes. There was an increase in the accumulation of odd chain length fatty acids into TAGs. In addition the concentration of desaturated fatty acid constituents of the TAGs was increased.
DISCUSSION
During 3T3-L1 adipocyte development the commitment to differentiate occurs between 24–48 h and is followed by the process of lipid accumulation (17). In the present study these processes are reflected in the multivariate models of the various analytical assays. One of the earliest changes in the process of differentiation was associated with upregulation of the TCA cycle as represented by an increase in the pool sizes of a number of the intermediates, possibly to increase ATP for the differentiation process. By 72 h, corresponding to the identified initiation of lipid accumulation, the intermediates of the TCA cycle again increase in concentration, but at this time point it is dominated by increases in citrate and isocitrate as fatty acid synthesis increases, with citrate being used to supply cytosolic acetyl-CoA, a key intermediate of fatty acid synthesis. Finally at 216 h the metabolite concentrations of the glycolytic pathway and the TCA cycle are such that it would suggest decreased need for these pathways, possibly as the energy demand of the cell decreases following differentiation. Alternatively, it could be viewed that now the dominant pathways involve fatty acid metabolism rather than pathways involving glucose.
The increase in the concentration of glutamine detected during differentiation has previously been observed and is caused by induction of glutamine synthase as a result of glucocorticoid stimulation during the commitment to differentiate (22). Furthermore, the detected changes in polyamine biosynthesis are known to be essential for differentiation of 3T3-L1 cells into adipocytes (1). The observed increase in concentration again corresponds to the induction of lipid accumulation and commitment to differentiate and a reduction in polyamine biosynthesis intermediates at 216 h also suggest the cells return to a resting state at this time point, an observation that correlates with changes in transcription of ornithine decarboxylase during adipocyte differentiation, with this enzyme producing putrescine from ornithine (6).
From 72 h onward there is a significant increase in the majority of fatty acids as the process of lipid accumulation occurs following the preadipocytes' commitment to differentiate. Accompanying the increase in fatty acids there was also an increase in desaturation and especially of the monounsaturated forms of fatty acids. Stearoyl-CoA desaturase 2 has recently been identified as essential for differentiation. Considering there is a predominance of saturated fatty acids in the growth media and the transcription of the enzyme is upregulated during differentiation (5), it is likely the desaturation observed is carried out by this enzyme (3). Sequential peroxisomal fatty acid α-oxidation and Δ 9 desaturation of fatty acids has been shown to occur in differentiating 3T3-L1 adipocytes, explaining the detected increase in odd chain fatty acids and their desaturation and accumulation into complex lipids (23). Analysis of the media eliminated this as the source of the odd chain fatty acids; the highest concentration fatty acids present in the media were palmitate and stearate, and odd chain fatty acids were only detected at low levels. A concomitant increase in the concentration of the CoA constituent pantothenate was detected alongside the lipid changes. CoA is necessary for fatty acid synthesis, transport of fatty acids into peroxisomes, and both α- and β-fatty acid oxidation. Therefore, it appears CoA is increased in response to demand for fatty acid synthesis and α-oxidation. The increase in the concentration of the fatty acid transport molecule carnitine at 72 h, continuing to 216 h, may indicate the requirement for export of odd chain fatty acids from peroxisomes following α-oxidation, since peroxisomes contain short- and medium-chain carnitine acyltransferases functioning to esterify carnitine to fatty acids to cross the peroxisomal membrane (26). The transcription of propionyl CoA carboxylase, an enzyme involved in fatty acid α-oxidation, and the enzyme carnitine acyl transferase have previously been reported as upregulated during 3T3-L1 differentiation (5).
Furthermore, the utilization of glucose to generate fatty acids during 3T3-L1 metabolism has been confirmed through the use of 13C-labeled glucose to monitor the metabolic flux through glycolysis, the TCA cycle, and into fatty acid synthesis. Once the fatty acids are synthesized they are subjected to desaturation by the Δ9 desaturase or to α-oxidation, forming odd chain fatty acids as indicated by the metabolomic data and confirmed through the use of U-13C labeled palmitate.
The observed decrease in the end products of the omega-3 essential fatty acid pathway, 5,8,11,14,17-eicosapentaenoic acid and 4,7,10,13,16,19-docosahexaenoic acid, may be necessary for the regulation of differentiation in the 3T3-L1 cell line. Docosahexaenoic acid has been shown to inhibit differentiation and promote lipolysis in the adipocytes (15).
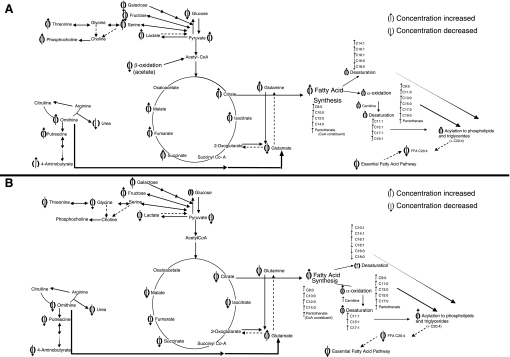
The concentration of arachidonic acid acyl groups in phospholipids appears to increase from 24 h with a decrease in its concentration as a free fatty acid detected by 120 h. Glucocorticoids block release of arachidonic acid from intracellular phospholipid pools (4). Given arachidonic acid is the initial substrate for the omega-6 essential fatty acid pathway this will lead to the decrease in the intermediates and products of this pathway, as observed in this study. The control of flux through this pathway is vital to differentiation since arachidonic acid, as a substrate for cyclooxygenase-2, strongly inhibits adipocyte differentiation via a prostaglandin synthesis pathway (18), and eicosapentaenoic acid (a pathway intermediate) represses the expression of peroxisome proliferator-activated receptor-γ, a nuclear receptor vital to adipocyte differentiation (24) (Fig. 8).
Fig. 8.
A: metabolic pathways altered during the lipid accumulation phase of 3T3-L1 adipocyte differentiation (72–120 h). ↑Metabolites increased in concentration; ↓metabolites decreased in concentration. B: metabolic pathways altered at terminal differentiation of 3T3-L1 adipocytes (216 h). ↑Metabolites increased in concentration; ↓metabolites decreased in concentration.
Although the 3T3-L1 cell line is a robust and extensively used tool for the investigation of adipocyte biology it is worthy of note that, as with all immortalized cell lines, they do not behave identically to their primary cell line counterparts. However, the metabolic differences found between primary preadipocytes and primary differentiated adipocytes matched many of the findings observed in the 3T3-L1 cell line. Therefore, it is hoped the current study will provide invaluable cues for research conducted in the 3T3-L1 cell line, primary cell lines, and even white adipose tissue when following the changes in metabolism associated with differentiation.
In conclusion, global metabolic profiling has been used to study the changes in metabolism required to bring about differentiation of fibroblastic like cells into mature adipocytes. A diverse number of interacting metabolic pathways essential to differentiation have been highlighted as altered at key points in this process. The changes in metabolite concentrations during commitment to differentiate, lipid accumulation, and the return to a resting state have been studied, and the TCA cycle, glycolysis, fatty acid α-oxidation, synthesis, and desaturation, polyamine biosynthesis, and esterification of acyl groups to complex lipids have been identified as implicit to 3T3-L1 maturation.
GRANTS
The authors gratefully acknowledge the support from the Biotechnology and Biological Sciences Research Council, UK (L. D. Roberts), GlaxoSmithKline (L. D. Roberts), and the Royal Society (UK) (J. L. Griffin).
REFERENCES
- 1.Bethell DR, Pegg AE. Polyamines are needed for the differentiation of 3T3-L1 fibroblasts into adipose cells. Biochem Biophys Res Commun 102: 272–278, 1981 [DOI] [PubMed] [Google Scholar]
- 2.Bligh EG, Dyer WJ. A rapid method of total lipid extraction and purification. Can J Biochem Physiol 37: 911–7, 1959 [DOI] [PubMed] [Google Scholar]
- 3.Christianson JL, Nicoloro S, Straubhaar J, Czech MP. Stearoyl-CoA desaturase 2 is required for peroxisome proliferator-activated receptor gamma expression and adipogenesis in cultured 3T3-L1 cells. J Biol Chem 283: 2906–2916, 2008 [DOI] [PubMed] [Google Scholar]
- 4.Flower RJ. Lipocortin and the mechanism of action of the glucocorticoids. Br J Pharmacol 94: 987–1015, 1988 [DOI] [PMC free article] [PubMed] [Google Scholar]
- 5.Gene Expression Omnibus Datasets Accession number GDS2659. Adipogenesis in vitro. [Google Scholar]
- 6.Gene Expression Omnibus Datasets Accession number GDS2660. Adipogenesis in vitro. [Google Scholar]
- 7.Green H, Kehinde O. Sublines of mouse 3T3 cells that accumulate lipid. Cell 1: 113–116, 1974 [Google Scholar]
- 8.Green H, Kehinde O. Spontaneous heritable changes leading to increased adipose conversion in 3T3 cells. Cell 7: 105–113, 1976 [DOI] [PubMed] [Google Scholar]
- 9.Green H, Kehinde O. An established preadipose cell line and its differentiation in culture. II. Factors affecting the adipose conversion. Cell 5: 19–27, 1975 [DOI] [PubMed] [Google Scholar]
- 10.Green H, Meuth M. An established pre-adipose cell line and its differentiation in culture. Cell 3: 127–133, 1974 [DOI] [PubMed] [Google Scholar]
- 11.Gullberg J, Jonsson P, Nordstrom A, Sjostrom M, Moritz T. Design of experiments: an efficient strategy to identify factors influencing extraction and derivatization of Arabidopsis thaliana samples in metabolomic studies with gas chromatography/mass spectrometry. Anal Biochem 331: 283–295, 2004 [DOI] [PubMed] [Google Scholar]
- 12.Im SS, Kwon SK, Kang SY, Kim TH, Kim HI, Hur MW, Kim KS, Ahn YH. Regulation of GLUT4 gene expression by SREBP-1c in adipocytes. Biochem J 399: 131–139, 2006 [DOI] [PMC free article] [PubMed] [Google Scholar]
- 13.Jitrapakdee S, Slawik M, Medina-Gomez G, Campbell M, Wallace JC, Sethi JK, O'Rahilly S, Vidal-Puig AJ. The peroxisome proliferator-activated receptor-gamma regulates murine pyruvate carboxylase gene expression in vivo and in vitro. J Biol Chem 280: 27466–27476, 2005 [DOI] [PMC free article] [PubMed] [Google Scholar]
- 14.Kajimoto K, Terada H, Baba Y, Shinohara Y. Essential role of citrate export from mitochondria at early differentiation stage of 3T3-L1 cells for their effective differentiation into fat cells, as revealed by studies using specific inhibitors of mitochondrial di- and tricarbodylate carriers. Mol Gen Metab 85: 46–53, 2005 [DOI] [PubMed] [Google Scholar]
- 15.Kim HK, Della-Fera M, Lin J, Baile CA. Docosahexaenoic acid inhibits adipocyte differentiation and induces apoptosis in 3T3-L1 preadipocytes. J Nutr 136: 2965–2969, 2006 [DOI] [PubMed] [Google Scholar]
- 16.Madsen L, Petersen RK, Sorensen MB, Jorgensen C, Hallenborg P, Pridal L, Fleckner J, Amri EZ, Krieg P, Furstenberger G, Berge RK, Kristiansen K. Adipocyte differentiation of 3T3-L1 preadipocytes is dependent on lipoxygenase activity during the initial stages of the differentiation process. Biochem J 375: 539–549, 2003 [DOI] [PubMed] [Google Scholar]
- 17.Pantoja C, Huff JT, Yamamoto KR. Glucocorticoid signaling defines a novel commitment state during adipogenesis in vitro. Mol Biol Cell 19: 4032–4041, 2008 [DOI] [PMC free article] [PubMed] [Google Scholar]
- 18.Petersen RK, Jorgensen C, Rustan AC, Froyland L, Muller-Decker K, Furstenberger G, Berge RK, Kristiansen K, Madsen L. Arachidonic acid-dependent inhibition of adipocyte differentiation requires PKA activity and is associated with sustained expression of cyclooxygenases. J Lipid Res 44: 2320–2330, 2003 [DOI] [PubMed] [Google Scholar]
- 19.Pietiläinen KH, Marko S, Rissanen A, Seppänen-Laakso T, Yki-Järvinen H, Kaprio J, Orešič M. Acquired obesity is associated with changes in the serum lipidomic profile independent of genetic effects - a monozygotic twin study. PLoS ONE 2: e218, 2007 [DOI] [PMC free article] [PubMed] [Google Scholar]
- 20.Rosen OM, Smith CJ, Fung C, Rubin CS. Development of hormone receptors and hormone responsiveness in vitro. Effect of prolonged insulin treatment on hexose uptake in 3T3-L1 adipocytes. J Biol Chem 253: 7579–7583, 1978 [PubMed] [Google Scholar]
- 21.Rubin CS, Hirsch A, Fung C, Rosen OM. Development of hormone receptors and hormonal responsiveness in vitro. Insulin receptors and insulin sensitivity in the preadipocyte and adipocyte forms of 3T3–L1 cells. J Biol Chem 253: 7570–7578, 1978 [PubMed] [Google Scholar]
- 22.Sadowski HB, Wheeler TT, Young DA. Gene expression during 3T3–L1 adipocyte differentiation. J Biol Chem 266: 4722–4731, 1992 [PubMed] [Google Scholar]
- 23.Su X, Han X, Yang J, Mancuso DJ, Chen J, Bickel PE, Gross RW. Sequential ordered fatty acid α-oxidation and Δ9 desaturation are major determinants of lipid storage and utilization in differentiating adipocytes. Biochemistry 43: 5033–5044, 2004 [DOI] [PubMed] [Google Scholar]
- 24.Tanabe Y, Matsunnaga Y, Saito M, Nakayama K. Involvement of cyclooxygenase-2 in synergistic effect of cyclic stretching and eicosapentaenoic acid on adipocyte differentiation. J Pharm Sci 106: 478–484, 2008 [DOI] [PubMed] [Google Scholar]
- 25.Weiss GH, Rosen OM, Rubin CS. Regulation of fatty acid synthetase concentration and activity during adipocyte differentiation. Studies on 3T3–L1 cells. J Biol Chem 255: 4751–4757, 1980 [PubMed] [Google Scholar]
- 26.Westin MAK, Hunt MC, Alexson SEH. Short- and medium-chain carnitine acyltransferases and acyl-CoA thioesterases in mouse provide complementary systems for transport of beta-oxidation products out of peroxisomes. Cell Mol Life Sci 65: 982–990, 2008 [DOI] [PMC free article] [PubMed] [Google Scholar]
- 27.Wheatcroft SB, Kearney MT, Shah AM, Ezzat VA, Miell JR, Modo M, Williams SC, Cawthorn WP, Medina-Gomez G, Vidal-Puig A, Sethi JK, Crossey PA. IGF-binding protein-2 protects against the development of obesity and insulin resistance. Diabetes 56: 285–294, 2007 [DOI] [PMC free article] [PubMed] [Google Scholar]


