Abstract
SR141716 (rimonabant) is an endocannabinoid receptor antagonist. Endocannabinoids are a class of chemicals that affect neurotransmission via G-protein coupled CB1 (brain) and CB2 (peripheral tissue) receptors. Numerous animal studies have shown that SR141716 binds with the CB1 receptor in the brain, resulting in several biological consequences including reduced alcohol intake and reward as well as reduced food consumption. In this work, an analytical method based on liquid chromatography and electrospray ionization tandem mass spectrometry (LC-ESI-MS/MS) has been developed and validated for the quantitative measurement of SR141716 in both human and rat plasma to support the investigation of this compound. A suitable internal standard (AM 251) has been chosen and the experimental conditions have been optimized for the separation and detection of singly charged positive ions of SR141716 and the internal standard. A protein precipitation protocol has been developed for extraction of SR141716 and the internal standard from plasma samples. Quantitation was achieved using multiple-reaction-monitoring (MRM) mode for SR141716 (m/z 463 → m/z 363) and the internal standard (m/z 555 → m/z 455) and calibration curve over the concentration range of 5.00–1000 ng/ml was plotted using the peak area ratio versus the concentration of SR141716 with a LOD and LLOQ of 1.09 and 3.62 ng/ml, respectively. The method developed has been used to analyze SR141716 in rat plasma samples from an animal study.
Keywords: SR141716, rimonabant, endocannabinoid receptor antagonist, LC-ESI-MS/MS, human and rat plasma
1. Introduction
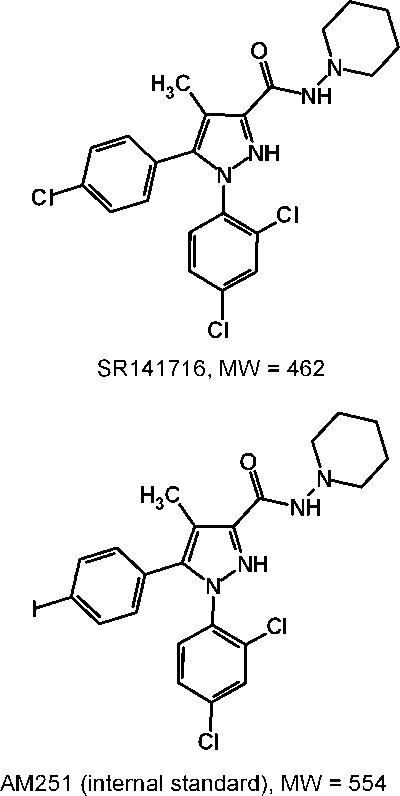
SR141716 [5-(4-chlorophenyl)-1-(2,4-dichlorophenyl)-4-methyl-N-1-piperidinyl-1H-pyrazole-3-carboxamide] (Figure 1) also known as rimonabant is an endocannabinoid receptor antagonist developed by Sanofi Aventis [1]. The drug is believed to interact with the G-protein coupled CB1 receptor in the brain [2]. It has been reported that the binding of endocannabinoid to CB1 receptor on the presynaptic neuron produces several biochemical consequences, including inhibition of Ca2+ channels [3]; activation of K+ channels [4]; inhibition of adenylate cyclase (AC) [5]; and activation of mitogen-activated protein kinase (MAPK) [6]. The effect of endocannabinoids on the Ca2+ and K+ ion channels results in a reduction of neuronal excitability and a suppression of neurotransmitter release. Additionally, binding to CB1 receptor results in blocking AC, which disrupts the conversion of ATP to cAMP, combined with the activation of MAPK, has an overall effect on gene expression [7].
Figure 1.
The chemical structures of SR141716 and AM251.
The administration of SR141716 to rodents has shown to reduce the rewarding/reinforcing behaviors of several drugs of abuse including heroin [8], cocaine [9], nicotine [10] and alcohol [11]. Studies suggest that SR141716 may be successful in the treatment of addiction because it affects dopamine neuronal activity, thereby regulating the reward strength circuitry [12]. Further, there is evidence that rodents administered this drug show a marked decrease in food consumption, suggesting it as a potential treatment for obesity [13]. Studies show that by blocking endocannabinoids from binding to the CB1 receptor, there is an effect on appetite, food consumption and energy balance [14].
SR141716 is the subject of heavy clinical investigation. Currently, SR141716 is in a phase II clinical trial for the treatment of alcoholism [15] and a phase III clinical trial for the treatment of diabetes [16]. A European clinical trial investigating SR141716 for the treatment of obesity has been completed [17]. Despite the recent withdrawal of a new drug application in the United States by Sanofi-Aventis, SR141716 has been approved to treat obesity and overweight patients that have associated cardiovascular risk in 42 countries, under the brand name Acomplia®.
The studies of SR141716 pharmacology and toxicology necessitate an analytical method for the measurement of this drug in biological fluids. A recent SciFinder Scholar search revealed only one paper that described the use of fused-core silica column with HPLC-APCI-MS/MS for the determination of rimonabant in mouse plasma [20]. However, this paper focused on the comparison of chromatographic performances between fast HPLC technology and ultrahigh-pressure liquid chromatography rather than the analytical method validation. To date, there is no validated analytical method publicly available for quantitative measurement of SR141716. This work describes the development and validation of a liquid chromatograph tandem mass spectrometric method for the direct quantitation of SR141716 in both human and rat plasma. The internal standard chosen for this method was AM251. A protein precipitation protocol was developed for plasma sample preparation. The drug and internal standard were separated on a C4 column and detected by positive-electrospray-ionization tandem mass spectrometry (ESI+-MS/MS). The method developed has been used to analyze SR141716 in rat plasma samples from an animal study.
2. Experimental
2.1. Chemicals and solutions
Acetic acid, HPLC-grade acetonitrile, dimethyl sulfoxide (DMSO), formic acid, and 1- (2,4-dichlorophenyl)-5-(4-iodophenyl)-4-methyl-N-1-piperidinyl-1H-pyrazole-3-carboxamide trifluoroacetate salt (AM251, the internal standard for this study), Cremophor EL, and Tween 80 were from Sigma-Aldrich (St. Louis, MO, USA). 5-(4-chlorophenyl)-1-(2,4-dichlorophenyl)-4-methyl-N-1-piperidinyl-1H-pyrazole-3-carboxamide (SR141716) was obtained from the National Institute of Mental Health (Bethesda, MD, USA) Drug Repository with a NIMH code S-705. Pooled human plasma was from Haemtech, Inc (Essex Junction, Vermont, USA) and donated by Dr. Michael Kalafatis at Cleveland State University. Pooled rat plasma was prepared with the untreated Sprague-Dawley rats using the procedure described in Section 2.5.
A stock solution (1.00 mg/ml) of SR141716 (C22H21Cl3N4O) was prepared by weighing 1.12 mg of the compound into a 1.5 ml Eppendorf tube (Eppendorf, Westbury, NY, USA) and dissolving it with 1.12ml of DMSO. A stock solution (1.00 mg/ml) of AM251 trifluoroacetate salt (C22H21N4OCl2I · C2HF3O2) was prepared by weighing 1.24 mg of the compound into a 1.5 ml Eppendorf tube and dissolving it with 1.24 ml of DMSO. After the compounds had dissolved in DMSO, both SR141716 and AM251 stock solutions were transferred to 1.5 ml amber glass autosampler vials, sealed with parafilm, and were stored at − 20 °C when not in use.
A working solution (100 μg/ml) of SR141716 was prepared by a dilution (1/10) of the SR141716 stock solution with DMSO. A working solution (2.00 μg/ml) of AM251 was prepared by a three-step dilution (1/8.3, 1/10, 1/5) of the AM251 trifluoroacetate salt stock solution with DMSO. A mobile phase for liquid chromatographic separation was prepared by mixing 0.1% HCOOH and 99.9% CH3OH/H2O (50:50, v/v). All solutions were stored at 4 °C when not in use.
2.2. Preparation of plasma calibrators and controls
Pooled human and Sprague-Dawley rat plasmas containing no detectable SR141716 were used as the blank plasmas to prepare human and rat plasma calibrators and controls for this study. SR141716 standard solutions (0.0100, 0.0200, 0.100, 0.150, 0.200, 1.00, 1.50, 2.00, 10.0, 15.0, 20.0 μg/ml) were prepared by a serial dilution of the working solution (100 μg/ml) with DMSO. SR141716 plasma calibrators (0.500, 1.00, 5.00, 10.0, 50.0, 100, 500, 1.00 × 10³ ng/ml) were prepared by a 1:20 dilution of the corresponding SR141716 standard solutions with the blank plasma. SR141716 plasma controls (7.50, 75.0, 750 ng/ml) were prepared by a 1:20 dilution of the corresponding SR141716 standard solutions with the blank plasma. All plasma samples were stored at − 20 °C when not in use.
2.3. Sample preparation by protein precipitation
Plasma SR141716 calibrators, QCs and animal samples were prepared by protein precipitation using the following protocol. First, 200 μl of plasma sample was pipetted into a 1.5 ml Eppendorf tube followed by 10.0 μl of the AM251 working solution (2.00 μg/ml) and 50.0 μl of acetic acid. After vortex mixing, 1.00 ml of acetonitrile was added. The solution was then mixed again by vortexing and centrifuged for 15 minutes at 13,000 g. After centrifugation, the supernatant was transferred to a 1.5 ml Eppendorf tube, and evaporated to dryness in a DNA 120 SpeedVac® (ThermoSavant, Hollbrook, NY, USA) at 65 °C for 90 min. Prior to analysis, the sample was reconstituted in 200 μl of the mobile phase.
2.4. Recovery study
The recovery of SR141716 by the protein precipitation procedure was accessed using SR141716 plasma controls and SR141716 reference solutions at three different concentrations (7.50, 75.0, 750 ng/ml). The reference solutions contained the same matrix as that of plasma controls, which were prepared using blank plasma as samples by the same procedure as that of plasma controls, and reconstituted in the mobile phase with corresponding SR141716 concentrations.
2.5. Animal study
Male offspring of Sprague-Dawley rats (Taconic Farms) bred in Binghamton University’s vivarium were used in this experiment. On postnatal (P) day 1, litters were culled to 7–10 subjects, with six males and four females retained whenever possible. Animals were weaned on P21, housed in same-sex pairs and maintained on a 14/10 hour light/dark cycle (lights on at 7 am) with food and water available ad libitum. All experimental procedures were approved by the Institutional Animal Care and Use Committee at Binghamton University.
The average age of the animals was 70 days. The average body weight of the animals was 300 grams. SR141716 was delivered as a suspension of 2.0% Cremaphor EL, 0.1% Tween 80 and deionized water. All injections were given intraperitoneally (i.p.) 10 mg/kg in a volume of 5 ml. The animals were decapitated at 30 minutes and 12 hours. Trunk blood samples were obtained by allowing the blood to drain into centrifuge tubes. An average of 3 mL of blood was collected in tubes containing 0.1 ml of 0.1 M EDTA. High-speed centrifugation was used to separate the plasma from whole blood. Plasma was stored at − 80 °C until analysis.
2.6. Instrumentation
The instrumentation system used in this work consisted of an HP1100 pump by Hewlett Packard (Palo Alto, CA, USA), an HP1100 autosampler, a stainless steel in-line filter (0.5 μm pore, 0.23 μl dead volume) by Upchurch Scientific (Oak Harbor, WA, USA), a YMC™ Pro C4 cartridge column (3 μm, 120 Å, 2.0 mm × 50 mm) by Waters (Milford, MA, USA), a stainless steel splitting tee (1/16″ × 0.25 mm) by Valco (Houston, TX, USA), and a Quattro II triple quadrupole mass spectrometer by Micromass (Manchester, UK). The fluidic connection of the system was made using high-pressure polyether ether ketone (PEEK) tubing (0.0625 in. o.d., 0.0100 in. i.d.). The post-column split ratio was 1:2 with a smaller flow (ca. 63 μl/min) to the MS detector and the larger one to the waste.
2.7. Liquid chromatographic separation
Analytical separation was performed on a Waters YMC™ Pro C4 cartridge column. Prior to the analysis, the cartridge column was first equilibrated with the mobile phase at a flow rate of 0.200 ml/min for about 15 min. During the analyses, 20 μl of sample was injected by the autosampler and carried onto the cartridge column by the mobile phase at a flow rate of 0.200 ml/min. SR141716 and AM251 (internal standard) were separated from the matrix and retained on the column with retention times of 6.8 and 7.8 min, respectively. The total run time was about 10.0 min per sample.
2.8. Mass spectrometric detection
The Micromass Quattro II triple quadrupole mass spectrometer was operated under the positive electrospray ionization mode (ESI+). The mass spectrometer was tuned by infusion of a mixture of SR141716 (1.0 μg/ml) and AM251 (1.0 μg/ml) in the mobile phase at a flow rate of 3 μl/min with a syringe pump (Harvard Apparatus, South Natick, MA, USA). Ionization conditions were optimized as follows: nitrogen sheath and desolvation gas at 10 and 350 l/h, capillary at 3.5 kV, HV lens at 0.5 kV, cone at 40 V, skimmer at 1.5 V, RF lens at 0.2 V, ion source temperature at 95 °C, ion energy at 1.0 V, low- and high-mass resolution at 15, and multiplier at 700 V. Full-scan spectra were acquired in the continuum mode at a scan rate 400 u/s.
Multiple reaction monitoring (MRM) mode was used for quantitation, which was set as follows: m/z 463 → 363 for SR141716, m/z 555 → 455 for AM251, argon collision gas at 2.0–2.5 μbar, cone at 40 V, collision energy at 20 V for both analytes, low- and high-mass resolution at 10 for quadrupole 1 and 15 for quadrupole 3, dwell time at 0.1 s, and the inter-scan delay at 0.01 s. The ionization parameters were the same as those described previously.
2.9. Data analysis
Data acquisition and peak integration were accomplished using the Micromass Masslynx software (version 3.4). The peak area ratios of SR141716 plasma calibrators to the internal standard were plotted against plasma SR141716 concentrations for a regression equation. SR141716 concentration of an unknown plasma sample was determined by the regression equation after obtaining the peak area ratio of SR141716 in the unknown to the internal standard from the mass chromatogram.
3. Results and Discussion
3.1. Solvent selection
SR141716 and AM251 (Figure 1) are carboxamide derivatives, which have low solubilities in water. It is not possible to directly dissolve either compound in plasma. Protonation of the SR141716 and AM251 with 0.1 M HCl has little effect on dissolving the compounds in aqueous solution. Although CH3OH could dissolve the compounds, its high methanol content prevented its use in preparation of plasma calibrators and controls. As previously reported, as little as 1% of methanol could cause protein precipitation and resulted in poor reproducibility in analytical measurement [18]. Therefore, a suitable solvent that does not precipitate plasma protein was sought for SR141716 and AM251 standard solutions.
Our experiments showed that DMSO could dissolve both SR141716 and AM251 easily within the concentration range used in this work, and the addition of DMSO up to 25% did not cause protein precipitation from plasma. Furthermore, the use of DMSO did not compromise the detection sensitivity of the analytes by mass spectrometer. Hence, DMSO was chosen as the solvent for SR141716 and AM251 stock and standard solutions. In this work, the percent composition of DMSO in plasma calibrators and controls was limited to 10% (v/v) to assure that no protein precipitation occurred.
3.2. Plasma sample preparation
The feasibility of on-line solid-phase extraction (e.g., Waters Oasis HLB cartridge column) was initially tested for plasma sample preparation. However, due to the hydrophobicity of the analytes, there were significant carryovers between analyses.
To avoid the considerable error by carryover, a protein precipitation protocol was developed that used CH3CN (100%) as deproteinizing solvent. Prior to the protein precipitation, acetic acid was added to plasma samples to reduce the interaction between the analytes and the plasma proteins. The use of acetic acid did not only improve the extraction efficiency but also promote the protonation of SR141716 and AM251 for improved sensitivity of ESI+-MS-MS detection. Our study also showed that reduced CH3CN percentage (e.g., 70%) resulted in inconsistent recovery across the concentration range being studied. This might be due to the change in partition isotherm at lower CH3CN content.
3.3. Liquid chromatographic separation
Several analytical columns and mobile phase compositions were tested for this method. Firstly, using a Waters YMC™ Pro C18 cartridge column (3 μm, 120 Å, 2.0 mm × 50 mm) and a mobile phase of 90% CH3OH/0.1% HCOOH in water, co-elution of SR141716 and the internal standard AM251 at retention times of 2.5 and 2.8 min was observed. Secondly, using a mobile phase of 70% CH3CN/0.1% HCOOH in water, a baseline separation of SR141716 and the internal standard was achieved at 4.6 and 5.6 min on the Waters YMC™ Pro C18 cartridge column. Thirdly, to reduce the consumption of organic solvent, a Waters YMC™ Pro C8 cartridge column (3 μm, 120 Å, 2.0 mm × 50 mm) was tested. Using a mobile phase composition of 50% CH3CN/0.1% HCOOH in water, a partial separation of SR141716 and the internal standard was observed at 13.5 and 17.0 min. Finally, to optimize the separation time, a Waters YMC™ Pro C4 cartridge column (3 μm, 120 Å, 2.0 mm × 50 mm) and a mobile phase composition of 50% CH3CN/0.1% HCOOH in water were used, which gave a baseline separation of SR141716 and the internal standard with retention times of 6.8 and 7.8 min. Therefore, a Waters YMC™ Pro C4 cartridge column and a mobile phase composition of 50% CH3CN/0.1% HCOOH in water were adopted for the subsequent analytical separations.
3.4. Mass spectrometric detection
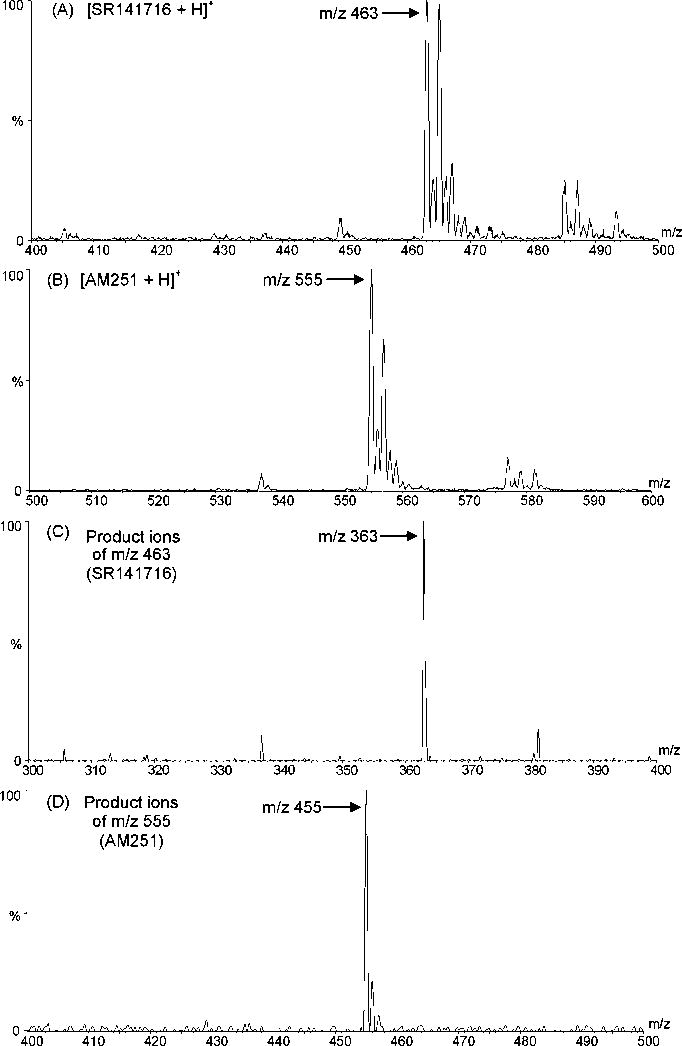
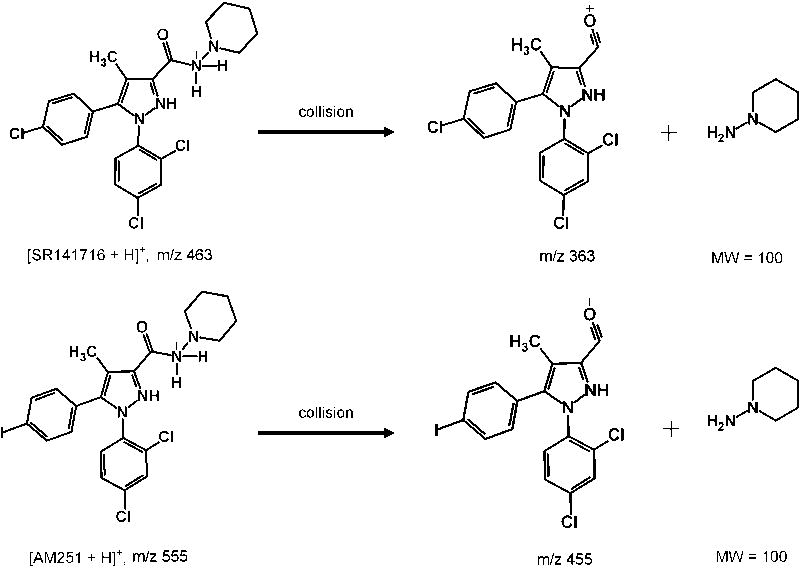
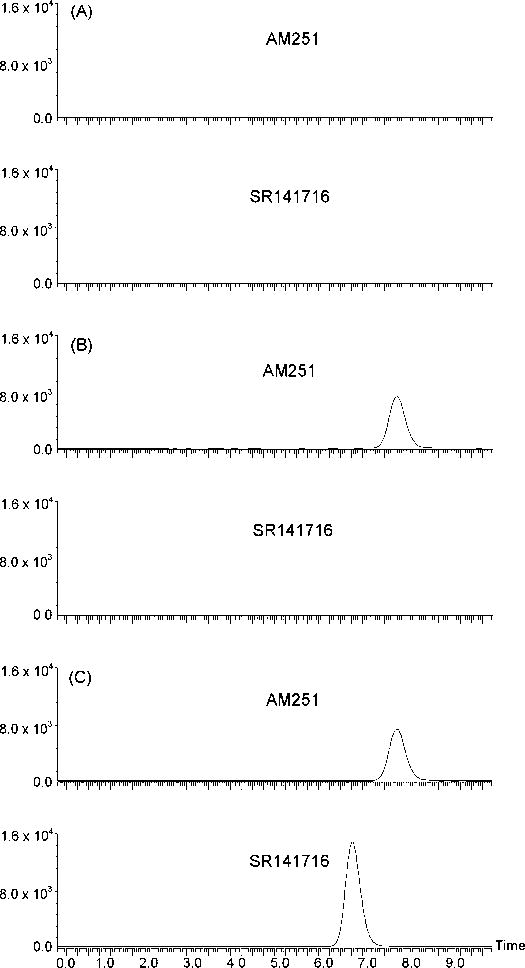
Due to their chemical structures, SR141716 and AM251 are more easily protonated then deprotonated in electrospray ionization; therefore, positive electrospray ionization mode was used for analyte identification and quantitation. The full-scan spectra (Figures 2A and 2B) showed that SR141716 produced a predominant protonated molecular ion at m/z 463 and AM251 at m/z 555. Therefore, these ions were chosen as parent ions for fragmentation in the multiple-reaction-monitoring (MRM) mode. The daughter spectra of the parent ions revealed that the predominant daughter fragments were m/z 363 for SR141716 and m/z 455 for AM251 (Figures 2C and 2D). The predominant product ions were 100 amu less than their parent ions. By comparing the chemical structures of SR141716 and AM251, the fragmentation reactions could be proposed (Figure 3). These product ions were chosen for analyte quantitation. The specificity of the MRM mode for SR141716 and AM251 was illustrated by the mass chromatograms (Figure 4), which showed no interference from the plasma matrices.
Figure 2.
The mass spectra of SR141716 and AM251, and their major fragments. The experimental conditions were the same as those described in Section 2.8.
Figure 3.
The proposed major fragmentation of SR141716 and AM251.
Figure 4.
The representative mass chromatograms of human plasma samples: (A) the pooled human blank plasma; (B) the pooled human plasma spiked with 100 ng/ml AM251; and (C) the pooled human plasma spiked with 100 ng/ml SR141716 and 100 ng/ml AM251.
3.5. Recovery
The recovery studies were conducted using SR141716 plasma controls and SR141716 reference solutions at three different concentrations (7.50, 75.0 and 750 ng/ml). The absolute recoveries of SR141716 and the internal standard were determined by comparing the mean peak areas of SR141716 and internal standard in the plasma controls to those of SR141716 and the internal standard in the reference solutions. The relative recoveries of SR141716 were determined by comparing the mean-peak-area ratios of SR141716 to the internal standard in the plasma controls to those of SR141716 to the internal standard in the reference solutions.
As shown in Table 1, by triplicate measurements, the mean absolute recoveries of SR141716 and the internal standard in human plasma ranged 83.0–85.1% and 85.1–91.0%, respectively. The mean relative recoveries of SR141716 in human plasma ranged 92.0–99.2%. The improved relative recoveries were attributed to the use of internal standard. Since there was no significant difference observed between data from human and rat plasma, rat plasma validation data were not shown.
Table 1.
Absolute and relative recoveries of SR141716 and AM251 in human plasma
| Compound | 7.50 ng/ml | 75.0 ng/ml | 750 ng/ml | |||
|---|---|---|---|---|---|---|
| Recovery | %CV | Recovery | %CV | Recovery | %CV | |
| SR141716 | 83.0 | 2 | 83.7 | 4 | 85.1 | 5 |
| AM251 | 87.3 | 3 | 91.0 | 4 | 85.8 | 4 |
| SR141716/AM251 | 95.2 | 3 | 92.0 | 0.6 | 99.2 | 1 |
The number of measurements was 3 for each datum point.
The concentration of the internal standard AM251 was 100 ng/ml.
3.6. Precision and accuracy
Intra- and inter-assay precision and precision of the method were determined by analyzing SR141716 plasma controls at three different concentrations (7.50, 75.0 and 750 ng/ml). Intra-assay precision was determined by triplicate measurements of the peak-area ratio of SR141716 to the internal standard from a single sample at each concentration. Inter-assay precision was determined by the triplicate measurements of the peak-area ratio of SR141716 to the internal standard from three separate samples at the each concentration. As shown in Table 2, the intra- and inter-assay precision expressed in terms of percent coefficient of variation (%CV) ranged 0.5–1% and 0.5–6%, respectively. Accuracy defined as the measured value to the accepted value multiplies by 100%, were 105, 99.5 and 100% at the concentrations of 7.50, 75.0 and 750 ng/ml by triplicate measurements.
Table 2.
Intra- and inter-assay precision of SR141716 in human plasma
| %CV (Peak area of SR141716 to peak area of AM251) | ||
|---|---|---|
| [SR141716] (ng/ml) | Intra-run | Inter-run |
| 7.50 | 0.9 | 6 |
| 75.0 | 1 | 0.5 |
| 750 | 0.4 | 2 |
The concentration of the internal standard AM251 was 100 ng/ml.
The number of measurements was 3 for each datum point.
3.7. Linearity
The linear response determined by the peak-area ratios of SR141716 to the internal standard versus the concentrations of SR141716 was achieved over a concentration range of 5.00–1000 ng/ml with a correlation coefficient of 0.999. A mean calibration equation, y = 0.0196x, was derived from three separate calibration curves over a six-month period.
3.8. Detection limits
The limit of detection (LOD) and the lower limit of quantitation (LLOQ) for the method were calculated as 3 and 10 times of signal-to-noise ratio (peak-to-peak). Based on five replicate measurements of 5.00 ng/ml SR141716 plasma calibrator, the LOD and LLOQ of the method were calculated to be 1.09 and 3.62 ng/ml, respectively.
3.9. Stability
The stability of SR141716 in plasma was determined by three aliquots at each low and high controls after three freeze (−20 °C) and thaw (room temperature) cycles. The results showed no significant degradation with relative errors -8.9 and 8.6 % for the low and high controls. The short-term temperature stability was assessed by keeping the controls at room temperature for 4, 8 and 24 hrs. Under the test conditions, the maximum relative error observed was 6.6% which showed no significant loss of SR141716. The SR141716 stock solution and plasma samples were respectively kept at −20 and −80 °C, which were stable for at least six months.
3.10. Analysis of SR141716 in rat plasma samples
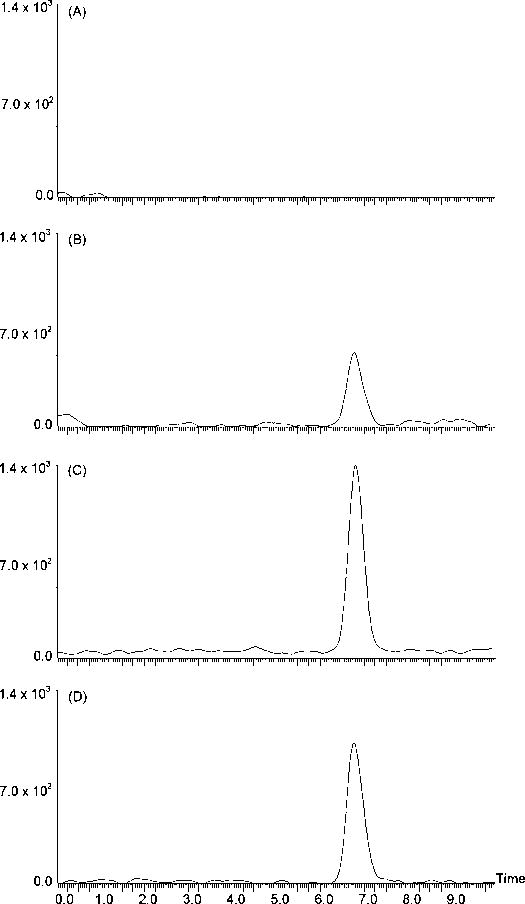
The validated method was used to analyze SR141716 in plasma samples from rats after intraperitoneal injection of SR141716 at the dose of 10 mg/kg. In the analyses, the frozen rat plasma samples and blank plasma were thawed to room temperature, 200 μl of plasma samples together with the blank plasma were prepared by the protein precipitation procedure described in Section 2.3 and analyzed by the LC-MS-MS method. The resultant mass chromatograms are shown in Figure 5. While there was no interference found in the untreated rat plasma (Figure 5A), SR141716 was detected in rat plasma at 30 min and 12 h injection of SR141716 (Figures 5B and 5C). By comparing with Figure 5D, the plasma SR141716 concentrations at these time points were either lower or higher than 5 ng/ml. Furthermore, the plasma concentration at 12 h after injection was higher than that at 30 min. This finding was consistent with the pharmacokinetic data in the US FDA briefing document (NDA 21–888, June 13, 2007), which showed a mean half-life of ca. 16 days for the drug in human [19]. Although the dose and the sampling times in this preliminary study were not optimized for the pharmacokinetic study, the results have demonstrated the applicability of the method for the measurement of SR141716 in plasma samples.
Figure 5.
The representative mass chromatograms of rat plasma samples: (A) the untreated rat plasma; (B) the rat plasma collected 30 min after injection of 10 mg SR141716/kg rat; (C) the rat plasma collected 12 h after injection of 10 mg SR141716/kg rat; and (D) the untreated rat plasma spiked with 5.00 ng/ml SR141716.
4. Conclusions
A rapid and specific liquid chromatograph tandem mass spectrometric method has been developed and validated for the quantitative measurement of SR141716 in both human and rat plasma matrices. Plasma SR141716 can be prepared by protein precipitation, separated by C4 column, and quantified by ESI+-MS-MS. The fragmentation reactions of SR141716 and the internal standard AM251 have been proposed. This method has high sample recovery, wide linear calibration range, and low limit of quantitation. It has been used to analyze SR141716 in plasma from rats that received intraperitoneal injections of the drug. Thus, it may be useful for pharmacological and toxicological studies of this drug.
Acknowledgments
The animal study was supported by the grant R37 AA12525 from the National Institute on Alcohol Abuse and Alcoholism.
Footnotes
Publisher's Disclaimer: This is a PDF file of an unedited manuscript that has been accepted for publication. As a service to our customers we are providing this early version of the manuscript. The manuscript will undergo copyediting, typesetting, and review of the resulting proof before it is published in its final citable form. Please note that during the production process errors may be discovered which could affect the content, and all legal disclaimers that apply to the journal pertain.
References
- 1.Rinaldi-Carmona M, Barth F, Héaulme M. FEBS Lett. 1994;350:240. doi: 10.1016/0014-5793(94)00773-x. [DOI] [PubMed] [Google Scholar]
- 2.Di Marzo V, Bifulco M, De Petrocellis L. Nature Rev Drug Discov. 2004;3:771. doi: 10.1038/nrd1495. [DOI] [PubMed] [Google Scholar]
- 3.Pertwee RG. Pharmacol Ther. 1997;74:129. doi: 10.1016/s0163-7258(97)82001-3. [DOI] [PubMed] [Google Scholar]
- 4.McAllister SD, Griffin G, Satin LS, Abood ME. J Pharmacol Exper Ther. 1999;291:618. [PubMed] [Google Scholar]
- 5.Felder CC, Joyce KE, Briley EM, Mansouri J, Mackie K, Blond O, Lai Y, Ma AL, Mitchell RL. Mol Pharmacol. 1995;48:443. [PubMed] [Google Scholar]
- 6.Bouaboula M, Poinot-Chazel C, Bourrié B, Canat X, Calandra B, Rinaldi-Carmona M, Le Fur G, Casellas P. Biochemic J. 1995;312:637. doi: 10.1042/bj3120637. [DOI] [PMC free article] [PubMed] [Google Scholar]
- 7.McAllister SD, Glass M. Prostaglandins Leukot Essent Fatty Acids. 2002;66:161. doi: 10.1054/plef.2001.0344. [DOI] [PubMed] [Google Scholar]
- 8.Navarro M, Carrera M, Fratta W, Valverde O, Cossu G, Fattore L, Chowen JA, Gómez R, Villanúa M, Maldonado R, Koob G, Rodríguez de Fonseca F. J Neurosci. 2001;21:5344. doi: 10.1523/JNEUROSCI.21-14-05344.2001. [DOI] [PMC free article] [PubMed] [Google Scholar]
- 9.De Vries T, Shaham Y, Homberg J, Crombag H, Schuurman K, Dieben J, Vanderschuren L, Schoffelmeer A. Nat Med. 2001;7:1151. doi: 10.1038/nm1001-1151. [DOI] [PubMed] [Google Scholar]
- 10.Cohen C, Perrault G, Voltz C, Steinberg R. P Soubrie Behav Pharmac. 2002;13:451. doi: 10.1097/00008877-200209000-00018. [DOI] [PubMed] [Google Scholar]
- 11.Colombo G, Vacca G, Serra S. Eur J Pharmacol. 2004;498:119. doi: 10.1016/j.ejphar.2004.07.069. [DOI] [PubMed] [Google Scholar]
- 12.Cohen C, Perrault G, Voltz C, Steinberg R, Soubrie P. Behavioural Pharmacology. 2002;13:451. doi: 10.1097/00008877-200209000-00018. [DOI] [PubMed] [Google Scholar]
- 13.Carai M, Colombo G, Gessa G, Gian L. Life Sci. 2005;77:2339. doi: 10.1016/j.lfs.2005.04.017. [DOI] [PubMed] [Google Scholar]
- 14.Di Marzo V, Matias I. Nat Neurosci. 2005;8:585. doi: 10.1038/nn1457. [DOI] [PubMed] [Google Scholar]
- 15.ClinicalTrials.gov Identifier: NCT00075205.
- 16.ClinicalTrials.gov Identifier: NCT00449605.
- 17.ClinicalTrials.gov Identifier: NCT00386061.
- 18.Grozav A, Hutson T, Zhou X, Bukowski R, Ganapathi R, Xu Y. J Pharm Biomed Anal. 2004;36:125. doi: 10.1016/j.jpba.2004.05.014. [DOI] [PubMed] [Google Scholar]
- 19.http://www.fda.gov/ohrms/dockets/ac/07/briefing/2007-4306b1-fda-backgrounder.pdf
- 20.Hsieh Y, Duncan CJG, Brisson J-M. Anal Chem. 2007;79:5668. doi: 10.1021/ac070343g. [DOI] [PubMed] [Google Scholar]


