Abstract
Flow-independent angiography offers the ability to produce vessel images without contrast agents. Angiograms are acquired with magnetization-prepared three-dimensional balanced steady-state free precession sequences, where the phase encodes are interleaved and the preparation is repeated prior to each interleaf. The frequent repetition of the preparation significantly decreases the scan efficiency. The number of excitations can instead be reduced with compressed sensing by exploiting the compressibility of the angiograms. Hence, the phase encodes can be undersampled to save scan time without significantly degrading image quality. These savings can be allotted for preparing the magnetization more often, or alternatively, improving resolution. The enhanced resolution and contrast achieved with the proposed method are demonstrated with lower leg angiograms. Depiction of the vasculature is significantly improved with the increased resolution in the phase-encode plane and higher blood-to-background contrast.
Keywords: compressed sensing, non-contrast-enhanced, magnetic resonance angiography, SSFP, magnetization preparation
Introduction
Magnetic resonance angiography (MRA) is a useful tool in the diagnosis of vascular diseases and the monitoring of their treatment. Contrast-enhanced MRA is fast, but it requires the injection of potentially harmful contrast agents (1,2). Meanwhile, conventional non-contrast-enhanced techniques such as time-of-flight and phase-contrast angiography rely on blood flow to generate contrast (3–7). On the other hand, flow-independent angiography (FIA) exploits the inherent MR properties (T1 and T2) of the tissues (8–11). Blood-to-background contrast can be generated even with slow flow without the need for contrast agents.
In early work, FIA angiograms of the extremities were acquired with three-dimensional (3D) magnetization-prepared balanced steady-state free-precession (bSSFP) sequences coupled with centric phase encoding and k-space segmentation (11). The fat signal was suppressed with the efficient phase-sensitive (PS) SSFP method (12). This scheme of producing FIA angiograms is SNR-efficient; however, due to partial volume artifacts, the PS-SSFP reconstruction can lead to underestimation of the blood signal.
More recently, we have proposed the use of alternating repetition time (ATR) bSSFP (13) to suppress the fat signal in angiograms. This technique significantly reduces partial volume artifacts compared to PS-SSFP (14), and clearly depicts the underlying vasculature. However, the large volumetric coverage requirements in the extremities and the need for better blood-to-background contrast place constraints on scan time. The scan efficiency is compromised with an increased number of k-space samples (for improved resolution) or k-space segments (for improved contrast).
The increased demand in scan time can be eased with techniques that accelerate MR acquisitions. Compressed sensing (CS) is a promising strategy to reduce the number of samples without introducing severe image artifacts (15–19). It exploits the inherent sparsity of images to accelerate the data acquisition. Because angiographic images are substantially compressible, CS offers significant scan accelerations regardless of the existing coil hardware. Therefore, we choose to focus on the application of CS to enhance FIA.
In this work, we employ a pseudo-random variable-density undersampling of the phase encodes to accelerate the MR acquisitions, and the resulting artifacts are removed with a CS reconstruction. The scan time saved by reducing the required number of excitations is used to improve the image resolution and/or the blood-to-background contrast. This contrast improvement increases the compressibility of the underlying images, which in turn enhances the ability of CS to reconstruct the images. The proposed method introduces a flexible framework to adjust the imaging parameters to application-specific needs and improve the quality of FIA images without significant scan time penalties.
Methods
There are two main considerations for producing FIA angiograms that clearly depict the vasculature. First, a large volume has to be covered in the extremities with a high-resolution three-dimensional (3D) acquisition. In addition, a sufficient blood-to-background contrast-to-noise ratio has to be achieved.
SNR-efficient bSSFP sequences can partially address the aforementioned problems. These sequences can acquire 3D datasets with large matrix sizes within short scan times. In addition, bSSFP has inherently high blood and low muscle signal due to the differences in their T2/T1 ratios. Nevertheless, the generated contrast may not be enough to project blood vessels through thick layers of muscle. Furthermore, bSSFP produces a bright fat signal which may obscure the visualization of the underlying structures of interest.
In this work, we produce FIA angiograms with a magnetization-prepared 3D ATR bSSFP sequence along with a segmented k-space acquisition. Magnetization preparation reduces the muscle signal, whereas ATR bSSFP suppresses the fat signal. We further employ compressed sensing to improve image resolution or contrast without increasing the scan time. The following subsections describe the individual parts of this sequence in detail.
Magnetization Preparation
The main purpose of the magnetization preparation section is to improve T2-dependent contrast such as the blood/muscle and arterial/venous blood contrast, although any sort of preparation can potentially be included to suppress other sources of background signal. The T2-preparation is achieved with a segmented adiabatic B1-insensitive rotation (BIR-4) pulse (20), which is immune to main field and radio-frequency (RF) excitation field inhomogeneities.
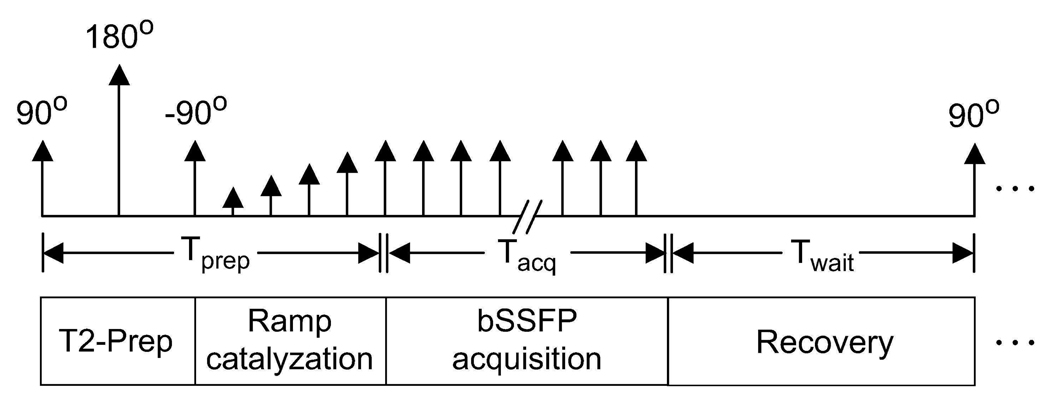
The diagram in Fig. 1 shows the various segments of the pulse sequence. Because the prepared magnetization is transient, only a limited amount of data can be acquired with the initially generated contrast. Therefore, the data acquisition should begin as soon as possible. For this purpose, the transient signal oscillations are dampened by linearly ramping up the RF tip angle (21). To further enhance the effect of magnetization preparation on the final image contrast, k-space is grouped into several segments (interleaves) with centric phase-encode ordering (11). For its simplicity and robustness, a 3DFT k-space acquisition is performed on square-spiral interleaves (22).
Figure 1.
The pulse sequence diagram of the magnetization-prepared bSSFP sequence. The T2-preparation section forms the magnetization-preparation module. Immediately following a linearly ramped series of RF excitations, the bSSFP acquisition starts. The total time spent preparing the magnetization and ramping the RF tip angles is Tprep. In a given k-space segment (interleaf), samples closest to the center of k-space are acquired first to capture the generated contrast efficiently. After all samples in an interleaf are acquired within Tacq, the magnetization is allowed to return to equilibrium during an interval of duration Twait. Afterward, the magnetization preparation is repeated and the next interleaf is acquired.
Due to scan efficiency considerations, multiple phase encodes have to be acquired following a single magnetization preparation. Once all phase encodes in an interleaf are acquired, a wait time is inserted to insure recovery of the magnetization to equilibrium. Afterward, the magnetization preparation is repeated prior to acquiring the next interleaf.
Alternating-TR bSSFP
Reducing the fat signal is crucial for FIA angiography in the extremities. First of all, the fat signal is higher than the blood signal in bSSFP sequences because of the higher T2/T1 ratio of fat. The maximum-intensity projections will hence favor the fat pixels. Secondly, for certain values of the repetition time, fat and water signals have opposing phase. This leads to an underestimation of the water content in voxels partially occupied by both species. Finally, blood has to be the most significant source of signal in the angiograms to comply with the assumption of compressibility. Any unsuppressed fat signal will reduce the applicability of compressed sensing.
Given all of the preceding concerns, ATR bSSFP is an adequate fat suppression technique for this application. It uses two consecutive repetition times (TR1 and TR2) with potentially different durations and an appropriate phase cycling to create a broad stop-band around the fat-resonance (13). The data is usually acquired during the longer of the two intervals.
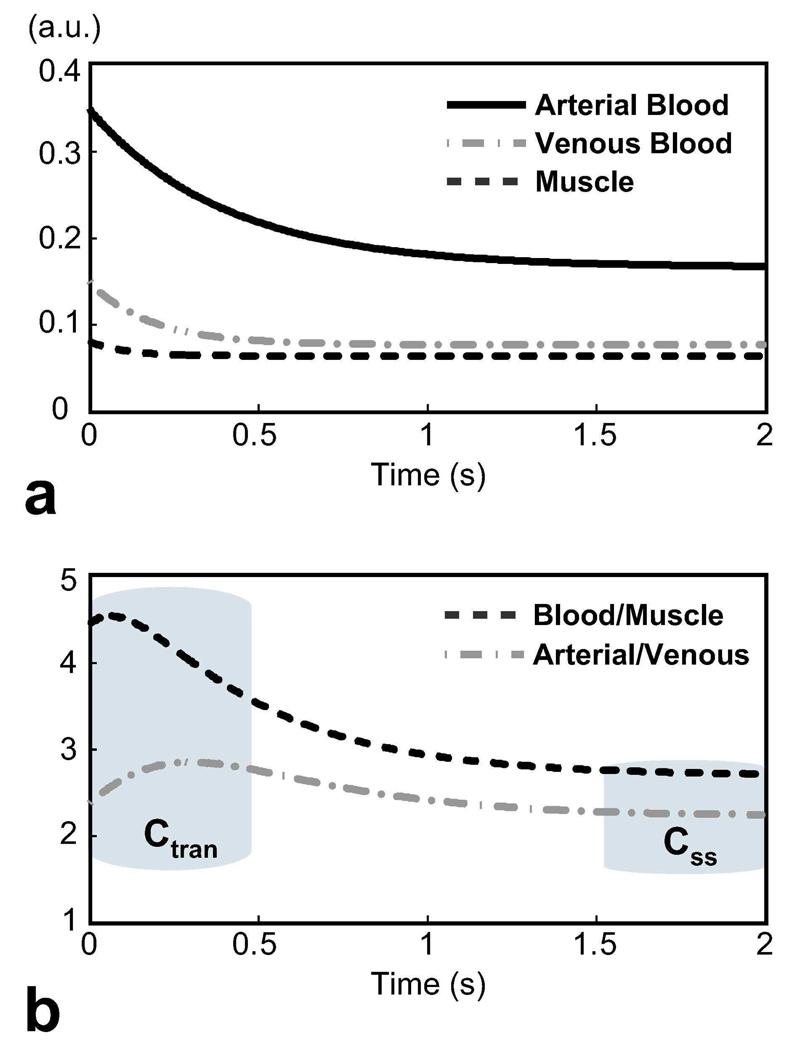
We can analyze the effect of magnetization preparation on ATR bSSFP by simulating the transient signal for various tissues. Figure 2 displays the on-resonance transient ATR bSSFP signal following T2-preparation for arterial blood, venous blood and muscle along with the arterial blood/muscle and arterial/venous contrast. The simulation was performed with the following parameters: α = 60°, TR1/TR2/TE = 3.45/1.15/1.725 ms, 80 ms T2-preparation time, and a 10-excitation catalyzation sequence assuming T1/T2 = 1200/200 ms for arterial blood (23, 24), 1200/80 ms for venous blood (23, 25), and 870/50 ms for muscle (26). The flip angle was chosen to maximize the steady-state blood/muscle contrast while maintaining a relatively low specific absorption rate. Afterward, the optimal T2-preparation time was determined to generate the highest initial blood/muscle signal difference (equivalent to blood/muscle contrast-to-noise ratio). The signal is higher and the T2-contrast is better at the beginning of the acquisition than in the steady state. The initial arterial blood/muscle contrast is approximately 4.5 as opposed to a value of 2.7 in the steady state. Similarly, the arterial/venous contrast reaches a value of 2.8 during the initial transient period, whereas it is roughly 2.2 in the steady state.
Figure 2.
a: The transient ATR bSSFP signal following T2-preparation for arterial blood (T1/T2 = 1200/200ms), venous blood (1200/80ms), and muscle (870/50ms). b: The resultant arterial blood/muscle and arterial/venous contrast. The initial blood-muscle contrast is Ctran ≈ 4.5, whereas the steady-state contrast is Css ≈ 2.7. The arterial-venous contrast, which also demonstrates T2-dependency, can be as high as 2.8 at the beginning of the acquisition, whereas it diminishes to a value of 2.2 in the steady-state.
Compressed Sensing
An image of size M is said to be sparse if it has only k non-zero values, where k ≪ M. It is said to be transform-sparse if there exists a linear transform such that the image has k ≪ M non-zero transform coefficients. For instance, a piece-wise constant image is transform-sparse, since it has a sparse edge map, which can be computed by spatial finite differences. Finally, an image of size M is considered compressible if it is well approximated by k ≪ M coefficients of a known transform (e.g., spatial finite differences, wavelet transform, or discrete cosine transform). Although real images are almost never sparse, i.e., have k strictly non-zero coefficients, they are often compressible.
Compressed sensing (CS) is a nonlinear sampling theory for sparse and compressible signals. The theory of CS, described in detail in Refs. (15,16,18), can be summarized into three basic requirements: (a) The sampled signal is sparse or compressible by some linear transform, i.e., it has a k-term approximation. (b) The sampling is incoherent, i.e., the usual linear reconstruction produces incoherent aliasing artifacts in the compression transform domain. (c) A nonlinear reconstruction enforces the sparsity/compressibility of the image and consistency with the acquired data. When these three requirements are met, an image can be reconstructed from a number of samples on the order of k rather than the usual order of M.
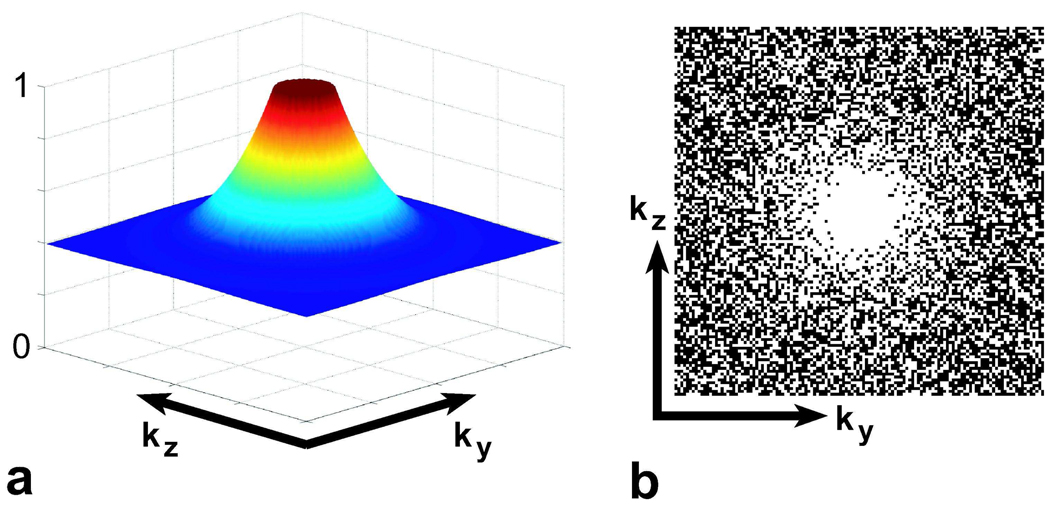
MR angiograms are compressible in the image domain and can be made even more compressible by computing spatial finite differences. Furthermore, random-sampling with a decreasing density toward the periphery of k-space as shown in Fig. 3 results in undersampling artifacts that appear as a noise-like interference in the reconstructed images. CS can remove this interference in MR angiograms acquired with variable-density random undersampling. One possible implication is the shortening of the total scan time. Alternatively, the time savings due to undersampling can be used to improve the image quality.
Figure 3.
a: The probability density function used for generating the randomly undersampled phase-encode mask, designed for undersampling by a factor of 2. The sampling density falls from a value of 1 at the center of k-space to 0.4 at the periphery. The fall-off is sharper and the peripheral sampling density is lower for higher undersampling factors. b: The phase-encode mask shows the resulting variable-density randomly undersampled trajectory. The samples corresponding to the black dots are not acquired.
The missing k-space samples can be recovered by solving the following optimization problem,
| (1) |
The first term ensures data consistency be forcing the ℓ2-norm difference of the reconstructed k-space, Fum, with the acquired k-space, y, to be small. The operator Fu indicates a partial Fourier operator, and m is the reconstructed image. The remaining terms minimize the ℓ1-norm of the reconstructed image along with the ℓ1-norm of the spatial finite differences of the image (also known as Total Variation, or simply TV) (18). The parameters λ1 and λ2 weight the relative contributions of these three terms. Minimizing the ℓ1-norm is associated with enforcing sparsity/compressibility (27). The CS reconstruction yields the best approximation in a certain basis consistent with the noisy measurements. This leads to a denoising-like effect when conditions for a good reconstruction are satisfied.
The optimization is solved using nonlinear conjugate gradients (18). The data are normalized to ensure the use of similar λ values for separate images. The acquired k-space data is first zero filled and density compensated. Afterward, the data is normalized such that the maximum voxel amplitude is unity in the image domain. To improve the convergence, λ values were monotonically decreased throughout the iterations until the consistency error was below the noise floor (28, 29). For the MR angiograms in this work, we observed that starting with an initial λ1 = 0.05, λ1 = 0.5λ2 trade-off, and halving the λ values after every 60 iterations yielded good reconstructions.
Improving Resolution and Contrast in FIA
Both the image resolution and contrast in FIA can be improved by simply prescribing adequate values for certain scan parameters, but at the expense of increased scan time. In order to improve the resolution while retaining the same field-of-view (FOV), more phase encodes have to be acquired. If the number of k-space segments is kept constant, this approach lengthens the acquisition window and degrades the contrast in addition to increasing the scan time. The scan time has to be further increased to generate a similar contrast to the lower resolution case.
To improve the image contrast, the magnetization has to be prepared more frequently. Because a mixture of transient and steady-state signal is captured, the image contrast is affected by the duration of the acquisition window following magnetization preparation. This effect can be enhanced by shortening the acquisition window and acquiring fewer phase encodes per interleaf. However, the scan efficiency will then be reduced because each repetition of the magnetization preparation requires time for the preparation itself and additional time for signal recovery.
Alternatively, FIA angiograms can be acquired with variable-density random undersampling in the phase-encode plane, and the resulting aliasing artifacts can be removed through compressed sensing. The scan time saved by decreasing the number of excitations can then be traded-off either to cover a larger extent in k-space or to increase the number of interleaves. The former will improve the image resolution, whereas the latter will generate more magnetization-prep-dominant contrast, which also increases the compressibility of the image and the efficiency of compressed sensing.
Analysis
In this section, we closely analyze the relations and trade-offs between undersampling, spatial resolution, contrast improvement and SNR. The independent variables in our analysis are δ, the spatial resolution of the image in the phase-encode directions, and N, the number of interleaves (equivalently, magnetization preparations). The important dependent variables are R, the required undersampling factor for keeping the total scan time constant, and Tacq, the effective time spent to acquire data per interleaf (including all excitation and gradient waveforms within a TR). For a constant total scan time, Tacq essentially determines the SNR efficiency of the sequence.
The total scan time (Tscan) is given by:
| (2) |
where the constants Tprep and Twait respectively denote the durations of the preparation and recovery intervals per interleaf, as defined in Fig. 1. Tacq is determined by the number of data points required for Nyquist-sampling in the phase-encode plane (Npe−nyq), the repetition time of the ATR sequence (TR = TR1 + TR2), and the undersampling factor (R):
| (3) |
Assuming an isotropic resolution, δ, and an isotropic field of view, FOVpe in the phase-encode plane, Npe−nyq is inversely proportional to the square of the resolution:
| (4) |
If we only want to improve the resolution, then the number of interleaves (which will affect the contrast) and the scan time are kept constant. This indicates that Tacq remains constant as well. On the other hand, Tacq decreases as we increase the number of interleaves to improve contrast. The percentage of time spent for data acquisition also decreases:
| (5) |
We can compute the undersampling factor required to maintain the same scan time for a given (N,δ) combination using Eqs. 2–4:
| (6) |
assuming good reconstructions can be achieved at this value of R. Although various different (N,δ) pairs can be prescribed with the same undersampling factor, the impact on the image SNR will vary. If we keep the resolution constant, then N linearly affects the data acquisition time. If we keep the same number of interleaves, then the total data acquisition time remains a constant. However, δ determines the voxel size in the two phase-encode directions. The dependency of the image SNR on N and δ can be expressed as below:
| (7) |
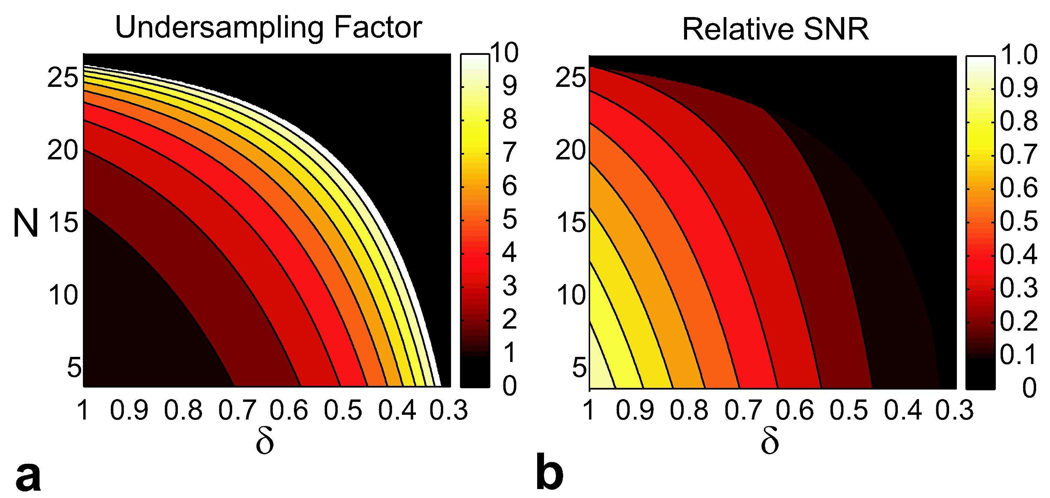
Simulations were performed to analyze the aforementioned trade-offs. Equations 3 and 5 were used to compute Tacq and %DAQ as a function the number of interleaves, for the following parameters: N ∈ [4,26], δ = 1 mm, FOVpe = 12.8 cm, TR = 4.6 ms, Tprep = 80 ms, Twait = 3 s, Tscan = 90 s (assuming N = 4 initially). The undersampling factor and relative SNR were also simulated for these parameters assuming δ ∈ [0.3,1] mm. The undersampling factor was constrained to a maximum of R = 10.
In Vivo Experiments
Lower leg angiograms were produced on a 1.5 T GE scanner with CV/i gradients using a single-channel transmit-receive extremity coil. The right-left and anterior-posterior axes were chosen as the phase-encode directions. The following scan parameters were prescribed: α = 60°, TR1/TR2/TE = 3.45/1.15/1.73 ms for ATR bSSFP, 19.2 cm FOV, ±125 kHz bandwidth, 80 ms T2-preparation time, a 4-excitation ramp catalyzation, and 3 s recovery time between the interleaves. For undersampled acquisitions, a sampling density decreasing toward the edge of k-space was designed to yield the desired undersampling factor as shown in Fig. 3. This density was used as a probability density function to create a randomly undersampled trajectory (18). Zero-filled and compressed-sensing reconstructions were performed on the data. For the former case, data were reconstructed with a conventional Fast Fourier Transform (30) following sampling-density compensation in the phase-encode plane. The data were zero-padded to improve the performance of the maximum-intensity projection (MIP) and the depiction of the vasculature.
To demonstrate the use of CS to improve resolution with extended k-space coverage, fully-sampled (1X) and randomly undersampled (2X and 4X) lower leg angiograms were produced. A total of 4 interleaves were used. The Nyquist-sampled encoding matrices corresponding to the 1X, 2X, and 4X acquisitions were: 192×96×96, 192×128×128, and 192×192×192. These values yielded the following resolutions: 1×1.4×1.4 mm3, 1×1×1 mm3, and 1×0.7×0.7 mm3. The scan times were less than 52 s for all acquisitions. Prior to computing the MIPs, the data were zero-padded to a matrix size of 384 × 256 × 256.
Fully-sampled FIA angiograms of the lower leg were acquired to demonstrate the improvement in contrast and compressibility with increased number of interleaves. With respect to the previous experiment, the scan prescription was slightly modified: 1 mm isotropic resolution and 192×128×128 encoding. The prescribed number of interleaves (N) are listed along with the number of phase encodes per interleaf: 4 (4096 encodes), 8 (2048), 12 (1365), 16 (1024), 22 (745), and 26 (630). Two separate measures were used to assess the compressibility of the angiograms. The images were initially transformed by computing the spatial finite differences between neighboring pixels, and the ℓ1-norm of the finite-differences coefficients (i.e., the total variation of the image) was used as a reasonable first measure. Afterward, iterative least-squares reconstructions were performed to recover an approximation to the original image from a subset of the largest transform coefficients (18). The number of coefficients in the subset was gradually reduced. With increased compressibility, fewer coefficients should be sufficient for image recovery. We measured the mean-square error (MSE) per pixel between the original acquisition and the recovered image as a function of the number of coefficients. Then, we qualitatively determined the highest MSE that visually preserved the image structure of the original acquisition. The number of coefficients that yielded this MSE was used as another measure of compressibility.
To demonstrate the use of CS to enhance contrast with more frequent repetition of magnetization preparation, fully-sampled (1X) and randomly undersampled (2X, 4X, and 6X) lower leg angiograms were acquired. The scan parameters from the previous experiment were used. The number of interleaves and the corresponding number of phase encodes per interleaf for the 1X, 2X, 4X, and 6X acquisitions were: 4 (4096 encodes), 16 (512), 22 (186), 24 (114). These acquisitions had comparable scan times of less than 1 min 30 s. As a reference, fully-sampled angiographic data were also collected in the absence of magnetization preparation within 1 min 15 s. The data were zero-padded to a matrix size of 384×256×256 to perform the MIPs.
To quantitatively compare the contrast improvement between the acquired angiograms, the mean signal levels were measured in identical regions of the source images. The arterial blood signal was measured in the anterior/posterior tibial and peroneal arteries. Regions around these arteries were selected to measure the muscle signal. Meanwhile, the venous signal measurements were performed on the distal portions of the posterior tibial and peroneal veins. The selected regions had a minimum of approximately 250 pixels.
Results
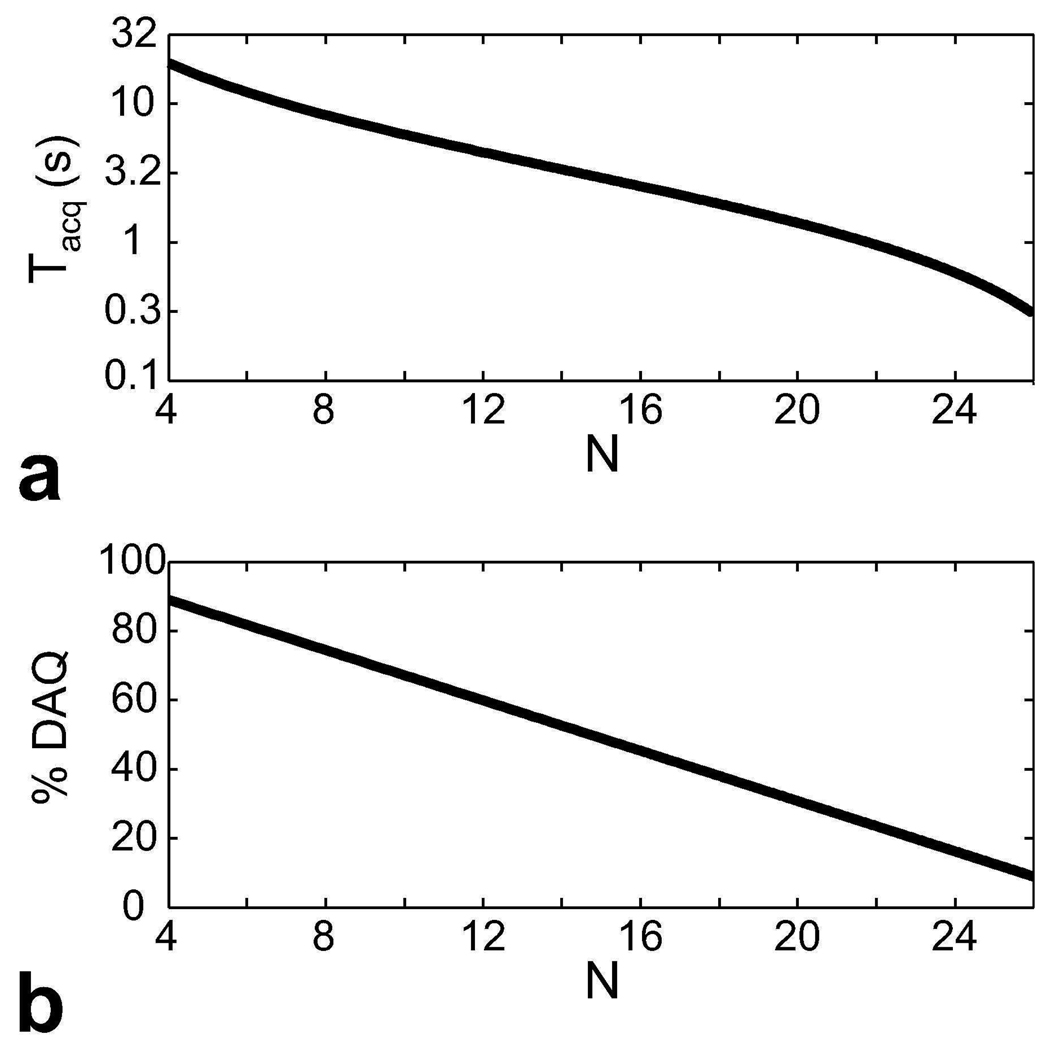
The simulation results shown in Fig. 4 demonstrate the effect of the number of interleaves on the duration of the data acquisition window per interleaf and the overall scan efficiency. The initial increase in N leads to a significant reduction of Tacq, which intensifies the effect of magnetization preparation on image contrast. Nevertheless, further increments have a smaller effect on Tacq. In the meantime, the scan efficiency linearly decreases with N because more time is spent preparing the magnetization.
Figure 4.
a: The duration of the data acquisition window (Tacq) following each magnetization preparation is plotted in logarithmic scale as a function of the number of interleaves (N). For a constant scan time, savings from undersampling of the phase encodes can be used to increase N and shorten Tacq. b: The percentage of scan time spent for actually acquiring data is shown as a function of N. There is a linear relation between N and the total time required for preparing the magnetization and allowing it to recover to equilibrium. Therefore, a linear fall-off in the percentage is observed.
Figure 5 displays the contour plots of the undersampling factor and the relative SNR as a function of the number of interleaves (N) and the in-plane resolution (δ) for a fixed scan time. Assuming the undersampling factor is incremented in integer steps, the initial increase from 1X to 2X yields significant improvements in N and δ. However, the additional scan time savings and the corresponding levels of improvement are reduced for the following increments. Furthermore, the relative image SNR decreases for larger N and smaller δ as expected.
Figure 5.
Additional scan time is required for increasing the number of interleaves (N) or reducing the voxel size in the phase-encode dimensions (δ). If the overall scan time is to be maintained, then the data acquisition has to be accelerated by undersampling. a: A contour plot showing the corresponding undersampling factor for a range of (N,δ) values. δ denotes relative linear dimension. b: A contour plot of the relative SNR for the same range of (N,δ) values. Increasing N reduces the data acquisition time, and reducing δ decreases the voxel size. Both factors diminish the SNR.
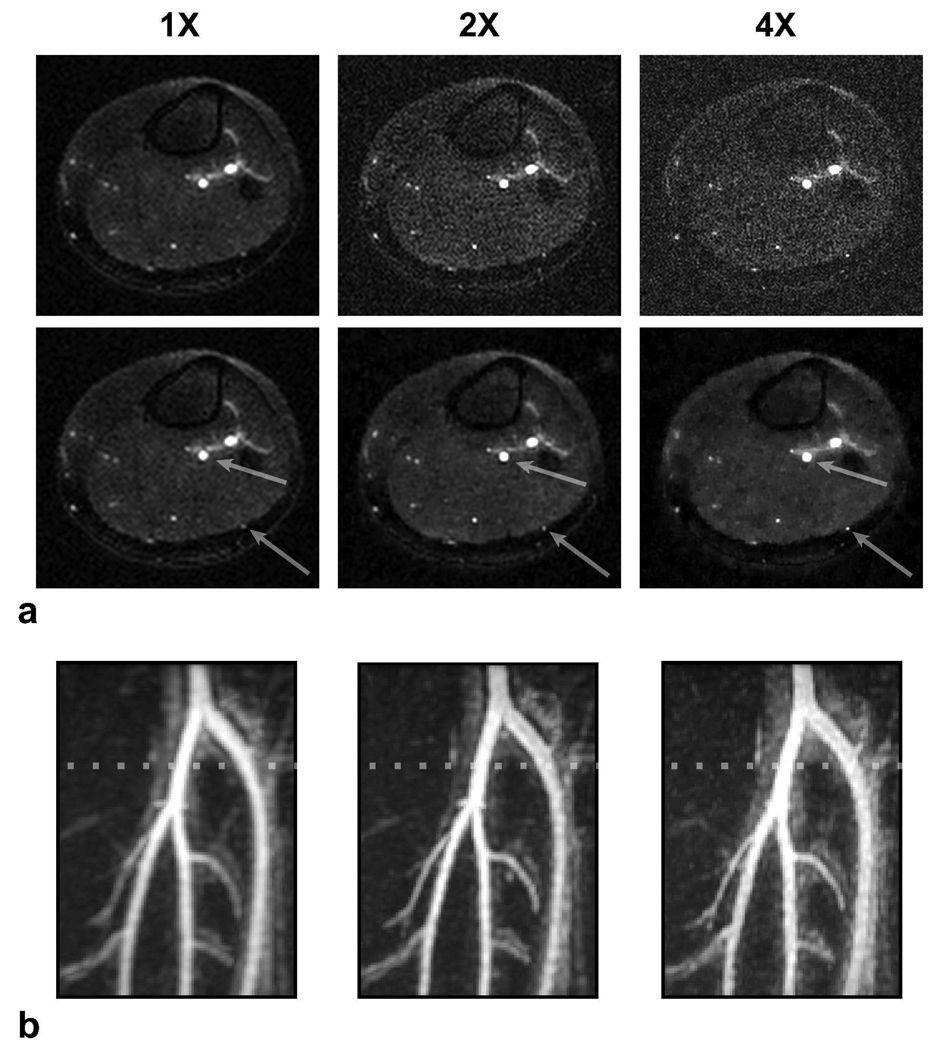
With the undersampled FIA acquisition extending the k-space coverage, the resolution in the phase-encode plane is improved from 1.4 × 1.4 mm2 to 1 × 1 mm2 with 2X, and to 0.7 × 0.7 mm2 with 4X undersampling. These improvements reduce the voxel size and partial volume effects, and enhance the overall quality of the MIPs. Figure 6 compares the fully-sampled low-resolution and undersampled high-resolution acquisitions. While the datasets demonstrate very similar tissue contrast, the compressed-sensing images exhibit improved edges and better visualization of the small vessels. Because the vessel boundaries are mostly defined in the phase-encode plane, the improved resolution significantly enhances the quality of the angiograms.
Figure 6.
To demonstrate improved resolution, lower leg angiograms were produced with 1X, 2X, and 4X undersampling factors. The corresponding resolutions in the phase-encode plane were: 1.4×1.4 mm2, 1.0×1.0 mm2, and 0.7×0.7 mm2. a: Axial slices from the acquisitions are shown. Zero-filled and compressed-sensing reconstructions are in the top and bottom rows respectively. As the resolution improves with higher undersampling factors, depiction of the small vessels and the visualization of vessel boundaries are enhanced. The arrows point to the regions where the effects of improved resolution can be clearly observed. b: The corresponding zoomed-in MIPs of the popliteal trifurcation based on CS better demonstrate the difference in resolution. The vessels in the fully-sampled image have a blurry appearance, whereas they look sharper in the undersampled acquisitions. The dotted line marks the location of the slices displayed in a. It should be noted that ℓ1-based CS reconstructions reduce the signal from very small vessels with poor contrast, and this effect becomes more noticeable at greater undersampling factors.
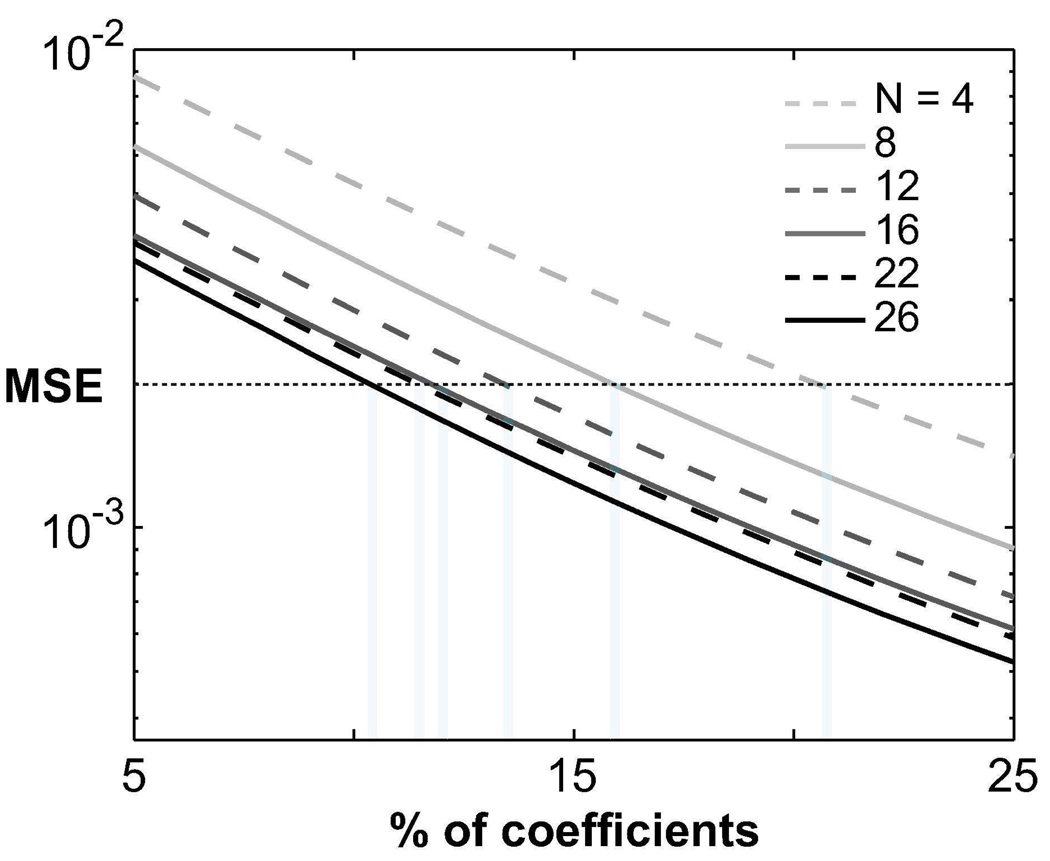
The fully-sampled angiograms with increased numbers of interleaves (N) demonstrate improved arterial/venous and blood/muscle contrast as listed in Tab. 1. The contrast values show an approximately linear dependence with N. The corresponding total-variation (TV) values are also listed in Tab. 1 as a function of N. The TV values decrease for larger N, indicating an improvement in compressibility. Figure 7 shows the mean-square error (MSE) per pixel between the original acquisition and the recovered image as a function of the number of coefficients. The MSE threshold that preserves the image structure is reached with a smaller number of coefficients for larger N, indicating increased compressibility.
Table 1.
Fully-sampled acquisitions were repeated with increased number of interleaves. The total variation (TV) was measured along with the arterial/venous and blood/muscle contrast as a function of the number of interleaves. More frequent repetition of magnetization preparation improves the arterial/venous and blood/muscle contrast. It also decreases the TV of the image, a reasonable measure of image compressibility and reconstruction quality for the comparison between the angiograms.
| Interleaves | 4 | 8 | 12 | 16 | 22 | 26 |
|---|---|---|---|---|---|---|
| Arterial/venous contrast | 1.65 | 1.80 | 1.97 | 2.13 | 2.40 | 2.65 |
| Blood/muscle contrast | 2.40 | 3.06 | 3.25 | 3.97 | 4.51 | 4.64 |
| Total Variation | 1.00 | 0.92 | 0.88 | 0.83 | 0.74 | 0.70 |
Figure 7.
Improvement in compressibility as a function of the number of magnetization preparations (interleaves). Fully-sampled acquisitions with various numbers of interleaves were performed. A finite-differences transform was computed on each acquisition. Afterward, an iterative least-squares reconstruction was used to recover an approximation to the image from a subset of the largest transform coefficients. With improved compressibility, fewer coefficients should be sufficient for image recovery. The normalized mean-square error (MSE) per pixel between the original acquisition and the recovered image is shown as a function of the number of coefficients in the subset. The horizontal dotted line indicates an MSE threshold which was qualitatively determined to preserve the image structure of the original acquisition. For larger N, a smaller percentage of the coefficients can be retained while keeping the MSE below this threshold due to improved compressibility. Regardless of the number of samples, the MSE becomes smaller as N is increased. It is also important to note that the incremental reduction in the MSE saturates around N ≈ 20, indicating an upper limit on the background suppression achievable with magnetization preparation.
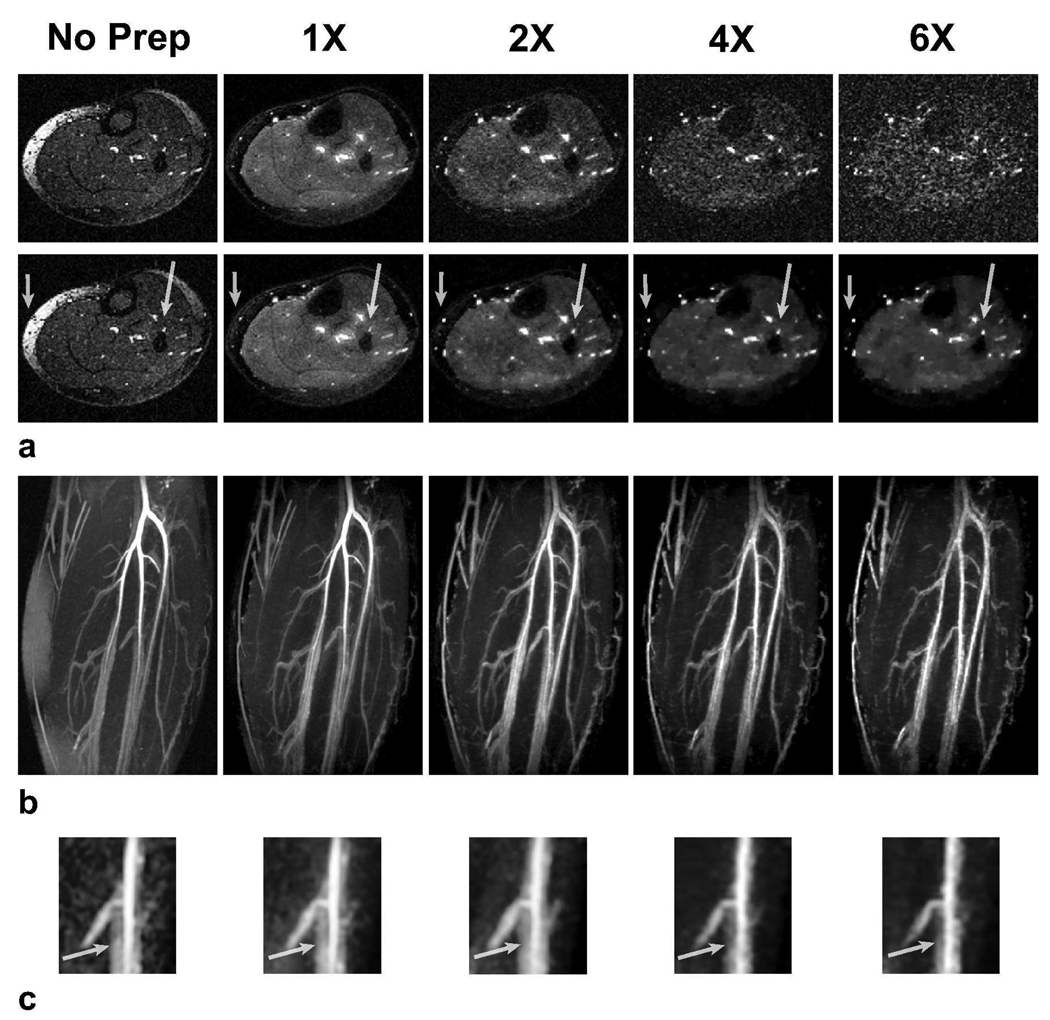
Undersampled ATR bSSFP lower leg angiograms produced with increased numbers of magnetization preparations are displayed in Fig. 8 along with a reference angiogram without any magnetization preparation. The number of interleaves is increased from 4 with 1X, to 16 with 2X, 22 with 4X and 24 with 6X undersampling. The T2-weighting in the accelerated acquisitions is intensified with more frequent repetition of T2-preparation and the decreased number of phase encodes per interleaf. Therefore, the compressed-sensing image exhibits higher arterial blood/muscle and arterial/venous contrast. In addition, T2-preparation significantly reduces the remnant fat signal compared with the reference angiogram (no preparation).
Figure 8.
To demonstrate enhanced contrast, T2-prepared lower leg angiograms were produced with 1X, 2X, 4X, and 6X undersampling factors. The corresponding numbers of interleaves were: 4, 16, 22, and 24. Fully-sampled angiographic data were also collected without magnetization preparation as a reference. a: Axial slices from the acquisitions are shown. Zero-filled and compressed-sensing reconstructions are in the top and bottom rows respectively. With higher undersampling factors, magnetization preparation is repeated more frequently. T2-dependent arterial/venous and blood/muscle contrast are significantly improved. It is important to note that the remnant fat signal in the angiogram without any preparation is also reduced with the use of T2-preparation. The arrows point to the regions where the enhanced contrast improves the angiograms. b: The corresponding targeted MIPs based on CS demonstrate improved background suppression with greater undersampling. The dotted line marks the location of the slices displayed in a. Again, a couple of very small vessels with poor contrast gradually disappear in the CS reconstructions as the undersampling factor is increased. c: A zoomed-in portion of thin-slab MIPs (over 5 slices) of the images showing adjacent arterial and venous signal. The arrows point the regions where the venous suppression improves with greater undersampling.
Table 2 lists the measured contrast values. Comparing the pure steady-state and initially T2-prepared signals, the theoretically predicted improvements are 68% in blood/muscle and 28% in arterial/venous contrast. While the measured improvements at 1X and 2X undersampling are below these estimates, the values at 4X and 6X are in general agreement with the theoretical predictions. This is expected since the increased number of magnetization preparations lead to more T2-dominant contrast at greater undersampling factors. Although the measured improvement in arterial/venous contrast is somewhat higher than the theoretical estimate, this difference could be resulting from variations in T1 and T2 of arterial and venous blood. In addition, the signal from lower-contrast venous blood could be further reduced by the CS reconstruction, which is a common trait of ℓ1-based techniques.
Table 2.
The arterial/venous and blood/muscle contrast values are listed for angiograms produced with T2-preparation for undersampling factors of 1X (full-acquisition), 2X, 4X, and 6X. As a reference, the contrast values were also measured on a fully-sampled angiogram acquired without any magnetization preparation. The percentage improvement over this angiogram with pure bSSFP contrast are also shown. Since the scan time saved is greater at higher undersampling factors, the magnetization preparation is repeated more frequently. This improves the T2-dependent arterial/venous and blood/muscle contrast.
| Acceleration | No prep | 1X | 2X | 4X | 6X |
|---|---|---|---|---|---|
| Arterial/venous contrast | 1.51 | 1.66 | 1.79 | 2.29 | 2.39 |
| % improvement | - | 9.93 | 18.54 | 51.66 | 58.28 |
| Blood/muscle contrast | 2.58 | 2.67 | 3.76 | 4.48 | 4.58 |
| % improvement | - | 3.49 | 45.74 | 73.64 | 77.52 |
Discussion
Flow-independent angiograms of the extremities can be acquired with SNR-efficient bSSFP. To reduce background signals from tissues such as muscle and fat, a magnetization-prepared 3D ATR bSSFP sequence can be used, segmenting k-space into several interleaves with centric phase-encode ordering. However, higher resolution datasets and improved blood-to-background contrast are desirable depending on application-specific needs. The former reduces partial volume effects, and leads to better visualization of the small vasculature and vessel boundaries. The latter reduces the probability of blood vessels being masked by background tissues.
The quality of the FIA angiograms may be limited by the fundamental trade-off between scan efficiency and the achievable resolution/contrast. In this work, we have employed compressed-sensing reconstructions with a total-variation penalty to remove the interference in undersampled images with improved resolution/contrast. A wide range of combined resolution and contrast enhancements are viable with the proposed method, giving the ability to adjust to application-specific needs.
Higher undersampling factors can be used to attain additional improvements; however, the incremental time savings diminish exponentially. In addition, the SNR loss due to the reduced data acquisition time and/or voxel size will limit the performance of the method. Finally, we begin to lose information above certain accelerations, and the reconstruction accuracy is compromised. These considerations place an upper limit on the achievable undersampling factor.
The reconstructions based on ℓ1-norm can have several effects on the image morphology. First, the coefficient intensities can be under-estimated as well documented in the literature. This under-estimation, also referred to as the shrinkage of coefficients, can reduce the image contrast. This effect becomes more significant with increasing ℓ1-penalty (controlled by λ). Because we use relatively small λ values in our reconstructions, the resulting shrinkage is small. The reconstructions can also further reduce the size and contrast of small vessels with initially weak contrast; however, only a number of very small vessels with poor contrast were affected as seen in Fig. 6 and Fig 8. At higher accelerations (e.g., above 4X with the linear extremity coil), certain small vessels may become indistinguishable from the increased background noise if they have a comparable size to the image voxels.
There are several potential modifications of the proposed method. First of all, other fat suppression techniques can be used; however, the fat signal has to be reduced as much as possible in order not to violate the sparsity/compressibility requirement for compressed-sensing reconstructions. In other words, techniques that remove the fat signal with post-processing of the data will be suboptimal for this application.
Parallel imaging is a well-established alternative for accelerating MR acquisitions (31–33), which exploits the redundancy of coil-array data. However, parallel imaging does not take advantage of the inherent compressibility of MR angiograms. Although higher contrast and resolution improve the compressibility of images with CS, the achievable undersampling factor strongly depends on the coil hardware for parallel imaging. In contrast to CS, parallel imaging techniques will be less effective in the absence of dedicated coils. Furthermore, parallel imaging reconstructions suffer from an additional SNR loss due to the geometry factor of the coil (32). Nevertheless, higher undersampling factors might be achieved if image compressibility and spatial encoding from coil sensitivities are exploited simultaneously.
Conclusion
The quality of FIA angiograms are improved by increasing the resolution with extended k-space coverage and/or enhancing the contrast with more frequent magnetization preparation. Meanwhile, the scan time is kept constant through variable-density undersampling of the phase encodes. The resulting incoherent undersampling artifacts are removed with a compressed-sensing reconstruction exploiting image compressibility. In general, the proposed technique can be used to better capture magnetization-prepared contrast with the scan efficiency of bSSFP.
Acknowledgments
This work was supported by National Institutes of Health (NIH) under Grant R01 HL039297, Grant R01 HL075803 and by GE Healthcare. The work of Tolga Çukur was supported by a Rambus Corporation Stanford Graduate Fellowship.
References
- 1.Marckmann P, Skov L, Rossen K, Dupont A, Damholt MB, Heaf JG, Thomsen HS. Nephrogenic systemic fibrosis: suspected causative role of gadodiamide used for contrast-enhanced magnetic resonance imaging. J Am Soc Nephrol. 2006;17:2359–2362. doi: 10.1681/ASN.2006060601. [DOI] [PubMed] [Google Scholar]
- 2.Grobner T. Gadolinium a specific trigger for the development of nephrogenic fibrosing dermopathy and nephrogenic systemic fibrosis? Nephrol Dial Transplant. 2006;21:1104–1108. doi: 10.1093/ndt/gfk062. [DOI] [PubMed] [Google Scholar]
- 3.Axel L, Morton D. MR flow imaging by velocity-compensated/uncompensated difference images. J Comput Assist Tomogr. 1987;11:31–34. doi: 10.1097/00004728-198701000-00006. [DOI] [PubMed] [Google Scholar]
- 4.Dumoulin CL, Souza PS, Walker MF, Wagle W. Three-dimensional phase contrast angiography. Magn Reson Med. 1989;9:139–149. doi: 10.1002/mrm.1910090117. [DOI] [PubMed] [Google Scholar]
- 5.Marchal G, Bosmans H, Fraeyehoven LV, Wilms G, Hecke PV, Plets C, Baert AL. Intracranial vascular lesions: optimization and clinical evaluation of three-dimensional time-of-flight MR angiography. J Am Soc Nephrol. 1990;175:443–448. doi: 10.1148/radiology.175.2.2326471. [DOI] [PubMed] [Google Scholar]
- 6.Nishimura DG. Time-of-flight MR angiography. Magn Reson Med. 1990;14:194–201. doi: 10.1002/mrm.1910140206. [DOI] [PubMed] [Google Scholar]
- 7.Pike GB, Hu BS, Glover GH, Enzmann DR. Magnetization transfer time-of-flight magnetic resonance angiography. Magn Reson Med. 1992;25:372–379. doi: 10.1002/mrm.1910250217. [DOI] [PubMed] [Google Scholar]
- 8.Wright GA, Nishimura DG, Macovski A. Flow-independent magnetic resonance projection angiography. Magn Reson Med. 1991;17:126–140. doi: 10.1002/mrm.1910170117. [DOI] [PubMed] [Google Scholar]
- 9.Brittain JH, Olcott EW, Szuba A, Gold GE, Wright GA, Irarrazaval P, Nishimura DG. Three-dimensional flow-independent peripheral angiography. Magn Reson Med. 1997;38:343–354. doi: 10.1002/mrm.1910380302. [DOI] [PubMed] [Google Scholar]
- 10.Gronas R, Kalman PG, Kucey DS, Wright GA. Flow-independent angiography for peripheral vascular disease: Initial in-vivo results. J Magn Reson Imaging. 1997;7:637–643. doi: 10.1002/jmri.1880070405. [DOI] [PubMed] [Google Scholar]
- 11.Bangerter NK, Hargreaves BA, Brittain JH, Hu B, Vasanawala SS, Nishimura DG. 3D fluid-suppressed T2-prep flow-independent angiography using balanced SSFP. Proceedings of the 12th Annual Meeting of ISMRM; Kyoto. 2004. p. 11. [Google Scholar]
- 12.Hargreaves BA, Vasanawala SS, Nayak KS, Hu BS, Nishimura DG. Fat-suppressed steady-state free precession imaging using phase detection. Magn Reson Med. 2003;50:210–213. doi: 10.1002/mrm.10488. [DOI] [PubMed] [Google Scholar]
- 13.Leupold J, Hennig J, Scheffler K. Alternating repetition time balanced steady state free precession. Magn Reson Med. 2006;55:557–565. doi: 10.1002/mrm.20790. [DOI] [PubMed] [Google Scholar]
- 14.Cukur T, Lee JH, Bangerter NK, Hargreaves BA, Nishimura DG. Comparison of phase-sensitive and alternating repetition time SSFP for flow-independent peripheral angiography. Proceedings of the 15th Annual Meeting of ISMRM; Berlin. 2007. p. 178. [Google Scholar]
- 15.Candes E, Romberg J, Tao T. Robust uncertainty principles: Exact signal reconstruction from highly incomplete frequency information. IEEE Trans Inf Theory. 2006;52:489–509. [Google Scholar]
- 16.Donoho D. Compressed sensing. IEEE Trans Inf Theory. 2006;52:1289–1306. [Google Scholar]
- 17.Block KT, Uecker M, Frahm J. Undersampled radial MRI with multiple coils. Iterative image reconstruction using a total variation constraint. Magn Reson Med. 2007;57:1086–1098. doi: 10.1002/mrm.21236. [DOI] [PubMed] [Google Scholar]
- 18.Lustig M, Donoho D, Pauly JM. Sparse MRI: The application of compressed sensing for rapid MR imaging. Magn Reson Med. 2007;58:1182–1195. doi: 10.1002/mrm.21391. [DOI] [PubMed] [Google Scholar]
- 19.Gamper U, Boesiger P, Kozerke S. Compressed sensing in dynamic MRI. Magn Reson Med. 2008;59:365–373. doi: 10.1002/mrm.21477. [DOI] [PubMed] [Google Scholar]
- 20.Nezafat R, Derbyshire JA, Ouwerkerk R, Stuber M, McVeigh ER. Spectrally selective B1 insensitive T2 preparation sequence for 3T imaging. Proceedings of the 14th Annual Meeting of ISMRM; Seattle. 2006. p. 596. [Google Scholar]
- 21.Nishimura DG, Vasanawala SS. Analysis and reduction of the transient response in SSFP imaging. Proceedings of the 8th Annual Meeting of ISMRM; Denver. 2000. p. 301. [Google Scholar]
- 22.Korin HW, Riederer SJ, Bampton AEH, Ehman RL. Altered phase encoding order for reduced sensitivity to motion corruption in 3DFT MR imaging. J Magn Reson Imaging. 1992;2:687–693. doi: 10.1002/jmri.1880020613. [DOI] [PubMed] [Google Scholar]
- 23.Greenman RL, Shirosky JE, Mulkern RV, Rofsky NM. Double inversion black-blood fast spin-echo imaging of the human heart: A comparison between 1.5T and 3.0T. J Magn Reson Imaging. 2003;17:648–655. doi: 10.1002/jmri.10316. [DOI] [PubMed] [Google Scholar]
- 24.Derbyshire JA, Herzka DA, McVeigh ER. S5FP: spectrally selective suppression with steady state free precession. Magn Reson Med. 2005;54:918–928. doi: 10.1002/mrm.20633. [DOI] [PMC free article] [PubMed] [Google Scholar]
- 25.Gallix BP, Lichere CA, Dauzat M, Bruel JM, Lopez FM. Flow-independent magnetic resonance venography of the calf. J Magn Reson Imaging. 2003;17:421–426. doi: 10.1002/jmri.10273. [DOI] [PubMed] [Google Scholar]
- 26.Bernstein MA, King KF, Zhou XJ. “Handbook of MRI pulse sequences”. 1st ed. Burlington, MA: Elsevier Academic Press; 2004. [Google Scholar]
- 27.Donoho D. For most large underdetermined systems of equations, the minimal ℓ1-norm near-solution approximates the sparsest near-solution. Comm Pure Appl Math. 2006;59:907–934. [Google Scholar]
- 28.Fadili MJ, Starck JL, Murtagh F. Inpainting and zooming using sparse representations. The Computer Journal. 2007 bxm055. [Google Scholar]
- 29.Uecker M, Hohage T, Block KT, Frahm J. Image reconstruction by regularized nonlinear inversion - Joint estimation of coil sensitivities and image content. mrm. 2008;60:674–682. doi: 10.1002/mrm.21691. [DOI] [PubMed] [Google Scholar]
- 30.Cooley JW, Tukey OW. An algorithm for the machine calculation of complex Fourier series. Math Comput. 1965;19:297–301. [Google Scholar]
- 31.Sodickson DK, Manning WJ. Simultaneous acquisition of spatial harmonics (SMASH): Fast imaging with radiofrequency coil arrays. Magn Reson Med. 1997;38:591–603. doi: 10.1002/mrm.1910380414. [DOI] [PubMed] [Google Scholar]
- 32.Pruessmann KP, Weiger M, Scheidegger MB, Boesiger P. SENSE: Sensitivity encoding for fast MRI. Magn Reson Med. 1999;42:952–962. [PubMed] [Google Scholar]
- 33.Griswold MA, Jakob PM, Heidemann RM, Nittka M, Jellus V, Jianmin W, Kiefer B, Haase A. Generalized autocalibrating partially parallel acquisition. Magn Reson Med. 2002;47:1202–1210. doi: 10.1002/mrm.10171. [DOI] [PubMed] [Google Scholar]


