Abstract
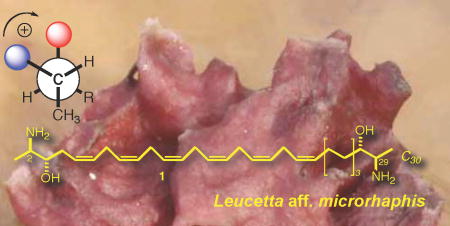
The configuration of leucettamol A (1), a known long-chain ‘two-headed’ sphingolipid (dimeric sphingolipid) from the marine sponge Leucetta microrhaphis, was determined by conversion to an N,N’,O,O’-tetrabenzoyl derivative, measurement of the exciton coupled circular dichroism spectrum (ECCD) and quantitative analysis by deconvolution of superposed exciton couplets. Contrary to the earlier assignment that claimed leucettamol A (1) was racemic, the CD approach unambiguously reveals the natural product is chiral, optically active and displays pseudo-C2 symmetry. The configuration of each end of the chain has erythro stereochemistry with an absolute configuration of 2R,3S,28S,29R. We show that deconvolution ECCD reliably predicts erythro versus threo vicinal aminoalcohols in all cases with greater sensitivity (< 5 nanomole) compared to 1H NMR J based methods, provides verification of optical purity, and unequivocal elucidation of absolute configuration in this difficult class of natural products.
Leucettamols A (1) and B (2) are long-chain bifunctionalized sphingolipids reported by Kong and Faulkner from Leucetta microrhaphis from Palau. 1 Dimeric sphingolipids (DS’s) are comprised of long-chain C28-C30 vicinal aminoalcohols or 2-amino-1,3-alkanediols that are related to sphingosine (3). Analogs of d-sphingosine and phytosphingosine, including their ceramides, are commonly encountered in marine invertebrates, but bifunctionalized sphingolipids (dimeric bis-α,ω-aminoalcohols) are rare and, so far, have been reported only from marine sponges. In addition to 1 and 2, the known members include rhizochalin (4) from Rhizochalina incrustata from Madagascar,2 oceanapiside (5) 3 and oceanalin A4 from two different species of Oceanapia from Australia, calyxoside (7) from Calyx sp. from Sulawesi,5 rhizochalins C (8) and D (9),6 and a compound named BSR1 (10) from an unidentified sponge,7a and L. microrhaphis,7b both from the Great Barrier Reef. DS’s display a range of biological activity: 4 exhibits weak antibacterial activity against Staphylococcus aureus and cytotoxic activity against mouse Ehrlich carcinoma cells.1a The glucoside (7) induces DNA-damage in cells and inhibits protein kinase C.3 Significantly, the aglycone 5a of oceanapiside shows approximately ten-fold greater antifungal activity against the pathogenic Fluconazole-resistant yeast Candida glabrata,2a, than monomeric vicinal aminoalcohols such as 3, implying amplification of activity through a multivalent effect.8 Leucettamol A (1) has recently been shown to inhibit the Ubc13-Uev1A ubiquitin conjugating enzyme complex.9
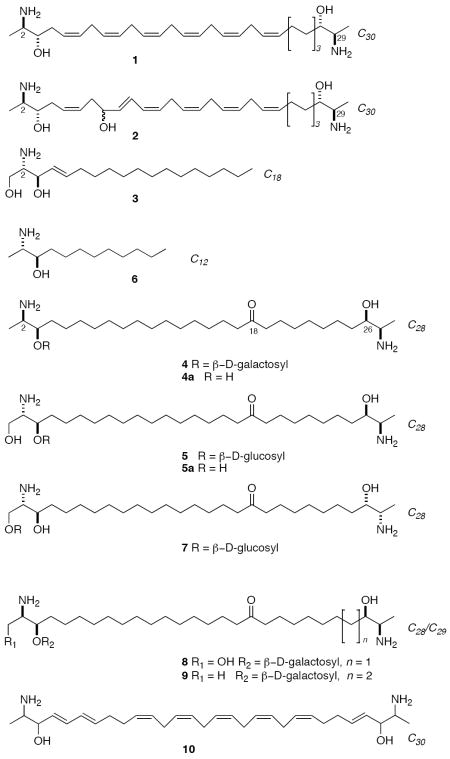
Analysis of the stereostructure of DS’s presents interesting challenges. The biosynthesis of DS’s display stereochemical heterogeneity between sponges; each terminus may be elaborated with the same or different relative and absolute configurations. Since there are four stereogenic centers in each DS, the maximum number of possible stereoisomers is 16. If the biosynthesis of DS’s follows the well-established pathways for sphingosine and phytosphingosine, the first step is predicted to be condensation of alanine or serine with an activated fatty acyl precursor, with concomitant decarboxylation followed by reduction. The products are 2-aminoalkanols or 2-amino-1,3-alkanediols, respectively, with either threo and erythro relative configuration and (S)- or (R)- absolute configuration (with respect to the α-amino acid). Nevertheless, the biosynthesis is not stereo-random. Each species of sponge appears to produces a limited number of DS analogs but always with only one stereostructure, but this configuration may differ in compounds from different sponges.
Two claimed exceptions to this motif are 1 and 2 that were each described as “an optically inactive…oil”. Based on analysis of relative configuration of 1 and a specific rotation of [α]D = 0, the authors conclude, “it must be assumed that leucettamol A…is racemic”.10 Since we were aware that low specific rotations were characteristic of natural long-chain dimeric aminoalcohols, and enzyme-catalyzed C-C bond formation in sphingosine is highly enantiospecific, this anomaly may be explained if the leucettamols were actually chiral and optically pure but of very low rotatory power. Fortuitous procurement of a sample of 1 by reisolation from Leucetta aff. microrhaphis (Haekel, 1872), collected in Indonesia, allowed us to make a complete configurational assignment of 1 and 2 which is the subject of this report.
Exciton coupled circular dichroism (ECCD) between vicinal dibenzoates is a powerful non-empirical method for assignment of absolute configuration of glycols,11 and also cyclic11b and acyclic aminoalcohols11b including ‘picomole’ scale stereochemical analyses of sphingosine and phytosphingosines.11d Based upon this work, we devised a method for quantitative ECCD to assign all four stereocenters in DS’s simultaneously3b that takes advantage of pair-wise exciton couplings between vicinal pairs of benzamide-benzoate chromophores (Figure 1). Stereochemical assignment requires a single CD measurement of the corresponding perbenzoyl derivative, only requiring samples as low as 5 nmole, but effectively deconvolutes the superposed exciton couplings between as many as six vicinal N,O-dibenzoyl pair-wise interactions with nanomolar sensitivity. The method readily converges upon a unique stereochemical assignment and was used by one of us (T.F.M) to assign 5,3b 4,2c, 6,12 8 and 9,5 and by Kingston and co-workers to assign 7.5 Applying this method, we now report that 1 is not racemic as first suggested, but an optically active compound with pseudo-C2 symmetry.
Figure 1.
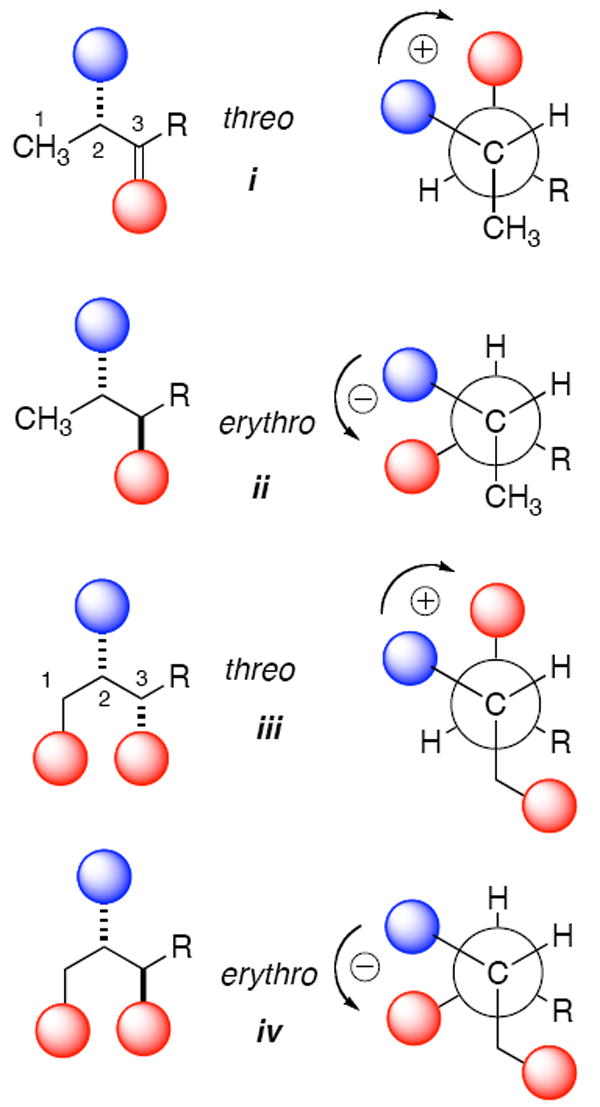
Representations of major conformers contributing to exciton coupling CD11a in threo and erythro isomers of N,O-arenecarboxy derivatives of 2-amino-3-alkanols (i and ii) and 2-amino-1,3-alkanediols (iii and iv). Blue shaded spheres represent N-arenecarboxamide chromophores and red spheres are O-arenecarboxylate chromophores (e.g. arenecarboxy = Ph(CO)O, benzoate, λmax ~228 nm). A positive exciton coupling (+ sign) is defined by a split Cotton effect with a maximum CD signal at longer wavelengths and minimum at shorter wavelengths. Contributions to ECCD from the primary C-1 chromophore (e.g. benzoate) in compounds iii and iv modulate the fine structure and intensity of the split Cotton effect but the signs remain the same as their respective counterparts i and ii. The enantiomers of i-iv would show mirror image CD spectra.
Results and Discussion
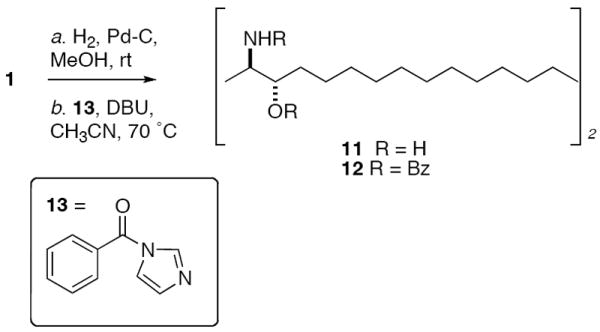
Leucettamol A (1) was isolated from MeOH extracts of the L. microrhaphis by solvent partition and reversed phase HPLC.13 The compound showed spectroscopic values identical with literature values1 and was highly prone to decomposition by autoxidation, and was kept frozen (−20 °C) until needed. The structures of 1 and 2 are each unsymmetrical due to the off-set placement of skipped polyolefins in the C30 linear carbon long-chain, however if one considers only end groups for stereochemical analysis the problem can be reduced in complexity after removal of the double bonds. In order to achieve this aim, a sample of 1 (ca. 0.1 mg) was hydrogenated (Scheme 1) to give a constitutionally symmetrical dimeric C30 bis-2,29-diamino-3,28-diol 11 (m/z 485.36 [M+H]+) which was immediately converted without purification to the corresponding N,O-perbenzoyl derivative 12 (freshly prepared benzoyl N-imidazolide 13, DBU, dry CH3CN, 60-70 °C).14 The final product was purified by HPLC (6:94 i-PrOH: n-hexane) and characterized by MS (m/z 923.43, [M+Na+]) and 1H NMR (CDCl3, 600 MHz, 1.7 mm microcryoprobe) which showed half the number H signals compared to the formula C30H64N2NaO2 consistent with a compound of either C2 or meso symmetry. In particular, downfield methine signals were observed due to H2/H29 CH-NHBz groups (δ 4.46, m, 2H), H3/H28 CH-OBz groups (δ 5.22, m, 2H), and the benzamide NH (δ 6.99, d, J = 7.8 Hz, 2H).
Scheme 1.
Elucidation of the stereostructure assignment of 1 can be reduced to defining which of the 10 unique stereoisomers 12a–j (Figure 2) corresponds to 12 formed by hydrogenation of 1. It should be noted that symmetry considerations reduces the maximum number of possible stereoisomers from 16 for 1 to only 10 for 12; these consist of two enantiomeric pairs of C2 isomers, 12a and 12d, two enantiomeric pairs of C1 isomers, 12b and 12c belonging to the group that lacks symmetry, and two achiral compounds, the meso dimers 12i and 12j.15
Figure 2.
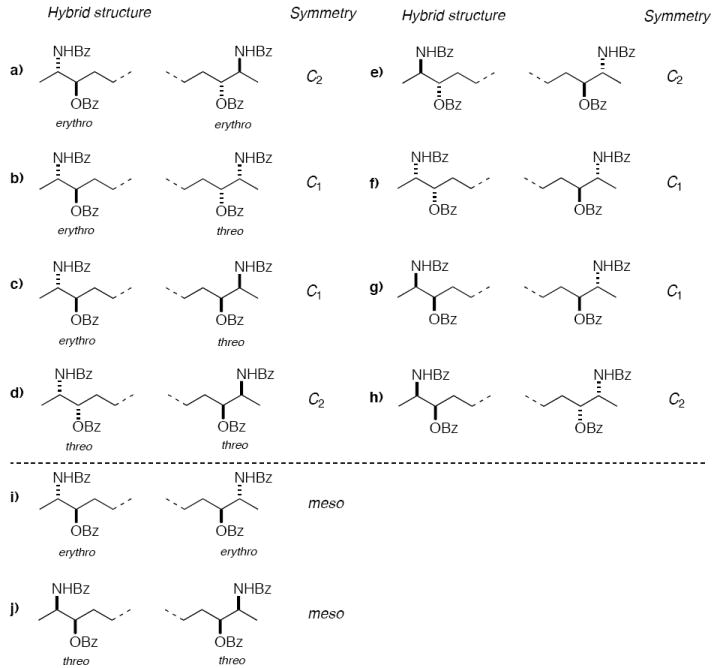
Representation of all possible stereoisomers of dimeric α,ω-dimeric amino alcohols 12a-j (only end groups depicted) corresponding to the hydrogenation product of leucettamol A (1). The first four rows depict chiral stereoisomers in the left column and their corresponding enantiomers in the right column.
Assignment of relative configuration and absolute configuration followed from ECCD of the tetrabenzoyl derivative 12 (see below), however, independent verification of the erythro/erythro relative configuration of 1 reported by Kong and Faulkner’s assignment1 was evident in the 1H NMR spectrum of 12. We had earlier shown2b that the vicinal coupling constant 3JH2-H3 in N,O-dibenzoyl-2,3-aminoalkanols can be used to assign threo (3J = 5.2 Hz) versus erythro (3J = 2.6-2.7 Hz) relative configurations, however, the differences between these values diminish in the corresponding 2-amino-1,3-alkanediol derivatives (3J = 3.8 Hz threo; 3J = 3.9-4.1 Hz, erythro). The J values also become difficult to measure accurately in the latter compound due to the strong mutual coupling of the C-1 oxymethylene protons and magnetically inequivalent vicinal coupling to H-2. Both factors may lead to erroneous assignments of configuration in aminoalcohols. Fortunately, a highly reliable diagnostic indicator for relative configuration of the vicinal aminoalcohols is the chemical shift of the amide NH in perbenzoyl derivatives in both 2-amino-3-alkanols and 2-amino-1,3-alkanediols. Differences in the degree of intramolecular hydrogen bonding lead to an NH signal in the threo stereoisomer that occurs at an unusually high field (δ ~ 6.38-6.63, d, J = 8.9 – 9.2 Hz) compared to that of the erythro isomer (δ ~ 6.97–7.10, d, J = 7.5 – 8.7 Hz).2b The leucettamol A derivative 12 showed a downfield NH signal (δ 6.99, 2H, J = 7.8 Hz) strongly suggestive of the erythro configuration at each end of the chain.16 This is entirely consistent with the relative configuration that Kong and Faulkner assigned to 1 and 2 as depicted in the reported structures.17
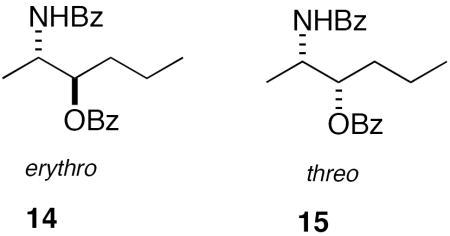
The specific rotation of 12, with attendant errors of a low rotatory compound, is not expected to be informative of the configuration at all four stereocenters. In contrast, CD readily revealed 12 was chiral and non-racemic even with only 90 μg of sample. Tetrabenzoyl derivative 12 gave a positive bisignate CD spectrum (split Cotton effect, MeOH, c = 20 μM) (Figure 3) of moderate intensity (λ 222 nm, Δε −2.80; λ 238 nm, Δε +10.29) due to ECCD between vicinal N-benzamide-O-benzoate pairs. Two erythro/erythro configurations can be formulated for 12; one in which the absolute configuration at each corresponding stereogenic center is the same (overall C2 symmetry, 12a) or one in which the absolute stereostructures of the opposing termini are inverted with respect to one another by a mirror plane that bisects C-15–C-16 (overall meso symmetry, 12i). Clearly, the meso isomers – and for that matter, racemates of C1 and C2 stereoisomers – are optically inactive and can be eliminated here by observation of a non-zero CD spectrum for 12 (Figure 3). The final assignment of 1 was readily made by quantitative comparison of the CD spectrum of its derivative 12 with ‘hybrid CD spectra’ generated by all possible linear combinations of CD spectra of two well-characterized model compounds 14 and 15 prepared from (2S)-alanine2b and their enantiomeric ‘virtual CD spectra’ obtained by inversion of the first two. Figure 3 shows overlays of the measured CD spectrum of 12 with ‘hybrid CD spectra’ (note: only non-zero combinations 12a-h are shown here). An excellent match is seen between the hybrid CD spectrum of the ent-erythro/ent-erythro pair 12e and the measured CD spectrum of 12, showing the two share the same absolute configuration. The same match was found when the spectra were recorded in CH3CN, even though the non-protic solvent produces slightly different amplitudes of maxima and minima for all CD spectra, due to slightly different blue shifts in λmax benzamide and benzoate chromophores and other minor changes in fine structure at ~200 nm. These CD results provide a second independent verification of the erythro/erythro relative configuration assigned first by Kong and Faulkner1 and corroborated here by NMR (see above). Therefore, leucettamol A (1) is not racemic but a C2 diastereomer of the following configuration: (2R,3S,28S,29R). Since leucettamol B (2) co-occurs with 1 in L. microrhaphis,1 it is almost certain both compounds have the same configuration at C-2, C-3, C-28 and C-29.18
Figure 3.
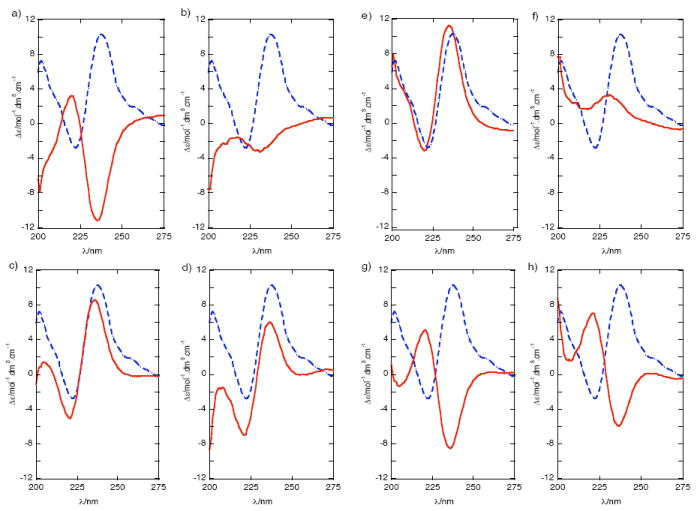
Circular dichroism (CD) spectra of leucettamol A derivative 12 (c = 2.5 × 10⁻⁵ M, MeOH, 23 °C) (dashed line) overlayed with ‘hybrid CD’ spectra (solid) generated by linear combinations of the measured CD spectra of erythro-14 and threo-15 and their enantiomers (ent-). (c ~ 2 × 10⁻⁴ M, MeOH, 23 °C, see ref. 3b) as follows: (a) erythro-14 + erythro-14 (b) erythro-14 + threo-15 (c) ent-erythro-14 + threo-15 (d) threo-15 + threo-15 (e) ent-erythro-14 + ent-erythro-14 (f) ent-erythro-14 + ent-threo-15 (g) erythro-14 + ent-threo-15 (h) ent-threo-15 + ent-threo 15.
Leucettamol A (1) has erythro end groups, like D-sphingosine (3), but is of the opposite absolute configuration. The minor anomaly of reported ‘zero rotation’ can now be explained. Leucettamol A (1) is clearly chiral and its optical rotation cannot be zero, except by coincidence. In our hands, the specific rotation of 1 was established as [α]D −3.8±0.1 (c 4.4, MeOH) (averaged measurements N=10). Therefore, the [α]D = 0 reported for 1 by Kong and Faulkner1 might have been close to the limits of detection of α under the conditions of measurement.19 Specific rotations [α]D’s of optically pure natural product amines and amino alcohols are characteristically low and often masked by very low measured optical rotations, especially with small samples, contamination with highly rotatory substances, and differences between free base and protonated salt forms. Derivatization of the NH2 and OH groups can lead to more reliable measurements. For example, the magnitudes of [α]D increase by two to three fold upon acetylation or benzoylation of sphingosine.20 Discrimination of threo from erythro isomers of sphingosine by 1H NMR has been demonstrated with the corresponding Mosher’s acid derivatives which are also useful for estimating optical purities of sphingosine samples containing as little as 1% of the minor enantiomer.21 Nevertheless, errors of assignment in configuration of even simple monomeric marine aminoalcohols have been made and sole reliance upon some methods may be risky. For example, the xestaminols22 first reported by Gulavita and Scheuer as (2S,3R) compounds were later corrected to (2R,3S) after total synthesis and [α]D comparisons of their diacetyl derivatives.23
N,O-Dibenzoyl derivatives of sphingolipids show characteristic CD spectra useful for characterization of very small amounts of compound. Munesada and coworkers first applied CD to perbenzoyl sphingosine obtained from frog brain cerebrosides for stereochemical assignment by correlation of configuration with the split Cotton effects that arise from exciton coupled benzoyl chromophores.24 Nakanishi and coworkers showed greatly improved sensitivity of ECCD’s using with N,O,O-tri-naphthoyl derivatives of sphinganine (dihydrosphingosine) and phytosphingosine,14,25 and even more distinct CD fingerprints have been obtained by differential acylation of primary and secondary NH2 and OH groups.25
When the dihedral angle in staggered conformations of vicinal benzoate-benzamide pairs rotates in the positive direction (positive helicity, see Figure 4), a positive split Cotton effect is observe; a negative sign is observed for a negative helicity.11a The magnitude of the ECCD is related to the dihedral angle and is maximum when the angle subtended by the electronic transition dipole moments θ = 70° but zero when θ = 0° or 180°.11a The motion-averaged direction of the electronic transition dipole moments lie approximately along the C-N and C-O single bond, respectively. Unlike vicinal benzamide-benzoate pairs in rigid cyclic systems, where the dihedral angles are fixed, the net magnitude and sign of the split Cotton effect in acyclic systems are subject to conformational dependences. The observed CD spectrum of threo-i or erythro-ii is expected to be the sum of ECCD contributions for all the possible conformers of each diastereomer, and the net effect is largely determined by the Boltzmann-weighted staggered conformations a-c shown in Figure 4.
Figure 4.
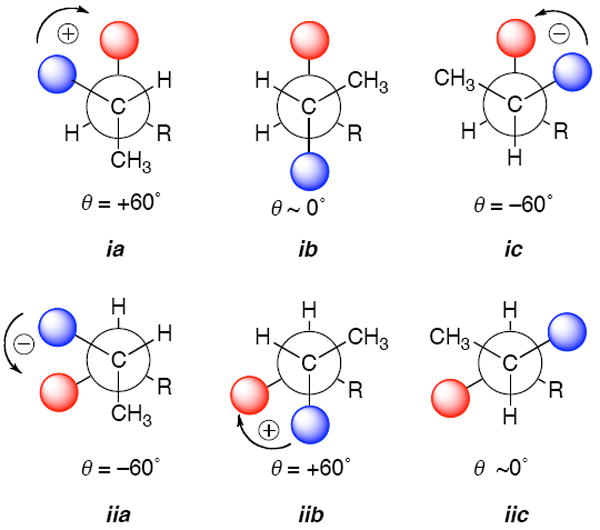
Staggered conformers contributing to exciton coupling CD in threo (ia – ic) and erythro (iia – iic) isomers of acyclic dibenzoyl 2-amino-3-alkanols. Blue and red shaded spheres represent N-Bz and O-Bz chromophores groups, respectively (λmax ~228 nm. The net signs of the observed split Cotton effects are consistent with predominant contributions from conformers ia and iia, respectively. Conformers ib and iic have anti-parallel transition dipole moments and give zero contributions to the ECCD’s. See also Figure 1.
Investigations of dibenzoyl and derivatives of acyclic vicinal 2-amino-1-alkanols11b show that prediction of the sign of the split Cotton effect is upheld by both CD measurements and calculations of conformer populations. Our own empirical CD and NMR investigations of 3-amino-2-alkanols3b also support this model; for example, the larger H2-H3 vicinal coupling constant in the threo diastereomer (Figure 4, R = n-Pr, J = 5.2 Hz) shows the dominant conformer is ia with the anti-periplanar arrangement of the H2–C2–C3–H3 bonds, but in the erythro isomer (J = 2.6 Hz) it is gauche iia. It is of interest to note that erythro and threo diastereomers of vicinal benzamide-benzoates are opposite in sign, with magnitudes that are similar but not equal (Figure 1). This is in contrast to vicinal dichromophoric derivatives of 1,2-glycols in which the magnitude of the ECCD in the threo isomer is almost zero due to a dihedral angle θ = 180° between the C-O bonds in the predominant anti-periplanar conformer.26 The reason for the difference is likely related to hydrogen bonding of the NH in the amide group to the vicinal benzoate oxygen in both ia and iia that stabilize these gauche conformations with consequently larger contributions to the net ECCD’s.
We have exploited N,O-benzoyl derivatives by extension to dimeric sphingolipids using a simple one-step perbenzoylation and interpretation of the resultant unique CD pattern. The results are easily read; simple superposition of the exciton coupled Cotton effects from expected linear combinations of threo and erythro isomeric end groups in 2-amino-3-alkanols can be deconvoluted by permutations of the constituent short-chain perbenzoyl derivatives.3b
The unambiguous assignment of 1 now allows some summary comparative notes on this interesting class of natural products and outcomes from application of the deconvolution of ECCD. The Δε values measured in the ECCD of benzoate-benzamide pairs in these studies are recorded using highly dilute solutions (10−4 – 10−5 M) under conditions where, like UV-vis spectroscopy, the Beer-Lambert law is obeyed.27 The method is applicable even to natural products that are obtained in sub-milligram amounts, since accurate concentrations of perbenzoyl derivatives are reliably measured from UV absorbance values together with the precisely recorded molar absorbtivities, ε, that we reported in the original study.3b In turn, this allows confidence in estimating stereochemical purity and possible inhomogeneity or ‘contamination’ of natural product long-chain DS’s. Homochiral perbenzoyl derivatives of homologs and some analogs of DS’s exhibit CD spectra that are matched both by sign and magnitude of the Cotton effects. Cross-contamination by even small amounts of another diastereomer (e.g. an ent-erythro/ erythro-diasteromeric contaminant in an ent-erythro/ ent-erythro sample) would amplify mismatches between hybrid and measured CD spectra and be quickly revealed. This is not the case with measurements of optical activity which are notoriously unreliable for natural products with weak [α]D’s or cross-contamination by highly-rotatory congeners.
In the five dimeric sphingolipids we have examined so far, the natural product has been isolated as a homochiral entity; that is, compounds from a single sponge specimen appear as only one diastereomeric modificaion of one enantiomeric form (>95% ee). Nature appears to show high fidelity in enantiospecific biosynthesis of each DS and this may reflect a tightly coupled enzymic process that unifies construction of the aminoalcohol end-group with long-chain dimerization, although the details of the latter process are still unclear.
The mis-assignment of 1 and 2 as ‘racemic’1 is understandable from one point of view. Low molar rotations are often observed for acyclic and alicyclic aminoalkanes and aminoalcohols, and can be further lowered when functional groups contribute molar rotations of opposing signs. Nevertheless, the biosynthesis of sphingolipids can be expected to occur under stringent enzyme control with highly enantioselectivity, although the stereospecificity may vary between different species of sponge and produce stereodiads at termini with different configurations. Although racemic and partially racemic chiral long-chain lipids28 and terpenoids29 have been observed in Nature, these seem to be exceptions. It seems unlikely that leucettamols would be biosynthesized with complete racemization. Even if they were, it seems even less likely that only one diastereomer of 1 instead of two or more would be present in the same sponge.
Finally, it is of interest to note that Leucetta microrhaphis, the sponge that produces 1 and 2, belongs to the less common group of calcareous sponges; all other DS’s come from Demospongia of the family Oceanapiidae. The outstanding compound in the series, the polyene dimeric sphingolipid BRS1 (10), is clearly a leucettamol analog and has been isolated from two sponges from the Great Barrier Reef; another specimen of L. microrhaphis7b,30 and the earlier finding7a from a sponge of uncertain identity.
In conclusion, we have completed the stereochemical assignment of leucettamol A (1) by CD and report the complete configuration. The deconvolution ECCD method for assignment of dimeric sphingolipids,2c,3 as well as simple monomeric 2-amino-3-alkanols (e.g. 6)12 that is well suited to distinguishing enantiomers of both threo and erythro stereoisomers of aminoalcohols at nanomole sensitivity. This is particularly useful for those natural products with [α]D’s that, through happenstance, have magnitudes near zero and deceptively present themselves as racemic or meso.
Experimental Section
General Experimental Procedures
Optical rotations were measured using a Jasco P1020 polarimeter. 1H NMR spectra were recorded on a Bruker DRX-600 (600 MHz, 1H, 1.7 mm TXI cryoprobe) and Varian Mercury 400 (400 MHz) spectrometers in CDCl3 using residual CHCl3 (δ 7.26 ppm) as an internal standard. CD spectra were measured on a Jasco J810 spectropolarimeter using spectroscopic grade solvents (Fisher EM) and a 2 mm quartz cell with 50 nm/min scan rate and 1 nm slit. FTIR was measured using a Jasco FT-4100 spectrometer equipped with a Pike MIRacle ZnSe ATR plate. LR ESI mass spectra were obtained on a ThermoElectron MSQ single quad mass spectrometer coupled to an Accela UPLC. HRESI mass spectra were provided by the University of California, Riverside mass spectrometry facility. Semipreparative HPLC was carried out using a Rainin binary HPLC system (Dynamax C18 column, 10 × 250 mm, 5 μm, 3 mL/min or Dynamax silica 4.6 × 250 mm, 3 μm in specified solvent systems coupled) to a refractive index detection (Waters R401) and Isco UV-6 detector equipped with a filter for 250 nm. Flash column chromatography was carried out on silica (43-60 μm, EM 360) using a low-pressure solvent delivery system and TLC was performed on silica gel coated 0.2 mm aluminum backed plates with visualization by vanillin-H2SO4-EtOH or ceric ammonium nitrate (aq).
Animal Material
The sponge Leucetta aff. microrhaphis (Haekel, 1872) was collected by hand using scuba at a depth of −10 m in North Sulawesi, Indonesia (September 2006), and immediately soaked in EtOH. The sponge was identified by Rob van Soest and a voucher sample (ZMAPOR20126) was deposited in the Institute for Systematics and Ecology, University of Amsterdam, The Netherlands.
Extraction and Isolation
The EtOH extract of the sponge was evaporated and the aqueous residue extracted with EtOAc followed by n-BuOH. The n-BuOH fraction (0.61 g) was subjected to reversed phase column chromatography (2:3 CH3CN-H2O to afford leucettamol A (1, 202 mg, 0.25% w/w) with spectroscopic properties (MS, 1H NMR, 13C NMR) identical with literature values.1 [α]D −3.8±0.1 (c 4.4, MeOH, 10 measurements), lit.1 [α]D 0 (c 1.26, MeOH).
No leucettamol B (2) was detected in this sample of L. aff. microrhaphis.
Hydrogenation of Leucettamol A (1). Hexahydroleucettamol A (11)
A mixture of 1 (0.5 mg) in MeOH (2.0 mL) and 10% Pd-C (0.2 mg) was stirred under an atmosphere of hydrogen for 18 h. The mixture was filtered through Celite and concentrated to give crude 11 (ca. 0.1 mg). LR ESIMS m/z 485.4 [M+H]+. Calcd. 485.5 for C30H65N2O2. This material was used immediately in the next step.
N-Benzoylimidazolide (13)31
A suspension of imidazole (4.54 g, 0.0668 mol) in dry benzene (200 mL) was treated with a solution of benzoyl chloride (4.69 g, 0.0333 mol) in benzene (20 mL) at 8 °C in a flask fitted with a drying tube. The mixture was allowed to warm to room temperature and stirred for 16 h. The precipitated imidazole hydrochloride was removed by filtration through a fritted funnel and the clear filtrate concentrated under reduced pressure to give N-benzoyl imidazolide (13) as a viscous, hygroscopic oil (5.78 g, quant.) that was stored at 0° C in a tightly stoppered vessel. 1H NMR (CDCl3) 8.05 (s, 1H), 7.78 (bd, 2H, J = 8.2 Hz), 7.67 (tt, 2H, J = 8.2, 1.5 Hz), 7.58 (bt, 1H, J = 7.4 Hz), 7.53 (bs, 1H), 7.16 (bs, 1H).
N,N’,O,O’-Tetrabenzoylhexahydroleucettamol A (12)
A solution of 11 (0.1 mg, 0.2 μmol) in dry CH3CN (0.5 mL) was treated with a solution of freshly prepared N-benzoylimidazole 13 (0.36 mg, 2.0 μmol) in dry CH3CN and DBU (0.28 mg, 1.8 μmol) at room temperature then heated (70 °C) with stirring under an atmosphere of nitrogen for 18 h. The volatiles were removed under a stream of N2 and the residue was dissolved in 0.3 mL CHCl3, loaded in a pipet column (silica) and eluted with 3:7 EtOAc/hexanes. After elution of non-polar UV-active byproducts, the more polar product 12 was eluted and further purified by HPLC (6:94 i-PrOH/n-hexane, Alltech 5 μ silica, 4.6 × 250 mm, tR = 7.25 min, 1.5 mL/min). UV (MeOH) λ 227 nm (ε 39,900). CD (MeOH) λ 222 nm (Δε −2.80), 229 (Δε 0), 238 (Δε +10.30). CD (CH3CN) λ 221 nm (Δε −4.59), 229 (Δε 0), 237 (Δε +10.03). See Figure 3 for CD spectra in MeOH and Supporting Information for CD spectra in CH3CN. FTIR (ATR) ν 3600bs, 2264, 2362, 1623 cm−1. 1H NMR (CDCl3) δ 8.09 (d, 4H, J = 8.4 Hz; ortho-PhCOO), 7.76 (d, 4H, J = 8.4 Hz; ortho-PhCONH), 7.41-7.60 (m, 12H; aryl H), 6.99 (d, 2x1H, J = 7.8 Hz, C2/C29-NH), 5.22 (m, 2x1H, H3/H28), 4.49 (m, 2x1H, H2/H29), 1.20-1.30 (m, 48H), 1.29 (d, 2x3H, J = 6.6 Hz, H1/H30). LR ESIMS m/z 923.5908 [M+Na]+. cald, for C58H80N2NaO6 923.5914.
CD Measurements and Generation of ‘Hybrid CD’ Spectra:3
CD spectra were measured on Jasco J-810 spectropolarimeter using solutions prepared in HPLC grade MeOH or CH3CN. All measurements were carried out with N = 20 scans in dilute solutions (20-200 μM) in cells of CD grade quartz (2 mm path); scan speed, 50 nm/min, slit width 1 nm. No smoothing or noise reduction was applied to CD data. Digitized spectral files (1 nm/data point) were exported as ASCII files and parsed into Excel spreadsheets (MS Office 2004) prior to column additions-subtractions to yield ‘hybrid CD’ spectra. Tabulated CD data of 14 and 15 were obtained under similar conditions as reported earlier3b and plotted against ‘hybrid spectra’ using Kaleidagraph 4.0 (Synergy Software) running on an iMac computer (Apple, Inc).
Supplementary Material
Measured CD spectra of 12 and ‘hybrid spectra’ in CH3CN, MS and 1H NMR spectra of 12. This material is available free of charge via the Internet at http://pubs.acs.org
Acknowledgments
We thank R. van Soest (University of Amsterdam) for identification of the sponge. This work was supported by grants from NIH (AI039987 and CA122256, to T.F.M) and Grants-in-aid for Scientific Research (No.18032033 and 19310140, to S.T.) from the Ministry of Education, Culture, Sports, Science, and Technology of Japan, and grants from the Naito Foundation and the Keimeikai Foundation (S.T.).
Footnotes
Dedicated to Dr. David G. I. Kingston of Virginia Polytechnic Institute and State University for his pioneering work on bioactive natural products.
References and Notes
- 1.Kong FH, Faulkner DJ. J Org Chem. 1993;58:970–971. [Google Scholar]
- 2.(a) Makarieva TN, Denisenko VA, Stonik VA, Milgrom YuN, Rashkes YaW. Tetrahedron Lett. 1989;30:6581–6584. [Google Scholar]; (b) Makarieva TN, Guzii AG, Denisenko VA, Dmitrenok PS, Santalova EA, Pokanevich EV, Molinski TF, Stonik VA. J Nat Prod. 2005;68:255–257. doi: 10.1021/np049710z. [DOI] [PubMed] [Google Scholar]; (c) Molinski TF, Makarieva TN, Stonik VA. Angew Chem Int Ed. 2000;39:4076–4079. [PubMed] [Google Scholar]
- 3.(a) Nicholas GM, Hong TW, Molinski TF, Lerch ML, Cancilla MT, Lebrilla CB. J Nat Prod. 1999;62:1678–1681. doi: 10.1021/np990190v. [DOI] [PubMed] [Google Scholar]; (b) Nicholas GM, Molinski TF. J Am Chem Soc. 2000;122:4011–4019. [Google Scholar]
- 4.Makarieva TN, Denisenko VA, Dmitrenok PS, Guzii AG, Santalova EA, Stonik VA, MacMillan JB, Molinski TF. Org Lett. 2005;7:2897–2900. doi: 10.1021/ol050796c. [DOI] [PubMed] [Google Scholar]
- 5.Zhou BN, Mattern MP, Johnson RK, Kingston DGI. Tetrahedron. 2001;57:9549–9554. [Google Scholar]
- 6.Makarieva TN, Dmitrenok PS, Zakarenko AM, Denisenko VA, Guzzi AG, Li R, Skepper CK, Molinski TF, Stonik VA. J Nat Prod. 2007;70:1991–1998. doi: 10.1021/np0704811. [DOI] [PubMed] [Google Scholar]
- 7.(a) Willis RH, De Vries DJ. Toxicon. 1997;35:1125–1129. doi: 10.1016/s0041-0101(96)00218-8. [DOI] [PubMed] [Google Scholar]; (b) Kehraus S, Konig GM, Wright AD, Woerheide G. J Org Chem. 2002;67:4989–4992. doi: 10.1021/jo020058r. [DOI] [PubMed] [Google Scholar]
- 8.Nicholas GN, Li R, MacMillan JB, Molinski TF. Bioorg Med Chem Lett. 2002;12:2159–2162. doi: 10.1016/s0960-894x(02)00367-0. [DOI] [PubMed] [Google Scholar]
- 9.Tsukamoto S, Takeuchi T, Rotinsulu H, Mangindaan REP, van Soest RWM, Ukai K, Kobayashi H, Namikoshi M, Ohta T, Yokosawa H. Bioorg Med Chem Lett. 2008;18:6319–6320. doi: 10.1016/j.bmcl.2008.10.110. [DOI] [PubMed] [Google Scholar]
- 10.Also implicit in the logic of their deduction is that leucettamols must be chiral – and racemic – because both ends of each molecule have the same configuration and that the position of the skipped olefins in the long chains make them constitutionally unsymmetrical, but the molecules would still be chiral even if they were constitutionally symmetrical (with the exception of the meso form in which each end has the same relative configuration but with mirror image absolute configurations – see text and Figure 1 for further discussion). Comparison of the rotation of C28 rhizochalin aglycone (4a, [α]D +11, ref. 2a) with the zero specific rotation observed for 1 and 2 is also invoked to further support the conclusion that, “both leucettamols…are racemic”, however as we have shown elsewhere (ref. 2c), the former molecule represents a pseudo-C2 molecule which is fully expected to be chiral, regardless of the presence of the near mid-chain keto group.
- 11.(a) Harada N, Nakanishi K. Circular Dichroic Spectroscopy: Exciton Coupling in Organic Stereochemistry. University Science Books; Mill Valley, CA: 1983. p. 460. [Google Scholar]; (b) Kawai M, Nagai U, Katsumi M. Tetrahedron Lett. 1975;16:3165–3166. [Google Scholar]; (c) Searle PA, Molinski TF. J Org Chem. 1993;58:7578–7580. [Google Scholar]; (d) Kawamura A, Berova N, Dirsch V, Mangoni A, Nakanishi K, Schwartz G, Bielawska A, Hannun Y, Kitagawa I. Bioorg Med Chem. 1996;4:1035–1043. doi: 10.1016/0968-0896(96)00092-2. [DOI] [PubMed] [Google Scholar]
- 12.Kossuga MH, MacMillan JB, Rogers EW, Molinski TF, Nascimento GSF, Rocha RM, Berlinck RGS. J Nat Prod. 2004;67:1879–1881. doi: 10.1021/np049782q. [DOI] [PubMed] [Google Scholar]
- 13.No leucettamol B (2) was detected in these extracts.
- 14.Ikemoto N, Lo L-C, Nakanishi K. Angew Chem Int Ed. 1992;31:890–891. [Google Scholar]
- 15.Although the hydrogenation product 11 of leucettamol A (1) was revealed to be a constitutional C2 dimer, the assignment of configuration in 1 would have been made more complicated if it were C1 because of the need to place each inequivalent end group at correct ends of the unsymmetrical skipped polyene chain. Herein lies a limitation to the CD method. However the correct assignment could still be made by 2D NMR spin correlation (e.g. TOCSY, HMBC) of the compound prepared by per-benzoylation of 1 without hydrogenation and using the empirical NH chemical shift method described in the text to identify threo and erythro ends groups
- 16.In our opinion, the (CO)NH 1H NMR chemical shift in CDCl3 only is more reliable for assignment of relative configuration, in most cases, than measurements of vicinal couplings or NOE’s in the corresponding cyclic oxazolidinone1 or thiazolidinone derivatives.
- 17.In the text of the paper (reference 1), the authors state, apparently in contradiction to their depicted structure, that 1 has, ”threo stereochemistry at both ends of the molecule”. This appears to be a typographical error since the 1H NMR data support the all erythro configuration for leucettamol A as shown.
-
18.Leucettamol B (2) is also an expected product of oxidation of 1 by a singlet oxygen ene-reaction followed by disproportionation of the resultant hydroperoxide i, and may possibly be an artifact.

- 19.The different [α]D we observed may partly be due to instrumental limitations. In our work, a standard 1 cm ‘microcell’ (volume =200 μL) and solution of 44 mg/mL of 1 (MeOH) was used for rotation measurements (Jasco P2000 digital polarimeter), giving a measured rotation of −0.017 millidegrees for the solution of 1. Back-calculating the measured α from the specific rotation reported by Kong and Faulkner [α]D 0 (c 1.26, MeOH) give α = −0.0478 in a 10 cm cell or α = −0.00478 in a 1 cm cell. The latter value is close to the ‘limit of detection’ (twice the S/N) of older model polarimeters.
- 20.For example, D-erythro-sphingosine, [α]D −7 (c 0.8, CHCl3) Solladie-Cavallo A, Koessler JL. J Org Chem. 1994;59:3240–3242.; N,O,O’-triacetyl sphingosine, [α]D19 −24.1 (c 13.7, MeOH), [α]D −13 (c 0.5, CHCl3); N,O,O’-tribenzoyl sphingosine, [α]D −11.2 (c 10, pyridine), Combined Chemical Dictionary, Taylor and Francis, 2008, http://www.chemnetbase.com/
- 21.Li S, Wilson WK, Schroepfer GJ. J Lipid Res. 1999;40:764–772. [PubMed] [Google Scholar]
- 22.Gulavita NK, Scheuer PJ. J Org Chem. 1989;54:366–369. [Google Scholar]
- 23.Mori K, Matsuda H. Liebigs Ann Chem. 1992:131–137. [Google Scholar]
- 24.Munesada K, Yuasa M, Suga T. J Chem Soc Perkin Trans I. 1991:189–194. [Google Scholar]
- 25.Wiesler WT, Nakanishi K. J Am Chem Soc. 1989;111:3446–3447. [Google Scholar]
- 26.Zhao N, Zhou P, Berova N, Nakanishi K. Chirality. 1995;7:636–651. doi: 10.1002/chir.530070815. [DOI] [PubMed] [Google Scholar]
- 27.We have not been able to detect second order effects of the CD spectra of perbenzoyl DS’s due to intra-molecular π-π stacking under the conditions of measurement. Such effects are either too weak to observe or averaged out by dynamical behavior under the conditions of the measurements (c ~10−4 – 10−5 M, 23 °C, MeOH or CH3CN).
- 28.Skepper CK, Molinski TF. J Org Chem. 2008;73:2592–2597. doi: 10.1021/jo702435s. [DOI] [PubMed] [Google Scholar]
- 29.(a) Horton P, Inman WD, Crews P. J Nat Prod. 1990;53:143–151. [Google Scholar]; (b) Searle PA, Molinski TF. Tetrahedron. 1994;50:9893–9908. [Google Scholar]
- 30.A sample of BSR1 was kindly provided to us in 2003 by Professor G König, but had already decomposed before we could investigate the configuration.
- 31.Gerngross O. Ber. 1913;46:1908–13. [Google Scholar]
Associated Data
This section collects any data citations, data availability statements, or supplementary materials included in this article.
Supplementary Materials
Measured CD spectra of 12 and ‘hybrid spectra’ in CH3CN, MS and 1H NMR spectra of 12. This material is available free of charge via the Internet at http://pubs.acs.org


