Abstract
Metal nanoparticles have been studied for their anticoagulant and anti-inflammatory efficacy in various models. Specifically, gold and silver nanoparticles exhibit properties that make these ideal candidates for biological applications. The typical synthesis of gold and silver nanoparticles incorporates contaminants that could pose further problems. Here we demonstrate a clean method of synthesizing gold and silver nanoparticles that exhibit biological functions. These nanoparticles were prepared by reducing AuCl4 and AgNO3 using heparin and hyaluronan, as both reducing and stabilizing agents. The particles show stability under physiological conditions, and narrow size distributions for heparin particles and wider distribution for hyaluronan particles. Studies show that the heparin nanoparticles exhibit anticoagulant properties. Additionally, either gold- or silver- heparin nanoparticles exhibit local anti-inflammatory properties without any significant effect on systemic hemostasis upon administration in carrageenan-induced paw edema models. In conclusion, gold and silver nanoparticles complexed with heparin demonstrated effective anticoagulant and anti-inflammatory efficacy, having potential in various local applications.
Introduction
Metal nanoparticles such as gold (Au) and silver (Ag) have recognized importance in chemistry, physics and biology because of their unique optical, electrical and photothermal properties.1–6 Such nanoparticles have potential applications in analytical chemistry and have been used as probes in mass spectroscopy,7 as well as in the colorimetric detection for proteins and DNA molecules.8 Furthermore, Au nanoparticles have photothermal properties that can be exploited for localized heating resulting in drug release, thus, increasing their potential for therapeutic applications.9 The ease of synthesizing Au and Ag nanoparticles and their affinity for binding many biological molecules, makes them attractive candidates for study. Various methods have been reported over the last two decades for the synthesis of Au and Ag nanoparticles, which involved the reduction of AuCl4 and AgNO3 with a chemical reducing agent, such as citrate acid, borohydride, or other organic compounds.10–18 The functionalization of metal nanoparticles synthesized using such reductants is straightforward resulting in their derivatization with biomolecules including, DNA19 and proteins.20 While nanoparticles derivatized with proteins and DNA has been extensively studied, metal nanoparticles derivatized with polysaccharides, such as glycosaminoglycans (GAGs), have thus far been overlooked.
GAGs are negatively charged polysaccharides composed of repeating disaccharides units and can be sulfated at various positions along the polysaccharide chains. These include heparin, heparan sulfate, chondroitin sulfate, hyaluronan, dermatan sulfate, and keratan sulfate. Heparin is the most sulfated GAG and is composed of repeating units of uronic acids, such as glucuronate (GlcA) or iduronate (IdoA), and N-acetylglucosamine (GlcNAc) residues, with an average of 2.7 sulfo groups per disaccharide.21 Hyaluronan is a non-sulfated GAG with a long repeating chain of GlcA linked to GlcNAc. GAGs, with the exception of hyaluronan, are often found attached to various core proteins, forming larger macromolecules, called proteoglycans. Proteoglycans have diverse biological functions depending on both the core protein and the type and number of GAG chains that are attached. GAGs are ubiquitously found throughout the body of all animals and are recognized by a myriad of proteins. When these proteins interact with GAGs their activity is regulated allowing these proteins to carry out their specific biological functions. For example, heparin and heparan sulfate are involved in anticoagulation, wound healing, angiogenesis, tumor metastasis, and inflammation. Hyaluronan (HA) serves as lubricant and shock absorber in the extracellular matrix of cartilage.22 The incorporation of carbohydrates onto nanomaterials has recently become an active research area. Jiang and coworkers synthesized poly(glucosamine) (chitosan) - Au hybrid nanospheres using cross-linked low molecular weight chitosan (LMWCS) and ethylenediaminetetraacetic acid (EDTA) composite nanospheres as a precursor reaction system, which involved in-situ reduction of Au ions in polymeric spheres using EDTA as the reducing agent.23 Gole and coworkers used glucose as a reductant to form nanoparticles using chloroaurate ions entrapped in the thermally evaporated fatty amine film on a glass substrate.24 Raveendran et al. used β-D-glucose as the reducing agent and starch as a capping agent to prepare starch Ag nanoparticles.25 Huang et al. used chitosan and heparin as reducing and stabilizing agents for the synthesis of Au and Ag nanoparticles, respectively.26 Until now, the use of carbohydrates as reducing agents has been largely limited to nanoparticle synthesis. The current study demonstrates the feasibility of synthesizing stable GAGs-nanoparticle bioconjugates to probe biological activities. Synthesis of Au and Ag nanoparticles, using derivatized heparin that is able to bind very strongly with the Au and Ag, and hyaluronan as reducing agents, avoids the need to remove reagents added or any impurities formed during the reaction, affording stable nanoparticles. These nanoparticles were easily purified from unbound or free heparin molecules by centrifugation. In vivo and in vitro studies show that the heparin or hyaluronan metal nanocomposites display important biological activities and biocompatibility to these nanomaterials.
Experimental section
Materials
Gold (III) chloride trihydrate (HAuCl4), silver nitrate (AgNO3), HA sodium salt from Streptococcus equi, sodium chloride, calcium chloride and heparinase I (E.C. 4.2.2.7) from Flavobacterium heparinum, Indomethacin, Dowex-1 strongly basic anion-exchange resin were purchased from Sigma Chemicals (St. Louis, MO) and used as received. Heparin sodium from porcine intestinal mucosa was purchased from Celsus Laboratories (Cincinnati, OH). Reagents for coagulation studies including: aPTT reagents were ordered from BD Biosciences (Rockville, MD), and TEG reagents were ordered from Haemoscope Corporation (Skokie, Illinois). Other common reagents were ordered from Sigma Chemicals (St. Louis, MO).
Synthesis of 2,6-diaminopyridinyl heparin (DAPHP)
The 2,6 diaminopyridinyl heparin (DAPHP)27 was synthesized by dissolving heparin (100 mg, 8.3 μM) in 1 ml of formamide by heating at 50 °C, 2,6-diaminopyridine (100 mg, 920 μM) was then added and the reaction was maintained at 50 °C for 6 h. Aqueous sodium cyanoborohydride (9.5 mg, 150 μM) was added and incubated at 50 °C for an additional 24 h. The reaction mixture was diluted with 10 ml of water and dialyzed against 2 L of water for 48 h using a 1000 molecular weight cut-off (MWCO) dialysis membrane. The retentate was recovered, lyophilized, and purified by methanol precipitation and strong anion exchange (SAX) chromatography on Dowex-1 resin.
Synthesis of gold and silver nanoparticles capped with DAPHP
Typically, an aqueous solution of HAuCl4 or AgNO3 (0.1 mM) was heated until boiling. DAPHP (0.5 mM aqueous solution) was added dropwise to HAuCl4 or AgNO3 solutions heated to boiling for 20 min. The DAPHP reduction of HAuCl4 to gold nanoparticles and AgNO3 to silver nanoparticles could be monitored by observing the change of color from a light-yellow to a dark purple and yellow, respectively. The nanocomposites could be used without further purification. Alternatively, the mixture could be purified by recovering the Au-DAPHP and the Ag-DAPHP nanoparticles by centrifugation at 16,000 × g for 20 min and washed with water 3-times.
Synthesis of gold and silver nanoparticles with HA
Typically, an aqueous solution of 0.1 mM HA was gradually heated until boiling to dissolve the HA. Approximately 200 μg of HAuCl4 in 1 ml of water was added dropwise to the HA solution for a final concentration of 0.1 mM. The solution was gradually heated and the formation of gold nanoparticles was observed by monitoring the change of color from light-yellow to pink. Ag nanoparticles were prepared in a similar fashion; however the formation of silver nanoparticles required heating in ~70 °C water bath overnight.
Synthesis of gold and silver nanoparticles with glucose
An aqueous solution of 0.1 M of glucose was heated and stirred until boiling. A solution of 0.6 mM of HAuCl4 was added dropwise to the glucose. The formation of particles was monitored by the change of color from light-yellow to pink. Ag nanoparticles were made by boiling a solution of 0.1 M glucose and adding 5.8 mM of an aqueous solution of AgNO3. The solutions of Au and Ag nanoparticles were concentrated by rotary evaporation as much as possible while avoiding aggregation.
Quantification of DAPHP immobilized on gold and silver nanoparticles
DAPHP capped Au and Ag nanoparticles were taken for analysis to determine the amount of DAPHP loading. Heparinase I (~0.5 U in 50 mM Na2HPO4, 100 mM NaCl, pH 7.1) was allowed to react with 25 μl of purified Au-DAPHP and Ag-DAPHP overnight at 37 °C, the resulting solution was centrifuged (16,000 × g) to completely pellet the nanoparticles and the heparin present in the supernatant was determined by carbazole assay (Supporting Information).28 Carbazole assay is a colorimetric assay used for quantification of the uronic acids present in polysaccharides.
Characterization of Gold and Silver Nanoparticles
Various spectroscopic techniques including ultraviolet – visible (UV-Vis), X-ray photoelectron (XPS), and transmission electron microscopy (TEM) were used to characterize the nanocomposites. UV–Vis spectroscopic measurements of the particles relied on a Perkin Elmer Lamda 950 spectrometer operated with a resolution of 2 nm. XPS measurements were carried out in a PHI 5400 instrument with a 200 W Mg Kα probe beam. The spectrometer was configured to operate at high resolution with pass energy of 20 eV. TEM was used to determine the size distribution of the particles on a Philips CM12 TEM.
Anticoagulant Efficacy
a) Activated Partial Thromboplastin Time (aPTT):29
An appropriate amount of DAPHP capped Au and Ag nanoparticles or Au and Ag nanoparticles reduced with glucose were added with 0.1 ml of automated aPTT reagent to cups and warmed for 1 min at 37 °C. Citrated plasma (0.1 ml) was added and the mixture was incubated at 37 °C for 5 min. CaCl2 (0.1 ml of 0.025 M) was added to recalcify the citrated plasma, the fibrometer was started and the clotting time was measured. Each determination was performed in triplicate and experiment repeated six times.
b) Clot dynamics in human whole blood using Thrombelastography (TEG)
Human healthy male and female volunteers (age ranges from 25 – 45 years old) were enrolled in the study. Siliconized Vacutainer tubes (Becton Dickinson, Rutherford, NJ) were used to collect whole blood. To maintain a ratio of citrate to whole blood of 1:9 (v/v), the tubes contained 3.2% trisodium citrate. Blood samples were placed on a slow speed rocker until thrombelastography (TEG) analysis.
Thrombelastography
Whole Blood Coagulation Analyzer, Model 5000 Thrombelastograph, Haemoscope Corporation, Skokie, Illinois, was used. TEG is based on the measurement of the physical viscoelastic characteristics of blood clots. An oscillating plastic cylindrical cuvette (“cup”) and a coaxially suspended stationary piston (“pin”) with a 1-mm clearance between the surfaces are used to monitor clot formation at 37 °C. Every 4.5 seconds, with a 1-second mid cycle stationary period, the cup oscillates in either direction, resulting in a frequency of 0.1 Hz. A torsion wire that acts as a torque transducer suspends the pin. Fibrin fibrils link the cup to the pin during clot formation, and the rotation of the cup is transmitted to the pin via the viscoelasticity of the clot. Customized software (Haemoscope Corporation, Skokie, IL) and an IBM-compatible personal computer display the rotation. The pin’s torque is plotted as a function of time, as shown by the different TEG clot parameters.30–34 The effect of Au-DAPHP or Ag-DAPHP versus heparin and all respective controls were tested for their efficacy on clot dynamics in human blood using TEG.
Evaluation of Anti-inflammatory Test Compounds in a Rodent Model of Carrageenan-Induced Paw Edema:35
Animals were randomized by weight and group rats into 10 different groups, with 5 male rats (180–200 g) per group. The protocol is as previously described35 where briefly paw volumes were initially weighed and recorded by placing a beaker of water on balance and tare to zero and record readout on scale. This was followed by placing right hind limb in the beaker of water on the scale with the top of the hock centered in the meniscus of the water. The foot was dried after each measurement as wet feet will change the readout. Scale was re-tared between measurements to account for decrease in water volume. After foot measurements were recorded, the rats (5 rats/treatment group) were pretreated with either: a) Indomethacin, s.c. at 5 mg/kg, 30 min prior to injection with carrageenan; b) Test compounds or vehicle, s.c., 30 min prior to injection with carrageenan in sub-plantar region of right hind foot. Test compounds include the followings: gold-glucose, silver-glucose, gold-HA, silver-HA, gold-heparin, silver-heparin, heparin, and vehicle. At the end of the pretreatment period, the rats were anesthetized and injected with 0.1 ml of 0.3% carrageenan solution in the sub-plantar region of the right hind foot, using a ½ inch 26 gauge needle attached to a 1 cc syringe, and returned to their cage. At 2 h, 4 h, and 6 h post carrageenan injection, each rat’s right hind foot is again placed in the tared beaker of water on the balance by placing it in the water with the top of the hock centered in the meniscus and reading was recorded. At the end of the experiment, animals were euthanized and terminal blood was collected, centrifuged, and aPTT was measured in plasma. Initial paw volumes were averaged out of the 5 rats per group and standard deviation calculated for each group. Initial paw volume averages were subtracted from the individual paw volumes measured at two, four and six hours post carrageenan injection. This determines the difference between initial paw volume and paw volume after carrageenan administration. The average and standard deviation from the different paw volumes for each group at each time point was calculated. Data were plotted as changes in paw volume versus time (hrs). Percent inhibition for each dose and at each time point was calculated using the following formula:
Results and Discussion
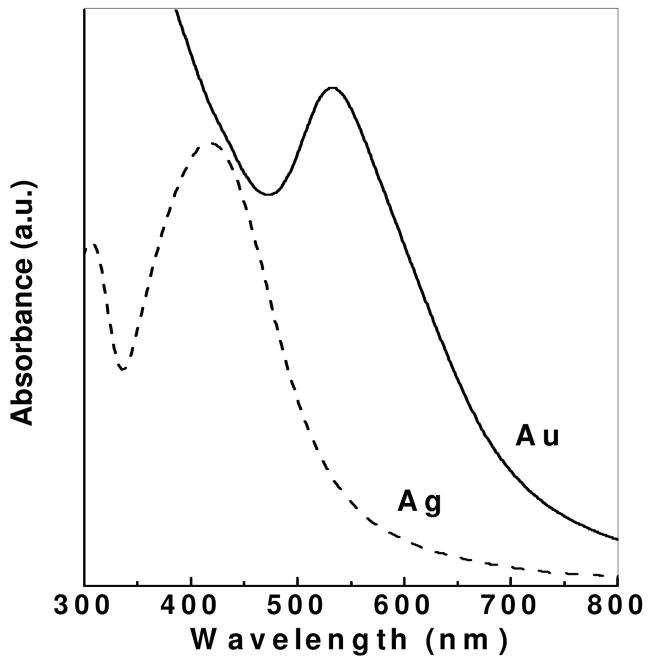
Stabilized Au and Ag nanoparticles were prepared using heparin derivatized with a diaminopyridine group at the reducing end synthesized through reductive amination (DAPHP). It is believed that the aldehyde on the reducing end of the residual underivatized heparin present in the DAPHP reduces AuCl4 and AgNO3, while the DAP on the derivatized DAPHP provides a strong interaction between its amino/pyridine group and the Au or Ag nanoparticles. The bioconjugates prepared in this synthesis were analyzed by UV-Vis spectroscopy. The UV-Vis spectra recorded on Au and Ag nanoparticles solutions synthesized using DAPHP are shown in Figure 1. A strong resonance at approximately 533 and 400 nm, respectively, is observed for Au and Ag nanoparticles in solution, due to the excitation of surface plasmon vibrations. The surface plasmon resonance band is shifted towards a higher wavelength, compared with Au and Ag nanoparticles of the similar sizes synthesized with other conventional methods. This shift can be explained by the interaction between the DAPHP and the particles, which influences the surface plasmon resonance band. The UV-Vis spectra of Au and Ag nanoparticle solutions remained unchanged over several months when stored at 20 °C, indicating the nanoparticle size distribution in water was extremely stable. Nanoparticles are stabilized by the bound DAPHP and show no sign of aggregation.
Figure 1.
UV-visible spectra of gold (solid) and silver (dashed) nanoparticles synthesized by DAPHP molecules. The plasmon peak at ~533 nm confirms the presence of AuNPs, while the plasmon peak at ~400 nm corresponds to the formation of AgNPs. Arbitrary units (a.u.).
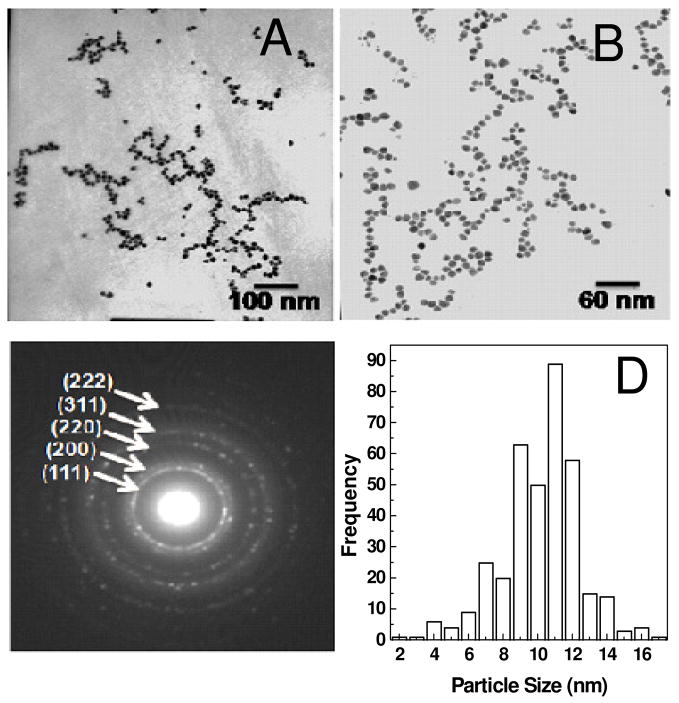
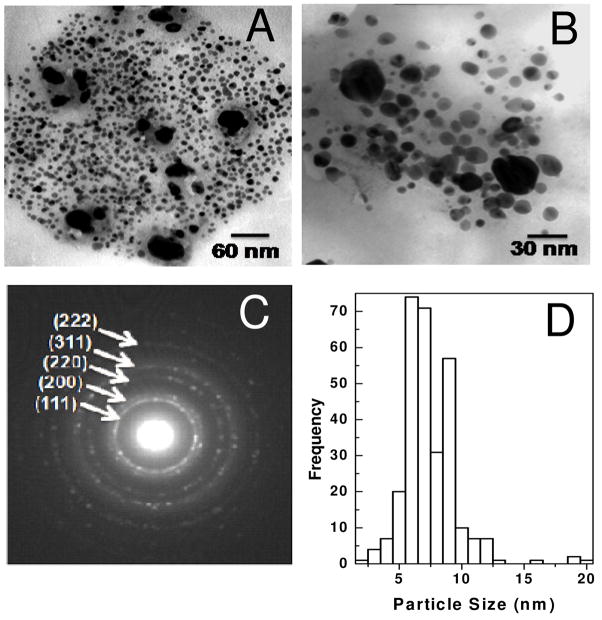
Au and Ag nanoparticles synthesized using DAPHP were analyzed by TEM. A drop-coated film of aqueous solution of nanoparticles was formed on carbon-coated copper grid by solvent evaporation and analyzed by TEM. TEM images of Au and Ag nanoparticle films formed are shown in Figure 2 and 3, respectively. The diffraction patterns of the particles show the face-centered cubic (FCC) of Au (Figure 2c) and Ag (Figure 3c) bioconjugate. The particle size distribution (PSD) of the DAPHP capped Au and Ag nanoparticles were calculated based on Figures 2A and 3A, affording particle sizes 10 ± 3 nm and 7 ± 3 nm for Au-DAPHP and Ag-DAPHP nanoparticles, respectively.
Figure 2.
TEM image of Au-DAPHP capped gold nanoparticles show uniform size distribution at (a) 100kx and (b) 160kx. (c) Diffraction pattern of AuNPs show their corresponding FCC. (d) Particle size distribution (PSD) of AuNPs is 10 nm ± 3 nm.
Figure 3.
TEM image of Ag-DAPHP capped silver nanoparticles at (a) 160 kx and (b) 340kx. (c) Diffraction pattern reveal FCC of AgNPs. (d) Particle size distribution (PSD) of AgNPs is 7 nm ± 3 nm.
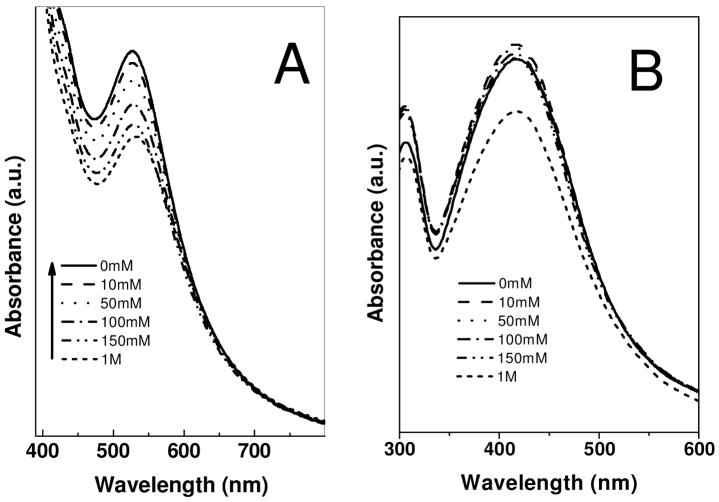
The instability of nanoparticles, particularly in the presence of electrolytes, is a major issue in colloidal chemistry. Electrolyte-induced precipitation of nanoparticles from the aqueous phase is commonly observed. Strouse et al. has shown that colloidal gold nanoparticles can be precipitated by addition of an electrolyte and that, under certain conditions, these nanoparticles can be redispersed in water.36 The stability, of Au-DAPHP and Ag-DAPHP nanoparticle solutions in the current study, were checked as a function of NaCl (electrolyte) concentration. The UV-Vis spectra of solution of Au-DAPHP and Ag-DAPHP nanoparticle were examined after addition of sodium chloride as shown in Figure 4A and 4B. After addition of different amounts of NaCl, the UV-Vis spectra remained unchanged. Even high NaCl concentrations (1M) do not destabilize these colloidal solutions. The high stability of these DAPHP nanoparticles is both due to electrostatic and steric factors.
Figure 4.
UV-visible spectra of (a) gold and (b) silver nanoparticles synthesized by DAPHP molecules as a function of increasing NaCl concentration from 0 – 1 M. Arbitrary units (a.u.).
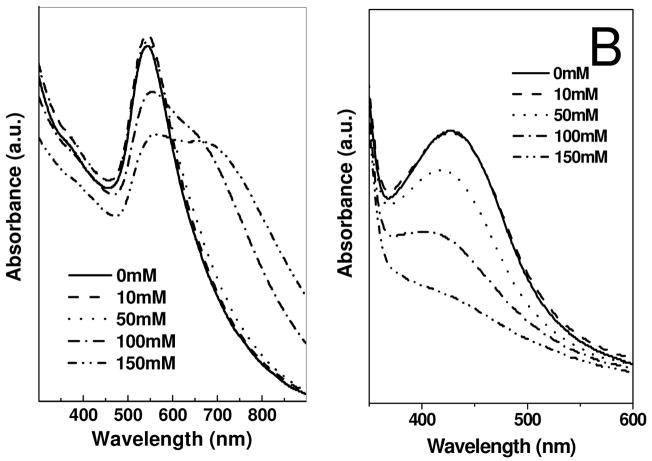
Au-DAPHP and Ag-DAPHP particles were further purified by centrifugation and washing. The stability of these purified nanocomposites was again examined as a function of NaCl concentration, to obtain further insight into colloidal stabilization. The UV-Vis spectra of redispersed purified Au-DAPHP and Ag-DAPHP nanoparticles solution were taken after addition of 0 to 150 mM NaCl (Figure 5A and 5B). There is an increase in absorbance at ~650 nm or broadening in the absorbance of purified Au-DAPHP on increasing the concentration of NaCl (Figure 5A). Similar trends in the broadening in surface plasmon resonance are also observed in the Ag-DAPHP nanoparticle solution (Figure 5B). The broadening and increase in plasmon resonance at higher wavelength indicates aggregation of nanoparticles. While some aggregation takes place in 150 mM NaCl, the activity of the particles within an electrolyte solution might behave differently in vivo, since the particles are coming in contact with many other biomolecules present in biological fluids. Therefore, the tolerance limits for specific biomedical purposes would need to be further addressed depending on the application being used. This decrease in stability of purified samples, suggest that some DAPHP polysaccharide molecules bind the bioconjugate via week electrostatic interaction and that these free polysaccharides can be desorbed from the surface of bioconjugate on repeated washing.
Figure 5.
UV-visible spectra of purified and redispersed (a) gold and (b) silver nanoparticles synthesized by DAPHP molecules as a function of NaCl concentration from 0 – 150 mM. Arbitrary units (a.u.).
Quantification of DAPHP chains bound to the surface of the purified Au-DAPHP and Ag-DAPHP nanoparticles was then determined using carbazole assay.28 This assay detects the uronic acids that are present within these polysaccharides. The theoretical calculation DAPHP attached to Au and Ag nanoparticles using heparinase digestion was calculated to be ~50 heparin chains/AuNP and ~20 heparin chains/AgNP. This method was used to determine DAPHP concentration for anticoagulant assays. To further investigate the loading of DAPHP onto AuNPs the concentration of AuNPs was estimated by two different methods and heparin was displaced by an excess amount of DTT; based on these concentrations heparin loading on the nanoparticles was ~80 heparin chains/AuNP (Supporting Information). Heparin has the highest negative charge of any known biomolecule.21 The number of chains/particle is certainly limited due to the electrostatic repulsion of heparin, hindering a tighter packing of chains onto the particles. The heparin loading onto AgNPs is theorized to be slightly less since the binding of the amine groups is not as strong to Ag as it is to Au.
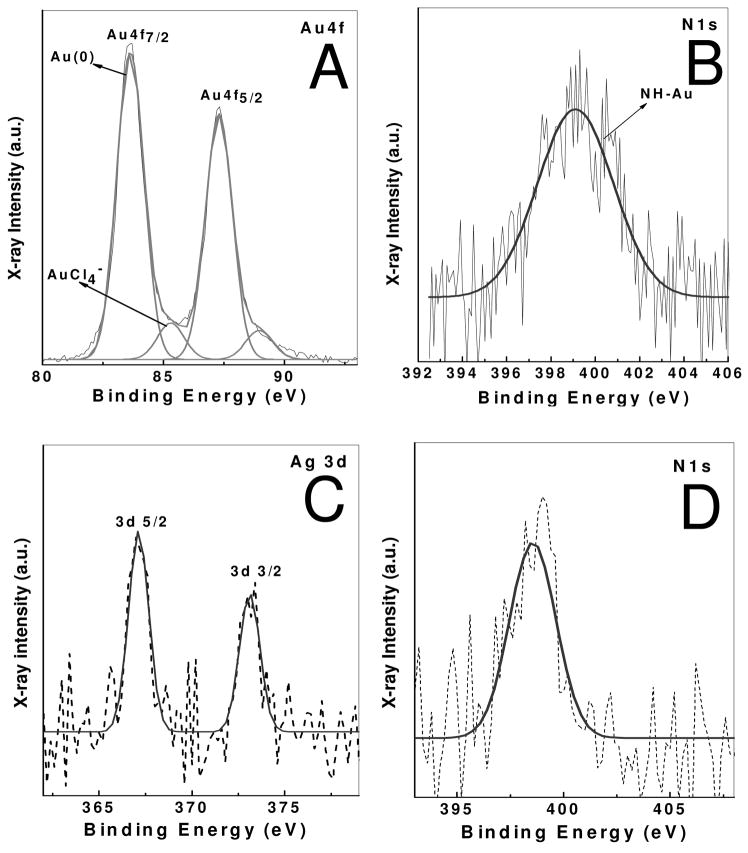
Purified DAPHP-stabilized Au and Ag nanoparticle films were drop coated on Si (111) substrates and analyzed by XPS. The general scan spectrum showed the presence of the principal C1s, N1s, Au 4f and Ag 3d core levels with no evidence of impurities. The film was sufficiently thick and therefore, no signal was measured from the substrate (Si 2p core level). The C1s, N1s, and Au 4f core levels recorded from this film are shown in Figure 6A. The spectra have been corrected for any background signals using the Shirley algorithm37 prior to curve resolution. The Au 4f core level could be satisfactorily fit to a two spin-orbit pair at 84 and 86 eV (4 f7/2). These values are in good agreement with published values for gold nanoparticles.38 These bands correspond to Au (0) and Au (III) state. Presence of higher binding energy components indicates the presence of Au (III) ions adsorbed on gold nanoparticles surface or as an impurity in purified solution. N1s band is observed at 399 eV, which correspond to the nitrogen atom of DAPHP molecules attached to gold nanoparticles. Similarly spin-orbit 367 (3 d5/2) can be seen in Ag-DAPHP film molecules (Figure 6C), corresponding to Ag (0). N1s band at ~ 399 eV corresponds to N1s atom of DAPHP molecules attached to silver nanoparticles (Figure 6D). Both films show C1s core level, which could be stripped into three components at 285, 286 and 287.8 eV and are assigned to the electron emission from the advantageous carbon and the carbons coordinated to hydroxyl and carboxylic groups, respectively, in heparin molecules (data not shown). Presence of C1s and N1s spectra reveals that the nanoparticles are stabilized by the DAPHP molecules. It is clear from the UV-visble, TEM and XPS studies that nanoparticles form on reduction of gold chloride by heparin and are stable at high electrolyte concentration. The reaction mechanism is not clear. However, it has been shown that other monosaccharide sugars reduce gold chloride by the reducing end of the residue.39
Figure 6.
XPS spectra of Au-DAPHP and Ag-DAPHP naoparticles film form by drop coating film on Si (111) substrate. (a) Au 4f core level spectra of from Au-DAPHP, (b) N1s core level spectra from Au-DAPHP, (c) Ag 3d core level spectra from Ag-DAPHP, (d) N1s core level spectra from Ag-DAPHP. Arbitrary units (a.u.).
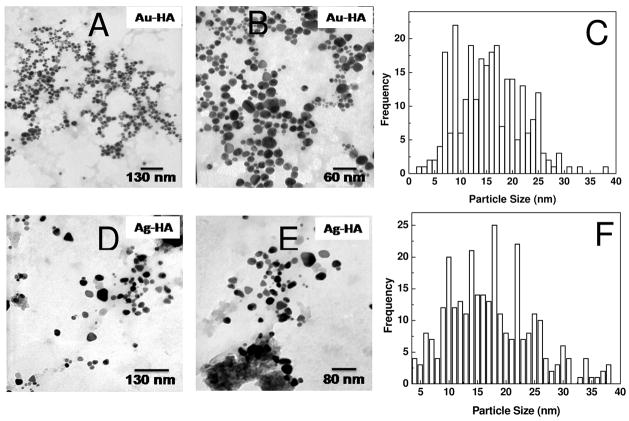
HA is commonly found in the extracellular matrix and provides a protective barrier around cells. Since this GAG has no anticoagulant activity, we extended our study to synthesize Au and Ag nanoparticles using hyaluronan. HA also acted as a reducing agent and was capable of synthesizing and stabilizing the nanoparticles. HA nanoparticle composites were analyzed by TEM (Figure 7). The Au-HA and Ag-HA nanocomposites were polydisperse with a size histogram ranging from of 5 to 30 nm. This polydispersity is greater than that observed for Au-DAPHP and Ag-DAPHP, because, the DAPHP contains a diaminopyridine moiety that binds tightly to the surface particles formed controlling their size and polydispersity. Hyaluronan binds Au and Ag weaker than DAPHP, resulting in a greater dispersity in nanocomposite size and shape.
Figure 7.
TEM image of drop coated film of Au-HA at (a) 75 kx, (b) 160kx, (c) with broad size distribution of ~5 – 30 nm. TEM image of Ag-HA nanoparticles at (d) 75 kx, (e) 125 kx (f) and size distribution from ~6 – 26 nm.
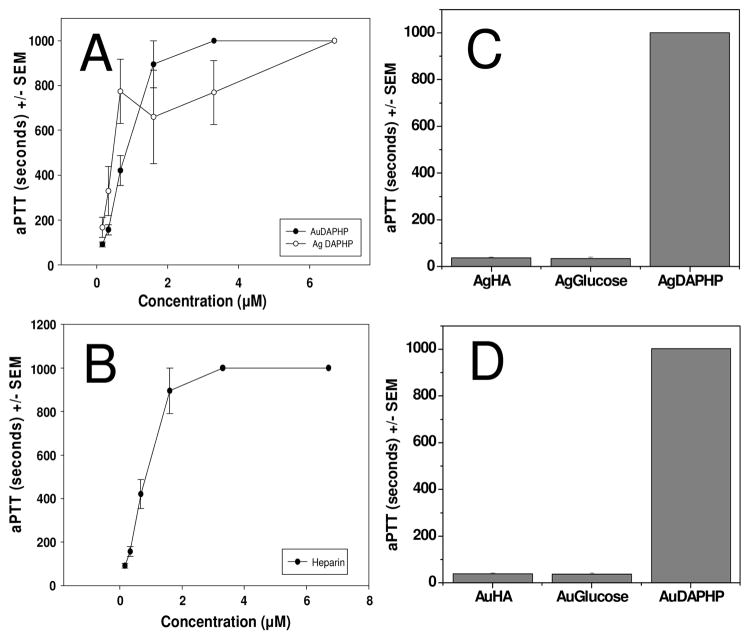
The biological activity of heparin is most commonly determined by coagulation-based assays such as aPTT, which measures inhibition of the blood coagulation cascade.29 The anticoagulant activity of DAPHP capped gold nanoparticles was compared with free DAPHP molecules (Figure 8). Either Au-DAPHP or Ag-DAPHP resulted in a concentration-dependent prolongation of clotting time or aPTT that is comparable to that obtained with DAPHP or heparin (Figure 8A and B). In contrast, Au- or Ag-glucose, Au-HA or Ag-HA did not exhibit any effect on aPTT as compared to Au-DAPHP or Ag-DAPHP at the same molar concentration (Figure 8C and D). These in vitro data clearly indicate the sole contribution of DAPHP linked to Au or Ag in the inhibition of coagulation, without any significant contributions by Au, Ag or HA (Figure 8C and D).
Figure 8.
Effects of (a) Au-DAPHP (solid) and Ag-DAPHP (open) and (b) free DAPHP on aPTT in human plasma. The coagulation times for (c) Ag-HA or Ag-glucose, and (d) Au-HA or Au-glucose fell within the normal control ranges. Data represent mean ± SEM, n = 6. Concentration of DAPHP was based on carbazole assay and concentrations of sugars were 6.7 μM.
Furthermore, the effects of free DAPHP, Au-DAPHP and Ag-DAPHP on platelet/fibrin clot dynamics in human blood was evaluated using thrombelastography.30–34 The time to clot initiation (R in minutes) or clot strength (MA in mm) for Au- or Ag-glucose, Au-HA or Ag-HA fell within the normal control ranges (Table 1). In contrast, Au-DAPHP or Ag-DAPHP at the same DAPHP molar concentration resulted in maximal inhibition of clot strength and without clot initiation for the duration of the study (Table 1). These in vitro data again clearly confirm the main contribution of DAPHP linked to Au or Ag in affecting coagulation, without any significant contributions by Au, Ag or HA (Table 1).
Table 1.
Effect of Gold and Silver heparin Nanoparticles on Clot Dynamics in Human Blood using Thrombelastography
| Test Compounds |
Concentration of sugars (μM) |
R (min) |
MA (mm) |
|---|---|---|---|
| Control | 15.2 ± 3.3 | 54.5 ± 3.5 | |
| Glucose | 2.7μM | 15.5 ± 3.1 | 53.7 ± 3.0 |
| Au-Glucose | 2.7μM | 17.2 ± 2.4 | 52.4 ± 3.5 |
| Ag-Glucose | 2.7μM | 17.6 ± 2.7 | 54.0 ± 3.1 |
| DAPHP | 0.4μM | > 60 * | 0 * |
| Au-DAPHP | 0.4μM | > 60 * | 0 * |
| Ag-DAPHP | 0.4μM | > 60 * | 0 * |
| DAPHP | 0.1μM | 22.9 ± 2.5* | 52.4 ± 3.2 |
| Au-DAPHP | 0.1μM | 31.4 ± 2.1* | 46.9 ± 3.5 |
| Ag-DAPHP | 0.1μM | 19.2 ± 2.6 | 52.1 ± 2.5 |
| HA | 2.7μM | 14.1 ± 2.0 | 60.4 ± 4.5 |
| Au-HA | 2.7μM | 15.0 ± 2.1 | 54.8 ± 2.9 |
| Heparin | 0.1μM | 19.9 ± 2.0* | 28.6 ± 3.6* |
| Heparin | 0.2μM | 27.3 ± 2.2* | 47.7 ± 2.9 |
| Heparin | 0.4μM | > 60 * | 0* |
Data represent mean ± SD, n = 5,
P < 0.01
A rat carrageenan model of paw edema was utilized to determine the potential anti-inflammatory efficacy of Au or Ag nanocomposites. In that regards, it has been previously demonstrated that the mixture of Cu, Au and Ag significantly decreased inflammatory disorders induced by adjuvant arthritis in the rat. The treatment with the mixture at low levels but not with the individual metals had a significant preventive effect. The results indicate an enhanced effect of the metal mixture in the model studied.40 Additionally, carrageenan-induced paw edema of mice and rats were suppressed by intravenous injection of heparin, corresponding well to the increase in plasma endothelial superoxide dismutase activity release by heparin in rats or mice. A dose response curve that was biphasic in nature was also observed for the ischemic paw model of mice. Electron microscopy confirmed that injections of heparin prevented the ischemia-induced mitochondrial swelling of the paw muscle.41 Similarly, the antioxidant activity of HA in a rat model of collagen-induced arthritis has been studied. Treatment with HA starting at the onset of arthritis for 10 days, limited the erosive action of the disease in the articular joints of knee and paw, reduced lipid peroxidation, restored the endogenous antioxidants reduced glutathione and superoxide dismutase, decreased plasma TNF-alpha levels, and limited synovial neutrophil infiltration.42
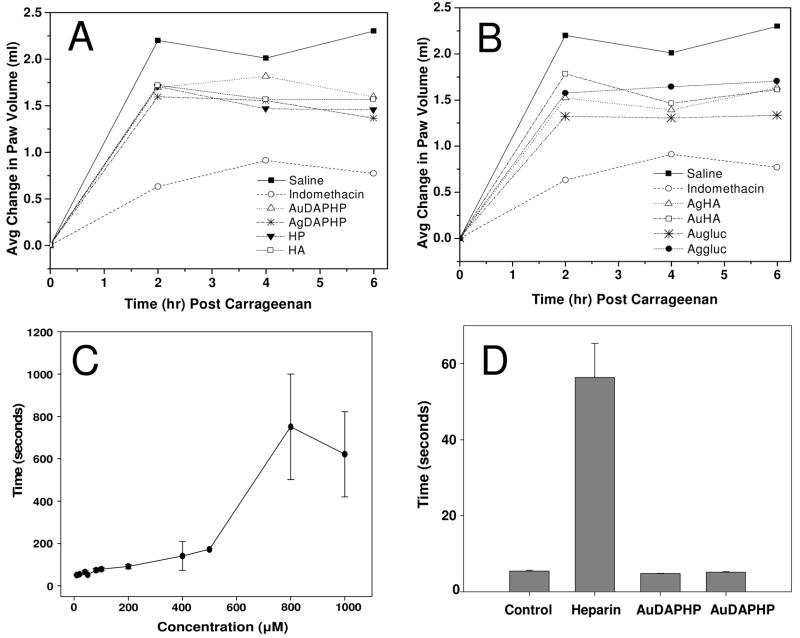
The effects of free DAPHP, Au-DAPHP and Ag-DAPHP on carrageenan-induced paw edema in rats as compared to Indomethacin were evaluated. Significant inhibition of carrageenan-induced paw edema was shown for Au-glucose or Ag-glucose, Au-HA or Ag-HA versus heparin (Figure 9A and B). In contrast, Au-DAPHP and Ag-DAPHP nanoparticles administered locally in the paw did not exhibit any systemic effect on aPTT as compared to locally administered heparin (Figure 9C). Data indicated significant inhibition of carrageenan-induced paw edema in rats by Au-glucose, Ag-glucose, Au-HA, Ag-HA, heparin, Au-DAPHP and Ag-DAPHP, without any systemic effects on hemostasis as compared to heparin suggesting the potential for local inhibition of inflammation without systemic adverse effect using Au-heparin or Ag-heparin as compare to free heparin.
Figure 9.
Effects of free DAPHP, Au-DAPHP and Ag-DAPHP on carrageenan-induced paw edema in rats as compared to Indomethacin. Significant inhibition of carrageenan-induced paw edema was shown for Au- or Ag-glucose, Au-HA or Ag-HA versus heparin (A and B). In contrast, Au-DAPHP and Ag-DAPHP nanoparticles administered locally in the paw did not exhibit any systemic effect on aPTT as compared to locally administered heparin (C and D). Data represent mean ± SEM, n = 5 per group.
Conclusions
The current study demonstrates that Au and Ag nanoparticle composites can be synthesized and stabilized with both heparin and hyaluronan. The nanocomposites are much more stable at physiological electrolyte concentrations than naked nanoparticles, because the heparin bound to the particles provides electrostatic repulsion from other particles. Furthermore, the current study also demonstrates in vivo and in vitro biological activity. Heparin bound to both Au and Ag nanoparticles still retains its anticoagulant activity. Heparin present on the surface increases the biocompatibility of these nanoparticles. These derivatized particles can be further modified and used as nano-carriers in vivo with reduced risk of coagulation and rejection from the immune system. This studied also showed that these particles can provide localization for anti-inflammatory applications. Localization can be important to deliver a more prolonged effect of these nanocomposites; while other drugs can rapidly diffuse into the body, reducing their activity over time. These nanocomposites maybe useful in a wide variety of biological and biomedical applications that take advantage of the biological activities of heparin and hyaluronan, as well as the unique physical attributes of Au and Ag core nanoparticles.
Supplementary Material
Supporting Information: Detailed protocol of carbazole assay, as well as calculation of nanoparticle concentration for Au-DAPHP to approximate DAPHP loading onto AuNPs. This information is available free of charge via the Internet at http://pubs.acs.org.
Acknowledgments
This work was supported by grants from the National Institutes of Health (HL62244 to RJL), (The Pharmaceutical Research Institute to SM) and the National Science Foundation (III-CXT: 0713517 and CRI:IAD: 0709099 (IIS0713517) to RJL).
References
- 1.O’Neal DP, Hirsch LR, Halas NJ, Payne JD, West JL. Cancer Lett (Amsterdam, Neth) 2004;209:171–176. doi: 10.1016/j.canlet.2004.02.004. [DOI] [PubMed] [Google Scholar]
- 2.Hirsch LR, Stafford RJ, Bankson JA, Sershen SR, Rivera B, Price RE, Hazle JD, Halas NJ, West JL. Proc Natl Acad Sci U S A. 2003;100:13549–13554. doi: 10.1073/pnas.2232479100. [DOI] [PMC free article] [PubMed] [Google Scholar]
- 3.Huang X, El-Sayed IH, Qian W, El-Sayed MA. J Am Chem Soc. 2006;128:2115–2120. doi: 10.1021/ja057254a. [DOI] [PubMed] [Google Scholar]
- 4.Cognet L, Tardin C, Boyer D, Choquet D, Tamarat P, Lounis B. Proc Natl Acad Sci U S A. 2003;100:11350–11355. doi: 10.1073/pnas.1534635100. [DOI] [PMC free article] [PubMed] [Google Scholar]
- 5.Skirtach AG, Dejugnat C, Braun D, Susha AS, Rogach AL, Parak WJ, Moehwald H, Sukhorukov GB. Nano Lett. 2005;5:1371–1377. doi: 10.1021/nl050693n. [DOI] [PubMed] [Google Scholar]
- 6.Li J, Wang X, Wang C, Chen B, Dai Y, Zhang R, Song M, Lv G, Fu D. ChemMedChem. 2007;2:374–378. doi: 10.1002/cmdc.200600264. [DOI] [PubMed] [Google Scholar]
- 7.Shrivas K, Wu HF. Anal Chem (Washington, DC, U S) 2008;80:2583–2589. doi: 10.1021/ac702309w. [DOI] [PubMed] [Google Scholar]
- 8.Lee JS, Ulmann PA, Han MS, Mirkin CA. Nano Lett. 2008;8:529–533. doi: 10.1021/nl0727563. [DOI] [PubMed] [Google Scholar]
- 9.Pissuwan D, Valenzuela SM, Cortie MB. Trends Biotechnol. 2006;24:62–67. doi: 10.1016/j.tibtech.2005.12.004. [DOI] [PubMed] [Google Scholar]
- 10.Rivas L, Sanchez-Cortes S, Garcia-Ramos JV, Morcillo G. Langmuir. 2001;17:574–577. [Google Scholar]
- 11.Zhang Z, Patel RC, Kothari R, Johnson CP, Friberg SE, Aikens PA. J Phys Chem B. 2000;104:1176–1182. [Google Scholar]
- 12.Plyuto Y, Berquier JM, Jacquiod C, Ricolleau C. Chem Commun (Cambridge) 1999:1653–1654. [Google Scholar]
- 13.Wang T, Zhang D, Xu W, Yang J, Han R, Zhu D. Langmuir. 2002;18:1840–1848. [Google Scholar]
- 14.Guari Y, Thieuleux C, Mehdi A, Reye C, Corriu RJP, Gomez-Gallardo S, Philippot K, Chaudret B. Chem Mater. 2003;15:2017–2024. [Google Scholar]
- 15.Ohno K, Koh K, Tsujii Y, Fukuda T. Angew Chem, Int Ed. 2003;42:2751–2754. doi: 10.1002/anie.200250850. [DOI] [PubMed] [Google Scholar]
- 16.Tan Y, Jiang L, Li Y, Zhu D. J Phys Chem B. 2002;106:3131–3138. [Google Scholar]
- 17.Mayya KS, Schoeler B, Caruso F. Adv Funct Mater. 2003;13:183–188. [Google Scholar]
- 18.Tanori J, Pileni MP. Langmuir. 1997;13:639–646. [Google Scholar]
- 19.Lytton-Jean AKR, Mirkin CA. J Am Chem Soc. 2005;127:12754–12755. doi: 10.1021/ja052255o. [DOI] [PubMed] [Google Scholar]
- 20.Housni A, Ahmed M, Liu S, Narain R. J Phys Chem C. 2008;112:12282–12290. [Google Scholar]
- 21.Capila I, Linhardt RJ. Angew Chem, Int Ed. 2002;41:390–412. doi: 10.1002/1521-3773(20020201)41:3<390::aid-anie390>3.0.co;2-b. [DOI] [PubMed] [Google Scholar]
- 22.Lee JY, Spicer AP. Curr Opin Cell Biol. 2000;12:581–586. doi: 10.1016/s0955-0674(00)00135-6. [DOI] [PubMed] [Google Scholar]
- 23.Guo R, Zhang L, Zhu Z, Jiang X. Langmuir. 2008;24:3459–3464. doi: 10.1021/la703080j. [DOI] [PubMed] [Google Scholar]
- 24.Gole A, Kumar A, Phadtare S, Mandale AB, Sastry M. PhysChemComm. 2001 No pp given, Paper No 19. [Google Scholar]
- 25.Raveendran P, Fu J, Wallen SL. J Am Chem Soc. 2003;125:13940–13941. doi: 10.1021/ja029267j. [DOI] [PubMed] [Google Scholar]
- 26.Huang H, Yang X. Carbohydr Res. 2004;339:2627–2631. doi: 10.1016/j.carres.2004.08.005. [DOI] [PubMed] [Google Scholar]
- 27.Nadkarni VD, Pervin A, Linhardt RJ. Anal Biochem. 1994;222:59–67. doi: 10.1006/abio.1994.1454. [DOI] [PubMed] [Google Scholar]
- 28.Bitter T, Muir HM. Anal Biochem. 1962;4:330–334. doi: 10.1016/0003-2697(62)90095-7. [DOI] [PubMed] [Google Scholar]
- 29.Mousa SA, Linhardt R, Francis JL, Amirkhosravi A. Thromb Haemostasis. 2006;96:816–821. doi: 10.1160/th06-05-0289. [DOI] [PMC free article] [PubMed] [Google Scholar]
- 30.Cloonan ME, DiNapoli M, Mousa SA. Blood Coagulation Fibrinolysis. 2007;18:341–345. doi: 10.1097/MBC.0b013e3280d9e9b2. [DOI] [PubMed] [Google Scholar]
- 31.Mousa SA, Bozarth JM, Seiffert D, Feuerstein GZ. Blood Coagulation Fibrinolysis. 2005;16:165–171. doi: 10.1097/01.mbc.0000164423.90545.a0. [DOI] [PubMed] [Google Scholar]
- 32.Mousa SA, Forsythe MS. Thromb Res. 2001;104:49–56. doi: 10.1016/s0049-3848(01)00336-x. [DOI] [PubMed] [Google Scholar]
- 33.Mousa SA. Semin Thromb Hemostasis. 2000;26:39–46. doi: 10.1055/s-2000-9492. [DOI] [PubMed] [Google Scholar]
- 34.Mousa SA, Khurana S, Forsythe MS. Arterioscler, Thromb, Vasc Biol. 2000;20:1162–1167. doi: 10.1161/01.atv.20.4.1162. [DOI] [PubMed] [Google Scholar]
- 35.Wise Laura E, Cannavacciulo R, Cravatt Benjamin F, Martin Billy F, Lichtman Aron H. Neuropharmacology. 2008;54:181–188. doi: 10.1016/j.neuropharm.2007.06.003. [DOI] [PMC free article] [PubMed] [Google Scholar]
- 36.Cumberland SL, Strouse GF. Langmuir. 2002;18:269–276. [Google Scholar]
- 37.Shirley DA. Phys Rev B. 1972;3(5):4709–4714. [Google Scholar]
- 38.Kumar A, Mandal S, Selvakannan PR, Pasricha R, Mandale AB, Sastry M. Langmuir. 2003;19:6277–6282. doi: 10.1021/la034209c. [DOI] [PubMed] [Google Scholar]
- 39.Panigrahi S, Kundu S, Ghosh S, Nath S, Pal T. J Nanopart Res. 2004;6:411–414. [Google Scholar]
- 40.Thunus L, Dauphin JF, Moiny G, Deby C, Deby-Dupont G. Analyst (Cambridge, U K) 1995;120:967–973. doi: 10.1039/an9952000967. [DOI] [PubMed] [Google Scholar]
- 41.Oyanagui Y, Sato S. Free Radical Res Commun. 1991;12–13:229–237. doi: 10.3109/10715769109145791. [DOI] [PubMed] [Google Scholar]
- 42.Campo GM, Avenoso A, Campo S, Ferlazzo AM, Altavilla D, Calatroni A. Arthritis Res Ther. 2003;5:R122–R131. doi: 10.1186/ar748. [DOI] [PMC free article] [PubMed] [Google Scholar]
Associated Data
This section collects any data citations, data availability statements, or supplementary materials included in this article.
Supplementary Materials
Supporting Information: Detailed protocol of carbazole assay, as well as calculation of nanoparticle concentration for Au-DAPHP to approximate DAPHP loading onto AuNPs. This information is available free of charge via the Internet at http://pubs.acs.org.


