

Abstract
Background and purpose:
Overfeeding increases adipose tissue mass and leptin production and up-regulates the renin-angiotensin system in adipose tissue in rodents. Here, we determined the effect of chronic treatment with the renin inhibitor, aliskiren, in a model of diet-induced obesity in mice, on: (i) body weight, adipose tissue weight and plasma leptin; (ii) food intake and caloric efficiency; and (iii) angiotensin II (Ang II) in adipose tissue.
Experimental approach:
Four-week-old C57BL/6J mice (n= 40) received aliskiren (50 mg·kg−1·day−1; 6 weeks) by means of a subcutaneous osmotic Alzet minipump. Animals were given either a low-fat (10% kcal from fat) or a high-fat diet (45% kcal from fat) during this period. Food-intake and body-weight variation were monitored during treatment.
Key results:
In addition to a decrease of plasma renin activity, aliskiren reduced body-weight gain, adipose pads and plasma leptin concentration, independent of the diet. In adipose tissue, local concentrations of Ang II were also reduced by aliskiren.
Conclusions and implications:
Aliskiren limited the gain of adiposity in young mice. This effect was not due to changes in food intake or caloric efficiency and might be related to a down-regulation of the local renin-angiotensin system in adipose tissue. These effects were accompanied by reduced plasma leptin levels. As Ang II favours differentiation of adipocytes, it is possible that the decreased adipose tissue was linked to changes in adipocyte size and number.
Keywords: aliskiren, direct renin inhibition, renin-angiotensin system, angiotensin II, diet-induced obesity, adipose tissue, leptin
Introduction
During the last decade, the existence of a local renin-angiotensin system (RAS) in adipose tissue and its functional importance has attracted greater attention (Gorzelniak et al., 2002; Engeli et al., 2003; Paul et al., 2006). White adipose tissue is, after the liver, the most abundant source of angiotensinogen, the initial substrate of the system (Phillips et al., 1993). Angiotensinogen is cleaved by renin, producing angiotensin I (Ang I), which is then converted to angiotensin II (Ang II) by either angiotensin-converting enzyme (ACE) and/or chymase. Ang II is considered to be the major effector peptide of the RAS by binding two different receptors, AT1 and AT2 (Paul et al., 2006). Almost all components of the system have been described in both white and brown adipose tissue (Cassis et al., 1988; Engeli et al., 1999; Paul et al., 2006), and we have recently demonstrated the presence of the whole system in perivascular adipose tissue (Gálvez-Prieto et al., 2008).
From a functional point of view, adipose Ang II has been implicated in adipocyte homeostasis by regulating growth, differentiation and metabolism (Darimont et al., 1994; Harp and DiGirolamo, 1995; Saint-Marc et al., 2001; Janke et al., 2002). Activation of the RAS has been shown in rodents fed with a high-fat (HF) diet for 10–11 weeks (Benson et al., 2004; Boustany et al., 2004), which exhibit a marked increase of plasma concentration of Ang II (Boustany et al., 2004). To the contrary, depletion of the RAS through gene targeting limits gain of body weight during diet-induced obesity (DIO) due to a reduction of adipose tissues in angiotensinogen-deficient (Agt−/−) (Massiera et al., 2001) and renin Ren2c (−/−) mice (Takahashi et al., 2007), as well as in AT1 (Kouyama et al., 2005) or AT2 receptor-deficient mice (Yvan-Charvet et al., 2005). Similar results have been reported by using AT1 receptor blockers (Benson et al., 2004; Araki et al., 2006;Zanchi et al., 2007). Moreover, short-term treatment of rats with the ACE inhibitor captopril (Cassis et al., 2004) reduces the synthesis of adipose Ang II and also decreases leptin synthesis and release. Altogether, these results suggest a pivotal role for adipose RAS in regulating adipocyte metabolism as well as the endocrine function of adipose tissue.
Aliskiren is the first in the new class of orally active non-peptide, low-molecular weight renin inhibitors. It blocks the cleavage of angiotensinogen by renin, which is the rate limiting step of the RAS, and thus allows a complete blockade of the system (Wood et al., 2003). Our hypothesis was that the inhibition of the local adipose RAS by means of chronic treatment with aliskiren might limit gain of body weight and increase of adiposity during DIO. The aim of the study was to characterize an eventual link between the inhibition of RAS and the development of obesity in mice given a HF diet. To address this issue we have characterized, in a model of DIO, the effect of a chronic treatment with aliskiren on: (i) food intake and caloric efficiency; and (ii) body weight, adipose tissue weight and plasma leptin. The effect of aliskiren on local levels of Ang II has been also analysed.
Methods
Animals and experimental model
All animal care and procedures were in accordance with the European Communities Council Directive (86/609/EEC) for the care and use of laboratory animals. Four-week-old male C57BL/6J mice (CRIFA, Barcelona, Spain) weighing 16–18 g (n= 40) were housed under a light/dark cycle (12 h/12 h), in a temperature controlled room (22°C) with standard food and water ad libitum. After 1 week, animals were divided into two groups with similar average body weight, housed 1 per cage and assigned either to a low-fat (LF) or to a HF diet. LF (D12450B, 10 kcal% fat, 70 kcal% carbohydrates and 20% kcal protein; 3.85 kcal·g−1) or HF (D12451, 45 kcal% fat, 35 kcal% carbohydrates and 20% kcal protein; 4.73 kcal·g−1) diets were supplied by Research Diets (New Brunswick, NJ, USA) and will be referred to as LF and HF respectively. LF diet contains the same amount of fat as the standard diet, but the type of fat is lard, the same as that in the HF diet and is a better control diet than a standard chow. For each dietary treatment, animals were implanted for 6 weeks with Alzet osmotic subcutaneous minipumps (model 2004, 200 µL; 0.24 µL·h−1) loaded either with aliskiren [2(S),4(S),5(S),7(S)-N-(2-carbamoyl-2-methylpropyl)-5-amino-4-hydroxy-2,7-isopropyl -8-[4-methoxy-3-(3-methoxypropoxy)phenyl]-octanamide hemifumarate; 50 mg·kg−1·day−1] or saline. Body weight, food intake and caloric efficiency (expressed as Δ body weight in g per kcal consumed; g·kcal−1) were determined twice a week during treatment. At the end of treatment, mice were killed by decapitation, and blood was collected in chilled EDTA-coated polypropylene tubes. Plasma samples were frozen for biochemical determination. Lumbar, mesenteric, epididymal and periaortic adipose tissues were rapidly dissected weighed and stored at −80°C. Weight and volume of adipose tissues were normalized to tibia length.
Plasma measurements
Plasma leptin concentration was analysed by means of a specific radioimmunoassay (RIA) kit for murine leptin (Linco Research, St. Charles, MO, USA; 4.9% intra-assay variation, 3.3% inter-assay variation). Glucose was measured by a spectrophotometric method (Glucose Trinder Method, Roche, Barcelona, Spain). Triglycerides and free fatty acids were determined using the GPO (Biolabo, Maizy, France) and ACS-ACOD (Wako Bioproducts, Richmond, VA, USA) methods respectively.
Renin activity, angiotensinogen, Ang I and Ang II content in plasma and in adipose tissues
For tissue determination of both Ang I and Ang II, samples (10 mg) were homogenized, at 4°C, in Tris (50 mM), pH 7.4 (100 µL), containing an inhibitor cocktail (1 mM EDTA, 1.5 mM pepstatin, 0.2 mM 1,10-phenanthrolene and 0.2 mg·mL−1 neomycin sulphate). Samples were sonicated for 30 s, centrifuged at 20 000×g for 20 min. The fat that forms a solid layer floating on the supernatant was removed, and 50 µL samples of the supernatant were then loaded on a Kromasil C8 column (0.4 × 20 cm) and eluted by means of a linear gradient (20 min) from 26% to 70% acetonitrile/water containing 0.05% trifluoroacetic acid. Fractions containing Ang I and Ang II were collected, then concentrated in a Speedvac system and resuspended in 300 µL Tris (50 mM), pH 7.4. Ang I and Ang II were quantified by specific EIA for mouse Ang I (5% intra-assay variation, 14% inter-assay variation) and Ang II (5% intra-assay variation, 14% inter-assay variation) (Phoenix Pharmaceuticals Inc., Karlsruhe, Germany). For plasma Ang I and Ang II determination, 10 µL plasma was diluted with 40 µL water and processed as described above.
Plasma renin activity (PRA) was analysed in both adipose tissue and plasma following the Ang I antibody-trapping method (Poulsen and Jorgenssen, 1974;Derkx et al., 1991). Briefly, this assay is based in the detection of Ang I in biological samples incubated at 37°C. Incubation allows endogenous renin to cleave Ang I from its precursor angiotensinogen. To avoid further Ang I degradation by ACE and other peptidases, the assay is carried out in presence of a cocktail of peptidase inhibitors together with a large excess of an Ang I antibody, which acts as an Ang I scavenger, thus avoiding Ang I degradation. Ang I concentration is further detected by specific RIA and renin activity expressed as the amount of Ang I generated per unit time. Initial Ang I in the sample is estimated by measuring Ang I concentration in a sample incubated at 4°C. In our assay, plasma aliquots (5 µL) were incubated either at 4°C or 37°C with a specific Ang I antiserum (5 µL; 10×), diluted in Tris buffer (50 mM), pH 7.0, containing 2 mM EDTA, 10 mM L-phenylmethylsulphonyl fluoride and 1 mM 8-hydroxyquinoline sulphate (extraction buffer). After 60 min incubation, samples were transferred to an ice bath then diluted with 90 µL of RIA buffer. Ang I concentration was detected by using a specific RIA assay kit (Phoenix Pharmaceuticals, Inc., Karlsruhe, Germany). For adipose renin activity, 10 mg adipose tissues were homogenized in 0.1 mL extraction buffer. After centrifugation, 10 µL of the supernatant (below the fat layer) were assayed, as described above for plasma. Renin activity was calculated by using the following algorithm: ([Ang I]37°−[Ang I]4°)/t (min), and expressed in pg·mL−1·min−1.
Statistics
The increase in body weight and food and water intake were analysed by repeated measures anova. Other parameters were analysed by a two-way anova. The factors of variation were pharmacological treatment and type of diet. One-way anova, followed by Newman-Keuls's post hoc test, was performed when appropriate. Statistical significance was set at P < 0.05.
Results
Effect of aliskiren on body-weight increase, food intake and caloric efficiency
Figure 1A illustrates the increase of body weight during treatment. This increase was significantly more pronounced in mice on HF diet [two-way anovaF(1,525)= 121.144; P < 0.001, power = 1.0]. Treatment with aliskiren reduced body weight [F(1,525)= 25.924; P < 0.001, power = 0.99] almost by 5% in both groups, and this effect was independent of the type of diet [F(1,525)= 0.672; P= 0.4 for the interaction between dietary and pharmacological treatment].
Figure 1.
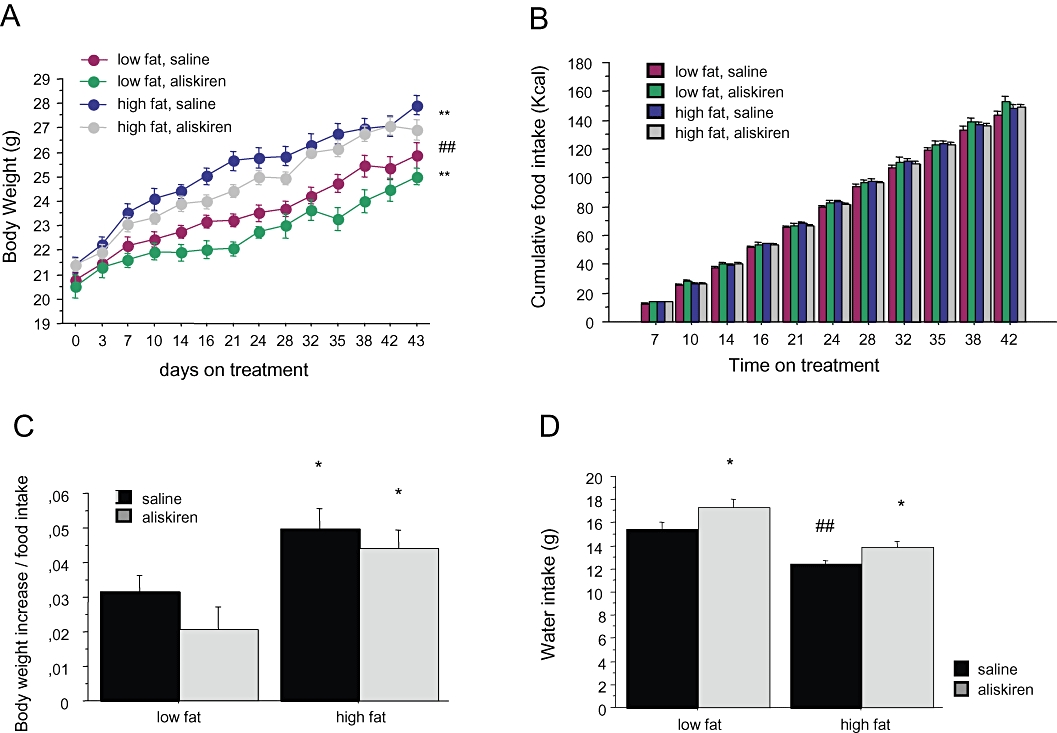
Effect of aliskiren treatment on (A) body weight, (B) cumulated caloric intake, (C) caloric efficiency and (D) water intake in C57BL/6J mice exposed either to a low-fat or at a high-fat diet. *P < 0.05 saline versus aliskiren. **P < 0.001 saline versus aliskiren. ##P < 0.05 low-fat versus high-fat diet.
As shown in Figure 1B, food intake was lower in animals on the HF diet, compared with that of animals on the LF diet [two-way anovaF(1,414)= 12.796; P < 0.001, power = 0.96], and was not affected by aliskiren [F(1,414)= 0.367; P= 0.5], independently of the type of diet [F(1,414)= 0.002; P= 0.9]. Cumulative caloric efficiency (Figure 1C) was significantly more elevated in HF animals [two-way anovaF(1,28)= 11.491; P < 0.01, power = 0.92] and was not modified by aliskiren [F(1,28)= 2.896; P= 0.09; F(1,28)= 0.187; P= 0.7 for the interaction between aliskiren and dietary treatment].
Animals on the HF diet showed a lower water intake (Figure 1D) compared with animals on the LF diet [two-way anovaF(1,265)= 31.610; P < 0.001, power = 1.0]. Treatment with aliskiren increased water intake both in HF and LF animals [two-way anovaF(1,265)= 9.037; P < 0.01, power = 0.87; F(1,265)= 0.126; P= 0.7 for the interaction]. This effect of aliskiren can be considered as an indirect sign of the efficacy of treatment, that is, increased water intake and increased diuresis due to the inhibition of renin.
Effect of aliskiren on weight of adipose tissues
Weight of lumbar, epididymal, mesenteric and periaortic adipose tissues was normalized by tibia length. Animals on the HF diet exhibited threefold higher amount of lumbar adipose tissue compared with mice on the LF diet [two-way anovaF(1,36)= 57.092; P < 0.001, power = 1.0]. Aliskiren treatment significantly reduced (almost 50%) lumbar adipose tissue specifically in the HF group [pharmacological treatment, F(1,36)= 17.482; P < 0.01, power = 0.98; interaction between diet and aliskiren, F(1,36)= 8.433; P < 0.01, power = 0.82] (Figure 2A). As illustrated in Figure 2B, epididymal fat was also heavier in animals receiving the HF diet [two-way anovaF(1,36)= 36.308; P < 0.001, power = 1.0], but in this case aliskiren reduced epididymal adipose tissue [F(1,36)= 14.338; P < 0.01, power = 0.94] both in HF and LF groups [interaction F(1,36)= 1.044; P= 0.3].
Figure 2.
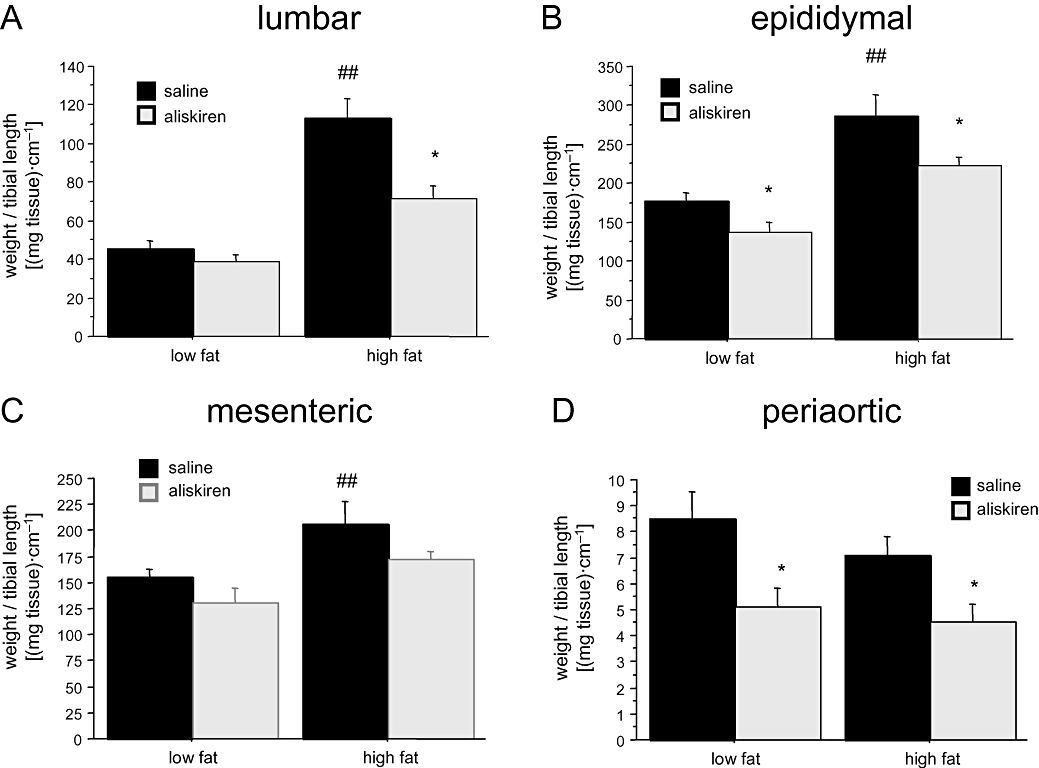
Effect of aliskiren treatment on (A) lumbar, (B) epididymal, (C) mesenteric and (D) periaortic adipose tissue in C57BL/6J mice exposed either to a low-fat or at a high-fat diet. *P < 0.05 saline versus aliskiren. ##P < 0.05 low-fat versus high-fat diet.
Animals on the HF diet also exhibited higher amounts of mesenteric adipose tissue [two-way anovaF(1,36)= 8.532; P < 0.01, power = 0.98], which was reduced by aliskiren [F(1,36)= 5.239; P < 0.05, power = 0.5], independently of the type of diet [interaction F(1,36)= 0.040; P= 0.8] (Figure 2C). Finally, in periaortic adipose tissue (Figure 2D), two-way anova revealed an effect of aliskiren [two-way anovaF(1,36)= 10.420; P < 0.01, power = 0.87], although dietary treatment was ineffective in increasing fat deposits [F(1,36)= 0.960; P= 0.4; F(1,36)= 0.340; P= 0.6 for the interaction between aliskiren and dietary treatment].
Effect of aliskiren on plasma variables
As summarized in Table 1, glucose and free fatty acid concentration was not modified either by diet or by treatment with aliskiren. In contrast, there was a significant effect of dietary treatment on plasma triglycerides [F(1,29)= 6.075; P < 0.05, power = 0.66] and a lack of effect of aliskiren [F(1,29)= 0.240; P= 0.9]. Plasma leptin was not affected by the dietary treatment [two-way anovaF(1,26)= 0.547; P= 0.5], but aliskiren reduced leptin concentration [two-way anovaF(1,24)= 18.040; P < 0.001, power = 1.0], independent of the type of diet [F(1,24)= 0.240; P= 0.6]
Table 1.
Effect of aliskiren on plasma concentration of glucose, free fatty acids, triglycerides and leptin in C57BL/6J mice exposed either to a low-fat (LF) or to a high-fat (HF) diet
|
LF |
HF |
|||
|---|---|---|---|---|
| Vehicle | Aliskiren | Vehicle | Aliskiren | |
| Glucose (mg·L−1) | 13.5 ± 0.6 | 13.7 ± 0.4 | 14.9 ± 0.3 | 13.9 ± 0.8 |
| Free fatty acids (mM) | 0.39 ± 0.02 | 0.38 ± 0.01 | 0.36 ± 0.04 | 0.34 ± 0.04 |
| Triglycerides (mg·L−1) | 5.8 ± 0.4 | 7.6 ± 0.5* | 8.8 ± 0.7≠ | 7.3 ± 0.3 |
| Leptin (ng·mL−1) | 10.4 ± 1.2 | 6.5 ± 0.9*** | 13.6 ± 2.0 | 7.5 ± 0.5*** |
P < 0.05,
P < 0.05 saline versus aliskiren,
P < 0.05 (Newman-Keuls's test).
Effect of aliskiren on plasma renin activity
Plasma renin activity was not modified by dietary treatment [two-way anovaF(1,16)= 2.511; P= 0.1] but was significantly reduced by aliskiren [F(1,16)= 14.069; P < 0.01, power = 0.95], independently of the type of diet [F(1,16)= 0.824; P= 0.4 for the interaction]. As illustrated in Figure 3, aliskiren reduced renin activity in the LF group [one-way anovaF(1,9)= 8.531; P < 0.05] and almost abolished the enzymatic activity in the HF group [one-way anovaF(1,7)= 7.896; P < 0.05].
Figure 3.
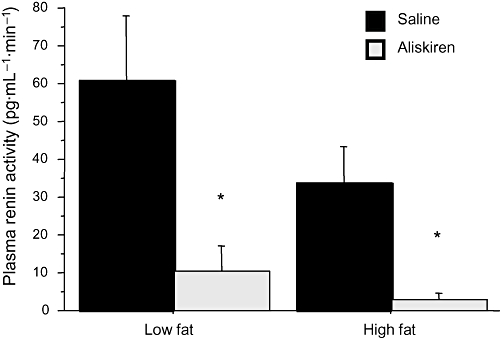
Effect of aliskiren on plasma renin activity. Results are expressed as mean ± SEM. *P < 0.05 saline versus aliskiren.
Effect of aliskiren on adipose tissue renin-angiotensin system
In the mesenteric adipose tissue, neither dietary nor pharmacological treatment affected Ang I concentration (two-way anova; Figure 4A). In contrast, we detected a significant effect of aliskiren on Ang II concentration [F(1,30)= 4.222; P < 0.05, power = 0.5], which was independent of dietary treatment [F(1,30)= 1.961; P= 0.3; F(1,30)= 0.338; P= 0.4 for the interaction] (Figure 4B).
Figure 4.
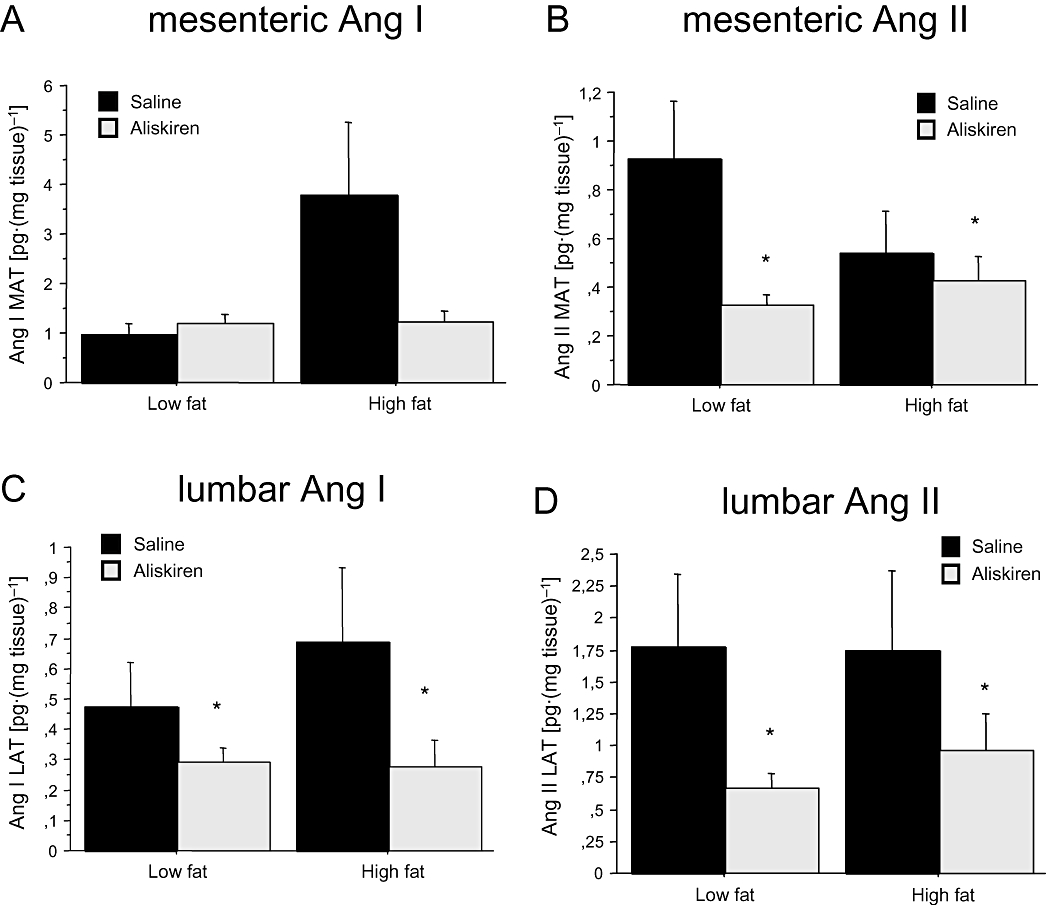
Effect of aliskiren on Ang I concentration in (A) mesenteric and (C) lumbar adipose tissue, and on Ang II concentration in (B) mesenteric and (D) lumbar adipose tissue. Results are expressed as mean ± SEM. *P < 0.05 saline versus aliskiren. Ang I, angiotensin I; Ang II, angiotensin II; LAT, lumbar adipose tissue; MAT, mesenteric adipose tissue.
In lumbar adipose tissue, we found a significant effect of pharmacological treatment on Ang I levels [two-way anovaF(1,31)= 3.905; P < 0.05, power = 0.5], which was independent of dietary treatment [F(1,31)= 0.404; P > 0.05 and F(1,31)= 0.583; P > 0.05, for dietary treatment and the interaction between diet and aliskiren respectively] (Figure 4C). In the case of Ang II, the effect of aliskiren was also significant [F(1,34)= 3.900; P < 0.05, power = 0.5], and this effect was independent of the type of diet [F(1,34)= 0.404; P= 0.5; F(1,34)= 0.450; P= 0.4 for the interaction] (Figure 4D).
Tissue leptin content
In lumbar adipose tissue, neither dietary nor pharmacological treatments affected leptin content. In the case of mesenteric adipose tissue, neither dietary treatment [F(1,24)= 0.285; P= 0.6] nor aliskiren [F(1,24)= 0.099; P= 0.7] treatment had significant effects, but there was a significant interaction between both [F(1,24)= 4.925; P < 0.05; power = 0.6]. Aliskiren only decreased leptin content in the mesenteric pad from the LF group [one-way anovaF(1,11)= 23.073, P < 0.001] (Figure 5A), but was without effect in lumbar adipose tissue (Figure 5B).
Figure 5.
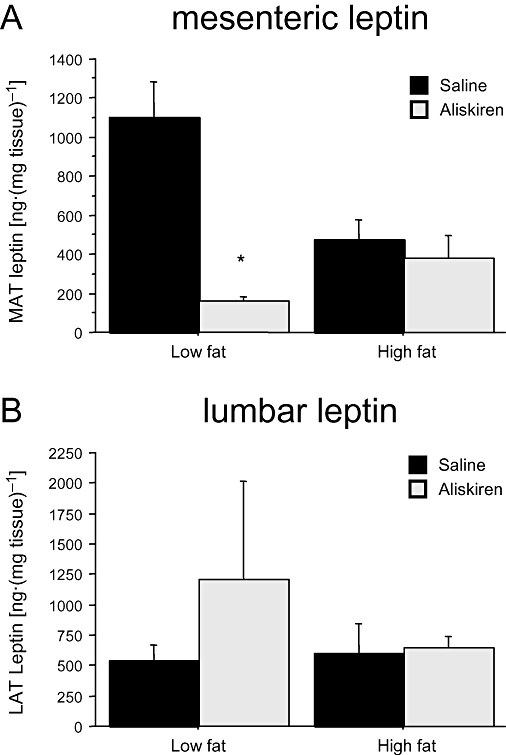
Effect of aliskiren treatment on (A) mesenteric and (B) lumbar adipose tissue leptin in C57BL/6J mice exposed either to a low-fat or at a high-fat diet. Results are expressed as mean ± SEM. *P < 0.05 saline versus aliskiren. LAT, lumbar adipose tissue; MAT, mesenteric adipose tissue.
Discussion
There are several main findings in this study. First, aliskiren reduced adipose levels of Ang I and Ang II, mainly in lumbar adipose tissue, and limited the gain of adiposity in young mice. Second, the effect of aliskiren on adipose tissue was accompanied by a reduction of plasma leptin concentration. Because Ang II is involved in adipocyte differentiation, the reduction of adipose tissue might reflect changes in adipocyte size and number, and thus account for an improvement of adipokine dysregulation. Finally, most effects of aliskiren were independent of the type of diet, suggesting that aliskiren might also induce changes in adipose tissue of lean subjects.
The design and synthesis of direct renin inhibitors as a new drug class has been attempted for more than 30 years. As renin is the initial limiting step in Ang II synthesis, it represents the best target for a complete inhibition of the RAS. Peptidic renin inhibitors were the first drugs available to these purposes, but their low bioavailability limited their usefulness as pharmacological tools (Staessen et al., 2006). Aliskiren is the first non-peptidic and orally active renin inhibitor, which has progressed to clinical use as an antihypertensive treatment. Our interest was to analyse the effect of aliskiren on the adipose RAS. For this purpose, we have used a DIO model, which reproduces most metabolic changes detected in obese humans including changes in adipokine profile, worsening of lipid management and poor response to insulin. As previously documented by other authors, 6 weeks on a HF diet increased body-weight gain, as well as the weight of adipose pads (Araki et al., 2006). This effect was not linked to a caloric surplus, as daily caloric intake in HF and LF groups was similar, but seemed to be linked to diet composition. In our model, plasma and adipose tissue RAS was not modified by the HF diet. This might be due to the duration of dietary treatment as the up-regulation of both local and systemic RAS seem to occur after longer exposure to HF diets (10–12 weeks) (Boustany et al., 2004).
Aliskiren prevented body-weight gain and expansion of adipose pads without affecting food intake. Similar results have been obtained by inhibition of the RAS with the Ang II receptor antagonist, telmisartan (Araki et al., 2006) as well as by disruption of the renin gene (Takahashi et al., 2007). Thus, although aliskiren does not significantly modify caloric efficiency, it may be that this drug has a negative impact on the ability of adipose pads to store energy and suggests an effect of the drug on lipid metabolism and distribution. This effect seems to depend on the inhibition of Ang II-mediated actions on adipose tissue in terms of cell differentiation, growth regulation, differentiation and metabolism (Darimont et al., 1994; Harp and DiGirolamo, 1995; Saint-Marc et al., 2001; Janke et al., 2002) and appears to be independent of the type of diet. The reduction of Ang I and Ang II levels was more significant in lumbar adipose tissue. Interestingly, the amount of this adipose pad showed the most significant increase with the HF diet (approximately threefold) and the most significant reduction by aliskiren treatment. In the mesenteric adipose tissue, aliskiren only decreased Ang II, independently of the type of diet and in parallel with a rather modest effect on the amount of this adipose pad.
Effective inhibition of the RAS by aliskiren was assessed by the decrease of PRA, which was independent of the type of diet. Adipose renin activity could not be detected, either in lumbar or in mesenteric adipose tissue, despite using several homogenization buffers and protocols to solubilize angiotensinogen. This fact does not exclude, however, efficient renin inhibition in the adipose tissue as demonstrated by the reduction in Ang I and Ang II levels.
One of the main problems linked to an increase of adipose tissue mass in obesity is the dysregulation of adipokine production. Adipose tissue is the main source of plasma leptin that correlates with the degree of adiposity. In this context, the reduction of plasma leptin evoked by aliskiren probably reflects a reduction of the amount of adipose tissue. Alternatively, the decrease of leptin levels might be also a consequence of the reduction of local Ang II. In fact Ang II has been shown to induce leptin gene (ob) expression (Jones et al., 1997) and secretion (Kim et al., 2002) in adipocytes, and a pivotal role of locally produced Ang II in stimulating leptin release has been reported (Cassis et al., 2004). In our hands, regulation of leptin by Ang II seems to depend on the local, but not on the systemic, concentration of this peptide because plasma RAS is unaffected by aliskiren. Moreover, leptin levels have been shown to depend exclusively on adipose angiotensinogen expression (Kim et al., 2006). The fact that the reduction of plasma leptin levels is not paralleled by a reduction in tissue leptin levels suggests that leptin expression or synthesis is not affected by aliskiren. This effect has to be considered as a benefit of this drug, because the ability of adipose tissue to synthesize leptin is necessary for regulation of energy homeostasis (Lafontan, 2005). Although hyperleptinemia is linked to leptin resistance, a certain amount of leptin is necessary to avoid ectopic deposition of lipids in non-adipose tissues, lipotoxicity and lipo-apoptosis (Unger, 2003;Somoza et al., 2007; Tschöp et al., 2007).
In summary, our study shows that systemic inhibition of renin by aliskiren induces a reduction of adipose Ang I and Ang II, visceral adiposity and plasma leptin levels. The lack of effect of aliskiren on food intake and caloric efficiency, taken together with its negative effect on body weight and in different adipose pads suggests an effect for this drug on adipose tissue. Although aliskiren has demonstrated to slightly reduce body weight in humans (Jordan et al., 2007), several recent findings support the idea of a benefit of aliskiren on obese and diabetic populations. First, there seems to be dissociation between the amount of adipose tissue and the cardiovascular and metabolic effects of the adipose RAS. Several studies in models of DIO have shown beneficial effects of RAS blockade on blood pressure (Boustany et al., 2004) and insulin resistance (Kurita et al., 2008), without changes in body weight. Moreover, there is compelling evidence that prevention of ectopic lipid deposition and lipotoxicity is a matter of adequate fatty acid metabolism in lean tissues. The normalization or restoration of adipose tissue function, allowing triglycerides to be stored in adipocytes and not in other tissues, is probably a more challenging goal in the treatment of obesity than an overall reduction of adipose tissue or weight. As extensively investigated by Unger (2003), ectopic lipids, rather than excessive adiposity, account for most dysfunctions linked to obesity, that is, pancreatic damage, insulin resistance, steatotic liver and heart, etc. Whether aliskiren has a positive effect on these mechanisms remains to be further investigated.
Acknowledgments
This work was supported by a Novartis Research Grant.
Glossary
Abbreviations:
- ACE
angiotensin-converting enzyme
- Ang I
angiotensin I
- Ang II
angiotensin II
- DIO
diet-induced obesity
- HF
high fat
- LF
low fat
- RAS
renin-angiotensin system
- RIA
radioimmunoassay
Conflict of interest
None.
References
- Araki K, Masaki T, Katsuragi I, Tanaka K, Kakuma T, Yoshimatsu H. Telmisartan prevents obesity and increases the expression of uncoupling protein 1 in diet-induced obese mice. Hypertension. 2006;48:51–57. doi: 10.1161/01.HYP.0000225402.69580.1d. [DOI] [PubMed] [Google Scholar]
- Benson SC, Pershadsingh HA, Ho CI, Chittiboyina A, Desai P, Pravenec M, et al. Identification of telmisartan as a unique angiotensin II receptor antagonist with selective PPARγ-modulating activity. Hypertension. 2004;43:993–1002. doi: 10.1161/01.HYP.0000123072.34629.57. [DOI] [PubMed] [Google Scholar]
- Boustany CM, Bharadwaj K, Daugherty A, Brown DR, Randall DC, Cassis LA. Activation of the systemic and adipose rennin-angiotensin system in rats with diet-induced obesity and hypertension. Am J Physiol. 2004;287:943–949. doi: 10.1152/ajpregu.00265.2004. [DOI] [PubMed] [Google Scholar]
- Cassis LA, Lynch KR, Peach MJ. Localization of angiotensinogen messenger RNA in rat aorta. Circ Res. 1988;62:1259–1262. doi: 10.1161/01.res.62.6.1259. [DOI] [PubMed] [Google Scholar]
- Cassis LA, English VL, Bharadwaj K, Boustany CM. Differential effects of local versus systemic angiotensin II in the regulation of leptin release from adipocytes. Endocrinology. 2004;145:169–174. doi: 10.1210/en.2003-0767. [DOI] [PubMed] [Google Scholar]
- Darimont C, Vassaux G, Ailhaud G, Negrel R. Differentiation of preadipose cells: paracrine role of prostacyclin upon stimulation of adipose cells by angiotensin-II. Endocrinology. 1994;135:2030–2036. doi: 10.1210/endo.135.5.7956925. [DOI] [PubMed] [Google Scholar]
- Derkx FHM, van der Meiracker AH, Fischli W, Admiraal PJJ, Man in't Veld AJ, van Brummelen P, et al. Nonparallell effects of rennin inhibitor treatment on plasma rennin activity and angiotensins I and II in hypertensive subjects. An assay-related artefact. Am J Hypertens. 1991;4:602–609. doi: 10.1093/ajh/4.7.602. [DOI] [PubMed] [Google Scholar]
- Engeli S, Gorzelniak K, Kreutz R, Runkel N, Distler A, Sharma AM. Co-expression of renin-angiotensin system genes in human adipose tissue. J Hypertens. 1999;17:555–560. doi: 10.1097/00004872-199917040-00014. [DOI] [PubMed] [Google Scholar]
- Engeli S, Schling P, Gorzelniak K, Boschman M, Janke J, Ailhaud G, et al. The adipose tissue rennin-angiotensin-aldosterone system: role in the metabolic syndrome? Int J Biochem Cell Biol. 2003;35:807–825. doi: 10.1016/s1357-2725(02)00311-4. [DOI] [PubMed] [Google Scholar]
- Gálvez-Prieto B, Bolbrinker J, Stucchi P, de Las Heras AI, Merino B, Arribas S, et al. Comparative expression analysis of the renin-angiotensin system components between white and brown perivascular adipose tissue. J Endocrinol. 2008;197:55–64. doi: 10.1677/JOE-07-0284. [DOI] [PubMed] [Google Scholar]
- Gorzelniak K, Engeli S, Janke J, Luft FC, Sharma AM. Hormonal regulation of the human adipose-tissue renin-angiotensin system: relationship to obesity and hypertension. J Hypertens. 2002;20:965–973. doi: 10.1097/00004872-200205000-00032. [DOI] [PubMed] [Google Scholar]
- Harp JB, DiGirolamo M. Components of the renin-angiotensin system in adipose tissue: changes with maturation and adipose mass enlargement. J Gerontol A Biol Sci Med Sci. 1995;50:270–276. doi: 10.1093/gerona/50a.5.b270. [DOI] [PubMed] [Google Scholar]
- Janke J, Engeli S, Gorzelniak K, Luft FC, Sharma AM. Mature adipocytes inhibit in vitro differentiation of human preadipocytes via angiotensin type 1 receptors. Diabetes. 2002;51:1699–1707. doi: 10.2337/diabetes.51.6.1699. [DOI] [PubMed] [Google Scholar]
- Jones BH, Standridge MK, Taylor JW, Moustaid N. Angiotensinogen gene expression in adipose tissue: analysis of obese models and hormonal and nutritional control. Am J Physiol. 1997;273:236–242. doi: 10.1152/ajpregu.1997.273.1.R236. [DOI] [PubMed] [Google Scholar]
- Jordan J, Engeli S, Boye SW, Le Breton S, Keefe DL. Direct Renin inhibition with aliskiren in obese patients with arterial hypertension. Hypertension. 2007;49:1047–1055. doi: 10.1161/HYPERTENSIONAHA.106.084301. [DOI] [PubMed] [Google Scholar]
- Kim S, Whelan J, Claycombe K, Reath DB, Moustaid-Moussa N. Angiotensin II increases leptin secretion by 3T3-L1 and human adipocytes via a prostaglandin-independent mechanism. J Nutr. 2002;132:1135–1140. doi: 10.1093/jn/132.6.1135. [DOI] [PubMed] [Google Scholar]
- Kim S, Soltani-Bejnood M, Quignard-Boulange A, Massiera F, Teboul M, Ailhaud G, et al. The adipose Renin-Angiotensin system modulates systemic markers of insulin sensitivity and activates the intrarenal Renin-Angiotensin system. J Biomed Biotechnol. 2006;2006:27012. doi: 10.1155/JBB/2006/27012. [DOI] [PMC free article] [PubMed] [Google Scholar]
- Kouyama R, Suganami T, Nishida J, Tanaka M, Toyoda T, Kiso M, et al. Attenuation of diet-induced weight gain and adiposity through increased energy expenditure in mice lacking angiotensin II type 1a receptor. Endocrinology. 2005;146:3481–3489. doi: 10.1210/en.2005-0003. [DOI] [PubMed] [Google Scholar]
- Kurita S, Takamura T, Ota T, Matsuzawa-Nagata N, Kita Y, Uno M, et al. Olmesartan ameliorates a dietary rat model of non-alcoholic steatohepatitis through its pleiotropic effects. Eur J Pharmacol. 2008;588:316–324. doi: 10.1016/j.ejphar.2008.04.028. [DOI] [PubMed] [Google Scholar]
- Lafontan M. Fat cells: afferent and efferent messages define new approaches to treat obesity. Annu Rev Pharmacol Toxicol. 2005;45:119–146. doi: 10.1146/annurev.pharmtox.45.120403.095843. [DOI] [PubMed] [Google Scholar]
- Massiera F, Bloch-Faure M, Ceiler D, Murakami K, Fukamizu A, Gasc JM, et al. Adipose angiotensinogen is involved in adipose tissue growth and blood pressure regulation. FASEB J. 2001;15:2727–2729. doi: 10.1096/fj.01-0457fje. [DOI] [PubMed] [Google Scholar]
- Paul M, Mehr AP, Kreutz R. Physiology of the renin-angotensin systems. Physiol Rev. 2006;86:747–803. doi: 10.1152/physrev.00036.2005. [DOI] [PubMed] [Google Scholar]
- Phillips MI, Speakman EA, Kimura B. Levels of angiotensin and molecular biology of the tissue renin angiotensin systems. Regul Pept. 1993;43:1–20. doi: 10.1016/0167-0115(93)90403-u. [DOI] [PubMed] [Google Scholar]
- Poulsen K, Jorgenssen J. An easy radioimmunological microassay of rennin activity, concentreation asnd substrate in human and animal plasma and tissues based on angiotensin I trapping by antibody. J Clin Endocrinol Metab. 1974;39:816. doi: 10.1210/jcem-39-5-816. [DOI] [PubMed] [Google Scholar]
- Saint-Marc P, Kozak LP, Ailhaud G, Darimont C, Negrel R. Angiotensin II as a trophic factor of white adipose tissue: stimulation of adipose cell formation. Endocrinology. 2001;142:487–492. doi: 10.1210/endo.142.1.7883. [DOI] [PubMed] [Google Scholar]
- Somoza B, Guzmán R, Cano V, Merino B, Ramos P, Díez-Fernández C, et al. Induction of cardiac uncoupling protein-2 expression and adenosine 5′-monophosphate-activated protein kinase phosphorylation during early states of diet-induced obesity in mice. Endocrinology. 2007;148:924–931. doi: 10.1210/en.2006-0914. [DOI] [PubMed] [Google Scholar]
- Staessen JA, Li Y, Richart T. Oral renin inhibitors. Lancet. 2006;368:1449–1456. doi: 10.1016/S0140-6736(06)69442-7. Erratum in: Lancet. 2006 Dec 16; 368 (9553): 2124. [DOI] [PubMed] [Google Scholar]
- Takahashi N, Li F, Hua K, Deng J, Wang CH, Bowers RR, et al. Increased energy expenditure, dietary fat wasting, and resistance to diet-induced obesity in mice lacking renin. Cell Metab. 2007;6:506–512. doi: 10.1016/j.cmet.2007.10.011. [DOI] [PMC free article] [PubMed] [Google Scholar]
- Tschöp MH, Hui DY, Horvath TL. Diet-induced leptin resistance: the heart of the matter. Endocrinology. 2007;148:921–923. doi: 10.1210/en.2006-1708. [DOI] [PubMed] [Google Scholar]
- Unger RH. Minireview: weapons of lean body mass destruction: the role of ectopic lipids in the metabolic syndrome. Endocrinology. 2003;144:5159–5165. doi: 10.1210/en.2003-0870. [DOI] [PubMed] [Google Scholar]
- Wood JM, Maibaum J, Rahuel J, Grütter MG, Cohen NC, Rasetti V, et al. Structure-based design of aliskiren, a novel orally effective renin inhibitor. Biochem Biophys Res Commun. 2003;308:698–705. doi: 10.1016/s0006-291x(03)01451-7. [DOI] [PubMed] [Google Scholar]
- Yvan-Charvet L, Even P, Bloch-Faure M, Guerre-Millo M, Moustaid-Moussa N, Ferre P, et al. Deletion of the angiotensin type 2 receptor (AT2R) reduces adipose cell size and protects from diet-induced obesity and insulin resistance. Diabetes. 2005;54:991–999. doi: 10.2337/diabetes.54.4.991. [DOI] [PubMed] [Google Scholar]
- Zanchi A, Dulloo AG, Perregaux C, Montani JP, Burnier M. Telmisartan prevents the glitazone-induced weight gain without interfering with its insulin-sensitizing properties. Am J Physiol Endocrinol Metab. 2007;293:E91–E95. doi: 10.1152/ajpendo.00024.2007. [DOI] [PubMed] [Google Scholar]