

Abstract
The increasing prevalence of array-based comparative genomic hybridization in the clinical laboratory necessitates the implementation of quality control measures to attain accurate results with a high level of confidence. Environmental ozone is present in all industrialized cities and has been found to be detrimental to array data even at levels considered acceptable by US Environmental Protection Agency standards. In this study, we characterized the effect of ozone on microarray data on three different labeling platforms that use different fluorescent dyes (Cy3 and Cy5, Alexa Fluor 555 and Alexa Fluor 647, and Alexa Fluor 3 and Alexa Fluor 5) that are commonly used in array-based comparative genomic hybridization. We investigated the effects of ozone on microarray data by washing the array in variable ozone environments. In addition, we observed the effects of prolonged exposure to ozone on the microarray after washing in an ozone-free environment. Our results demonstrate the necessity of minimizing ozone exposure when washing and drying the microarray. We also found that washed microarrays produce the best results when immediately scanned; however, if a low-ozone environment is maintained, there will be little compromise in the data collected.
Array comparative genomic hybridization (array CGH) has been extensively used in the research laboratory for many years but recently has become integrated into the clinical diagnostic environment. This transition has brought new challenges for clinical laboratories, where it is critical to have reliable and reproducible processes. Clinical laboratories must define quality criteria and thresholds for detecting copy number changes1 and demonstrate expertise in array performance and analysis through validation and proficiency testing.2 To ensure quality results, the clinical laboratory needs to strictly control variables that can affect the quality and reproducibility of results. There are many variables that can affect array CGH results including sample quality, technical issues, and environmental elements. One such environmental element is ozone, which, when uncontrolled, will compromise the daily quality of results from sample to sample.
Ozone is a common pollutant found in the lower atmosphere and is the primary component of smog. Ozone is formed when nitric oxides and volatile organic compounds (VOC) react in the presence of sunlight (US Environmental Protection Agency [EPA], http://www.epa.gov/air/ozonepollution, last accessed May 9, 2008). Nitric oxides and volatile organic compounds are emitted by motor vehicle exhaust, industrial emissions, gasoline vapors, chemical solvents, and natural sources. Consequently, ozone levels are higher in urban and industrial areas, especially during the summer months. Ozone has been shown to affect a class of cyanine dyes, predominately cyanine 5 (Cy5) and, to a lesser extent, cyanine 3 (Cy3), which are commonly used in array CGH.3,4 Studies by Fare et al4 and Branham et al3 localized the effect of ozone to the posthybridization washes. They further characterized how difficult it is for laboratories to identify the source of ozone-related problems, especially considering the extremely low levels of ozone (5 to 10 ppb) that cause these problems, the duration of exposure (as little as 10 to 30 seconds), and the seasonal emergence of ozone itself. Because of the popularity of array CGH in research and the increasing use of the technology for clinical diagnostics, manufacturers have developed better fluorescent dyes that are more stable and give higher intensities than the cyanine 3 and 5 pair that have been commonly used. Although ozone has been identified for its damaging effect on cyanine 5, additional studies have not been performed on other new and emerging dyes.
We evaluated the effect of ozone in our high-throughput, clinical diagnostic setting. In addition, we characterized the effect of ozone on three different labeling platforms that use different fluorescent dyes (Cy3 and Cy5, Alexa Fluor 555 and Alexa Fluor 647, and Alexa Fluor 3 and Alexa Fluor 5) and are commonly used in array CGH. Our results show that exposure to ozone during the posthybidization washes has a considerable negative impact on array data. In addition, we show how the three dyes that are commercially available for array CGH are differentially affected by prolonged exposure to high levels of ozone after the posthybridization washes.
Materials and Methods
Microarray Analysis
Array CGH was performed with a bacterial artificial chromosome (BAC) microarray (SignatureChip®, Signature Genomic Laboratories, Spokane, WA) that was developed for the detection of microdeletions, microduplications, aneuploidy, unbalanced translocations, and subtelomeric and pericentromeric copy-number alterations.5 The current version of the SignatureChip, the SignatureChip Whole Genome (SignatureChipWG), contains 4685 BACs representing 1543 loci with each locus represented by a minimum of three overlapping clones. The subtelomeric and pericentromeric regions are represented with a higher density of overlapping BAC clones, targeted to the unique sequences adjacent to these repetitive regions and consisting of contigs of clones located approximately every 0.5 Mb spanning more than 5 Mb. Important developmental pathways are also covered by contigs of BACs to fill in the chromosome arms and to provide higher resolution.6
Microarray analysis was performed as described.6 A dye-reversal strategy was used on two separate microarrays in which 500 ng of both subject and chromosomally normal human control DNAs were labeled. Samples were labeled using three different labeling methods in three separate experiments. The first labeling method used the BioPrime DNA Labeling System (Invitrogen, Carlsbad, CA) with cyanine 3-dCTP (PerkinElmer Life and Analytical Sciences, Waltham, MA) or cyanine 5-dCTP (PerkinElmer Life and Analytical Sciences).7 The second labeling method used the BioPrime Plus array CGH Genomic Labeling System (Invitrogen) with Alexa Fluor 555 and 647 dyes. The third labeling method used the BioPrime Total Genomic Labeling System (Invitrogen), which has Alexa Fluor 3 and 5 dyes. The subject and control DNAs were co-hybridized to one microarray and then oppositely labeled and co-hybridized to a second microarray.8 Spots were analyzed with GenePix Pro 6.0 (Axon Instruments, Union City, CA) and Genoglyphix (Signature Genomic Laboratories). The GenePix data were uploaded to Genoglyphix with which the mean ratio of fluorescence intensities derived from hybridized subject and control DNA at each test spot on the microarray was calculated and normalized by the mean ratios measured from reference spots on the same slide. The mean ratio of the four normalized spots for each clone was obtained, converted to a log2 scale, and plotted based on the genomic coordinates.
Posthybridization Washes and Slide Scanning
The posthybridization washes were performed in one of two Little Dipper Microarray Processors (SciGene, Sunnyvale, CA), which were enclosed with NoZone workspaces (SciGene). One Little Dipper system was maintained with ozone levels of 0 to 5 ppb through the use of a high-efficiency ozone filtration system (SciGene). The second Little Dipper system was maintained with ozone levels at ∼50 ppb through the use of an ozone generator. The ozone levels were monitored using a model 49i Ozone Analyzer (Thermo Electron, Waltham, MA). The slides were removed from the hybridization chambers and placed in a 24-position rack. The rack was placed in 1× phosphate buffer solution for ∼25 minutes for coverslip removal. After the coverslips were removed the slides were taken through the standard Signature Geonomic Laboratories protocol (Table 1) on the Little Dipper system. The slides were dried in the onboard centrifuge and immediately removed from the enclosures and scanned. Images of the hybridized slides were acquired with a GenePix Autoloader 4200AL or 4000B dual-laser scanner (Axon Instruments). The GenePix Autoloader 4200AL scanner was enclosed in a NoZone GP Workspace (SciGene), and ozone levels were maintained at 0 to 5 ppb or 50 ppb. The GenePix 4000B scanner was also enclosed in a NoZone GP Workspace maintained with ozone levels at 0 to 5 ppb.
Table 1.
Little Dipper Protocol
| Bath no. | Contents | Agitation (cpm) | Time (seconds) |
|---|---|---|---|
| 1 | Post-wash | 150 | 240 |
| 2 | 1× PBS | 400 | 180 |
| 3 | 1× PBS | 250 | 300 |
| 4 | 0.2× SSC | 125 | 120 |
| 5 | Millipore H2O | 100 | 60 |
| C | Centrifuge | 0 | 900 |
SSC, standard saline citrate.
Ozone Studies
Posthybridization Wash and Scan Study
A single test subject with a known chromosome abnormality was used to conduct all of the testing for each of the different ozone conditions. The test subject was labeled using the Alexa Fluor 3 and 5 fluorescent dyes. The test subject was further set up in replicate for each condition tested. Table 2 shows the conditions for the washing and scanning of each replicate pair for this test scenario.
Table 2.
Posthybridization Wash and Scan Study Conditions
| Condition | Wash (ppb) | Scan (ppb) |
|---|---|---|
| Low-ozone wash/low-ozone scan | 0–5 | 0–5 |
| Low-ozone wash/high-ozone scan | 0–5 | ∼50 |
| High-ozone wash/low-ozone scan | ∼50 | 0–5 |
| High-ozone wash/high-ozone scan | ∼50 | ∼50 |
Prolonged Exposure Study
Further microarray experiments were conducted to compare the effect of prolonged ozone exposure after the posthybridization washes on the three labeling systems described above. The test subject was labeled in replicate for each labeling system. The posthybridization washes were performed with ozone levels maintained at 0 to 5 ppb. The slides were scanned using the GenePix 4000B scanner with ozone levels maintained at 0 to 5 ppb. The slides were scanned at a fixed PMT setting at 40-minute intervals and also scanned using the GenePix Pro 6.0 autoPMT feature at the initial scan and at 80-minute intervals. Between scans the slides were enclosed in a NoZone GP Workspace, and ozone levels were maintained at 0 to 5 ppb (control) or 50 ppb (Alexa Fluor 3/5, Alexa Fluor 555/647, and Cy3/Cy5).
Results
Posthybridization Wash and Scan Study
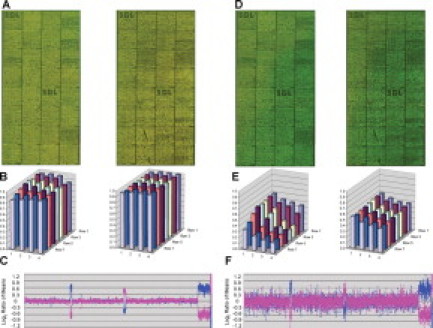
Results from array ozone exposure were generated for the following comparisons: low-ozone wash/low-ozone scan, high-ozone wash/low-ozone scan, low-ozone wash/high-ozone scan, and high-ozone wash/high-ozone scan. Figure 1 shows representative array images from each wash/scan condition, block intensity charts that compare the average ratio of the red and green intensities of all features for a given block, and a chart of the genomic profile for the dye-swap experiment with an opposite gender pairing. The genomic profile includes a quality metric, the SD of the autosome regions, which is used to determine the quality of the experiment.
Figure 1.
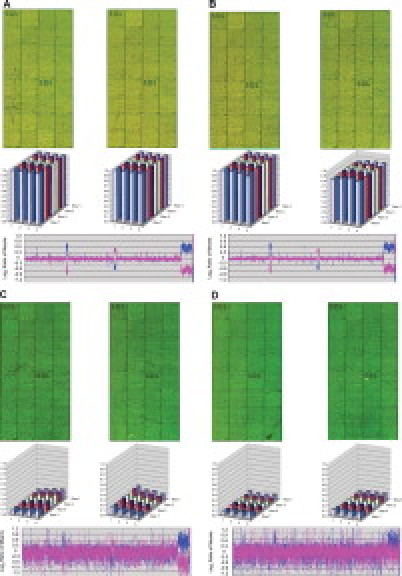
Array images from each wash/scan condition for the Alexa Fluor 3 and 5 dye set, block intensity charts that compare the average ratio of the red and green intensities of all features for a given block, and a plot of the genomic profile for the dye-swap experiment with an opposite gender pairing. For the plot, clones are arranged along the x axis according to physical mapping position, with the most distal p-arm probes to the left and the most distal q-arm probes to the right. A: Results for low-ozone wash/low-ozone scan. B: Results for low-ozone wash/high-ozone scan. C: Results for high-ozone wash/low-ozone scan. D: Results for high-ozone wash/high-ozone scan.
When the low-ozone wash/low-ozone scan are compared with the low-ozone wash/high-ozone scan (Figure 1A and 1B), the abnormal regions are easily identified as is the XY separation. The plots illustrating the ratio of the red channel to the green channel for each block show that the average block intensity, averaged across all arrays for these conditions, ranges from 1.09 to 1.12. The average SDs for both of these conditions are low, with values ranging from 0.040 to 0.048. Both the high-ozone wash/low-ozone scan and high-ozone wash/high-ozone scan (Figure 1C and 1D) illustrate the effect ozone has on array data at the time of the wash. The arrays for these conditions are noticeably greener, and the ratio plots have average intensities of 0.13 and 0.09. The genomic profile plots are noisier with average SD values of 0.27 and 0.31, a direct relation from the noise.
The signal/noise ratios for the red and green channels were averaged for the replicates of each experimental condition (Table 3; Figure 2). The total signal/noise ratio of the green channel showed little change among any of the conditions tested; however, the red channel shows a 10-fold reduction in intensity for conditions where ozone is present in high concentrations during the posthybridization wash.
Table 3.
Average Signal/Noise Ratios for Red (635) and Green (532) Channels for Replicates of Each Experimental Condition
| Experiment 1 |
Experiment 2 |
|||
|---|---|---|---|---|
| SNR 635 | SNR 532 | SNR 635 | SNR 532 | |
| 0 wash, 0 scan | 64.374 | 29.501 | 65.774 | 30.775 |
| 65.643 | 32.254 | 60.969 | 28.19977 | |
| 0 wash, ∼50 scan | 56.269 | 29.657 | 56.864 | 33.214 |
| 59.172 | 34.193 | 54.627 | 33.274 | |
| ∼50 wash, 0 scan | 6.691 | 27.032 | 6.0615 | 29.580 |
| 8.945 | 28.032 | 5.6058 | 24.844 | |
| ∼50 wash, ∼50 scan | 6.052 | 31.168 | 5.950 | 31.015 |
| 6.564 | 30.817 | 6.2187 | 27.207 | |
SNR, signal/noise ratio.
Figure 2.
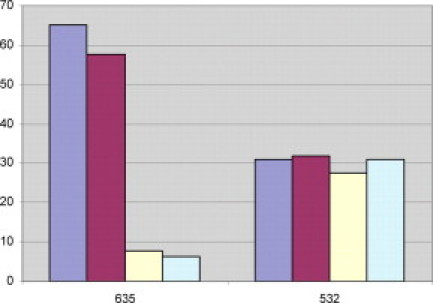
Average signal/noise ratios for red and green channels for replicates of each experimental condition. Blue bars represent the low-ozone wash/low-ozone scan, magenta bars represent the low-ozone wash/high-ozone scan, yellow bars represent the high-ozone wash/low-ozone scan, and green bars represent high-ozone wash/high-ozone scan.
Prolonged Exposure Study
For these experiments three different fluorescent dyes were used to assess the effect ozone has on microarray data over an extended period. Table 4 and Figure 3 show results for microarray experiments comparing the effect of prolonged ozone exposure after the posthybridization washes on different fluorescent dyes. The standard deviations of the array plots are presented for each time point for the three labeling kits as well as the SD of a control experiment kept in a low-ozone environment (0 to 5 ppb). The control is representative of all three labeling kits and demonstrates that repeated scanning of the array has little effect on array data. The signal/noise ratio for both the red and green channels does not deviate between the first and sixth scans, regardless of the fluorescent dye used.
Table 4.
SDs for Microarray Experiments Comparing the Effect of Prolonged Ozone Exposure after the Posthybridization Washes on Different Fluorescent Dyes
| Time (minutes) |
|||||||
|---|---|---|---|---|---|---|---|
| Dye set | Experiment no. | 0 | 40 | 80 | 120 | 160 | 200 |
| No ozone* | 1 | 0.0339 | 0.0352 | 0.0367 | 0.0362 | 0.0357 | 0.0377 |
| 2 | 0.0537 | 0.0528 | 0.0534 | 0.0533 | 0.0532 | 0.0546 | |
| Alexa Fluor 3/5 | 1 | 0.061 | 0.0706 | 0.0824 | 0.0911 | 0.1008 | 0.1103 |
| 2 | 0.0486 | 0.044 | 0.0579 | 0.0719 | 0.0865 | 0.1031 | |
| Cy 3/5 | 1 | 0.038 | 0.0491 | 0.0714 | 0.0867 | 0.0998 | 0.1148 |
| 2 | 0.0337 | 0.0553 | 0.0765 | 0.0892 | 0.1026 | 0.1197 | |
| Alexa Fluor 555/647 | 1 | 0.0367 | 0.0923 | 0.1235 | 0.1395 | 0.1552 | 0.1717 |
| 2 | 0.0495 | 0.0979 | 0.1235 | 0.1382 | 0.1551 | 0.1715 | |
Values in boldface denote SDs of intensity ratios above the threshold of 0.09 established by our laboratory for quality control.
The Alexa Fluor 555/647 dye set was used for the no-ozone control.
Figure 3.
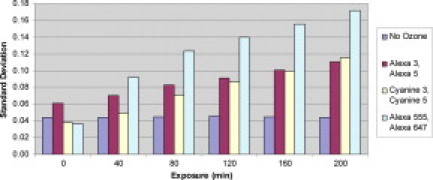
SDs for microarray experiments comparing the effect of prolonged ozone exposure after the posthybridization washes on different fluorescent dyes.
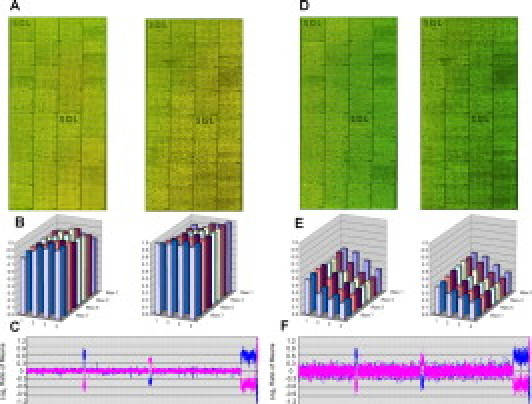
A single representative array image from each test group is displayed for each of the fluorescent dyes tested (Figures 4–6). Block intensity charts are displayed to compare the average intensity of all features for a given block of the ratio of the red and green channels. The genomic profile of the dye-swap experiment with an opposite gender pairing includes the quality metric, the SD of the autosome regions. Each fluorescent dye tested had an initial scan before any ozone exposure, followed by the final scan after 200 minutes of prolonged ozone exposure.
Figure 4.
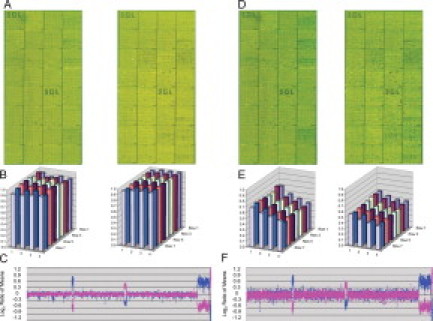
Total intensity of the red channel over the green channel for the Alexa Fluor 3 and 5 dye set at 0 minutes (A–C) and 200 minutes (D–F) of exposure. A and D: Microarray images for two dye-swap experiments. Probes are arranged as in Figure 1. B and E: Block intensity charts comparing the average intensity of all features for a given block of the ratio of the red and green channels. C and F: Plot of microarray results for experiment. Probes are arranged as in Figure 1.
Figure 5.
Total intensity of the red channel over the green channel for the Alexa Fluor 555 and 647 dye set at 0 minutes (A–C) and 200 minutes (D–F) of exposure. A and D: Microarray images for two dye-swap experiments. Probes are arranged as in Figure 1. B and E: Block intensity charts comparing the average intensity of all features for a given block of the ratio of the red and green channels. C and F: Plot of microarray results for experiment. Probes are arranged as in Figure 1.
Figure 6.
Total intensity of the red channel over the green channel for the Cy3 and Cy5 dye set at 0 minutes (A–C) and 200 minutes (D–F) of exposure. A and D: Microarray images for two dye-swap experiments. Probes are arranged as in Figure 1. B and E: Block intensity charts comparing the average intensity of all features for a given block of the ratio of the red and green channels. C and F: Plot of microarray results for experiment. Probes are arranged as in Figure 1.
Discussion
National ozone standards have been established by the EPA to protect public health (ozone is typically reported in parts per million by environmental agencies but we will refer to ozone in parts per billion). The established standard peak ozone level set by the EPA is 80 ppb, which is based on the annual fourth maximum 8-hour average (EPA, http://www.epa.gov/air/ozonepollution, last accessed May 9, 2008). The EPA has also established an air quality index system for monitoring the daily pollution levels. The “good” air quality range is 0 to 60 ppb, and although the air quality in Spokane, WA, is considered good, our laboratory has experienced peak levels of ozone at 90 ppb. We chose to characterize the effect of ozone on array data during the posthybridization wash and scanning period to understand better when ozone has the most potential to adversely affect results.
The fluorescent dyes commonly used in array CGH are sensitive to ozone levels as low as 5 to 10 ppb.3,4 Thus, ozone levels considered normal for environmental standards are well above those ranges demonstrating sensitivity of the dyes. The peak ozone levels that any given laboratory could experience are still high. Based on the EPA standard of 80 ppb and a national average slightly below this value, we decided that 50 ppb was an appropriate test condition for the purposes of this study.
Posthybridization Wash and Scan Study
Our laboratory has defined the SD of intensity ratios as our primary quality criterion for assessing array data. A threshold of 0.09 SD has been set for our own BAC platform, the SignatureChipWG; anything above this value will be repeated in our laboratory. Because the majority of the genome of a normal individual will have normal copy number of 2 for each autosome, the intensity ratios of the patient versus control DNA should be equal. Consequently, the log2 of this ratio should remain close to zero.1 Our initial study investigated the effect of ozone during the posthybridization wash (Figure 1) and then up to 40 minutes of exposure while the arrays were scanned.
The low-ozone wash/low-ozone scan group and the low-ozone wash/high-ozone scan group had average SD values of 0.048 and 0.040, respectively (Figure 1A and 1B). We expected the SD value to increase for the latter condition because it was exposed to ozone during scanning. The block intensity chart compares the average intensity of the ratio of the red to green fluorescent dyes across all features for a given block. Each block should have a value at or near 1 because the majority of these spots represent equal copy numbers between patient and control. Although each experiment used opposite gender pairing, the majority of features in any given block should have an average ratio of 1 (or log2 = 0) because X and Y chromosome-specific features are infrequent and will not have a large effect on the average over all autosomes. The block intensity chart for the low-ozone wash/low-ozone scan shows values at or near 1, whereas the low-ozone wash/high-ozone scan shows values around 0.08 (Figure 1A and 1B). The decrease from 1 to 0.08 can be attributed to a decrease in the red fluorescent dye and little or no change in the green fluorescent dye. The signal/noise ratios (Table 3) of the low-ozone wash/high-ozone scans also show a small deviation in the red channel (635) with a an average value of 56.733 compared with 64.189 of the low-ozone wash/low-ozone scans. Although there is an effect on the block intensity chart and the signal/noise ratio, there is no effect on SD for these conditions. One possible explanation for these results is that a subtle effect of ozone on the data can be overcome by the normalization process.
The high-ozone wash/low-ozone scan group and the high-ozone wash/high-ozone scan group had average SD values of 0.274 and 0.316, respectively (Figure 1C and 1D). The high-ozone exposure during the posthybridization washes increased the average SD value from the benchmark value of 0.048 to 0.274, a value well above our threshold of 0.09 for a failed array result. The high-ozone wash/low-ozone scan produced lower SD values than the high-ozone wash/high-ozone scan group, implying that the effect of ozone is additive. This result indicates that ozone has a very strong effect on array data during the posthybridization washes that may result in complete failure of the assay. Exposure to ozone during scanning immediately after washing has no apparent effect on the low-ozone wash but seems to have an additive effect on the high-ozone wash. It is important to note that the ozone exposure to slides while they were scanning was done with the 4200AL autoloader scanner. This instrument scans each channel independently from the other, resulting in scan times in excess of 10 minutes, which means that for each slide pair there was a 10-minute differential and each replicate slide had an exposure of up to 40 minutes (four slides per test condition). Consequently, we wanted to characterize the effect ozone has on arrays after the posthybridization washes over a 3-hour period to simulate the conditions in a clinical laboratory in which slides might sit in an autoloader for several hours.
We were further able to determine that the green dyes for each labeling kit were apparently not discernibly affected by ozone. The signal/noise ratio for each test condition was plotted for both the red and green channels (Table 3; Figure 2). The red channel shows a small loss of signal/noise ratio when slides washed in low ozone were scanned at high ozone. There is a much greater loss of signal/noise ratio when the slides were washed in a high-ozone environment. However, the signal/noise ratio for the green channel in each of these test conditions remained constant. This result is consistent with the green images produced from scanning slides subjected to greater levels of ozone (Figures 1C and 1D, 4, and 5).
Prolonged Exposure Study
Our second study expanded the previous study to characterize better the problem we experienced in our clinical operations using the 4200AL autoloader scanner in which the initial quality of our array data was good but deteriorated over time. We also wanted to characterize different fluorescent dyes available for array CGH that we have used in our laboratory to determine their individual performance in the 50-ppb ozone environment. The cyanine 3 and 5, the Alexa Fluor 555 and 647, and the Alexa Fluor 3 and 5 labeled slides were scanned immediately after the posthybridization washes for a benchmark reading and then stored at the appropriate ozone level. The slides were scanned at 40-minute intervals for a total time of 200 minutes of ozone exposure.
The SDs for the plots representing each labeling kit are shown (Figure 3). Although only two experiments were performed, the Alexa Fluor 3 and 5 dye set showed the least amount of damage over the 200-minute trial whereas the Alexa Fluor 555 and 647 kit experienced the greatest amount of damage (Table 4). The Cy3/Cy5 dye set performed equivalently with the Alexa Fluor 3 and 5 kit up to 120 minutes of exposure. The control kept in the low-ozone environment showed no increase in SD, confirming that repeated scanning of the array does not affect array data.
In conclusion, The effects of ozone must be addressed when array CGH is performed, particularly in a clinical diagnostic setting. Our results show that exposure to ozone during the posthybidization washes has a considerable negative impact on array data. We also found that washed microarrays produce the best results when immediately scanned; however, if a low-ozone environment is maintained, there will be little compromise in the data. In addition, we show that three commercially available dyes for array CGH are all affected by ozone although the dyes are differentially affected by prolonged exposure to high levels of ozone after the posthybridization washes. The increasing use of array CGH in the clinical laboratory requires the implementation of quality control measures such as ozone reduction and monitoring to ensure high-quality array CGH results.
Footnotes
S.B. and K.S. are employees of Signature Genomic Laboratories. L.S. and B.B. are employees of, own shares in, and sit on the Members' Board of Signature Genomic Laboratories. R.R. and J.S. are employees of SciGene.
References
- 1.Vermeesch JR, Melotte C, Froyen G, Van Vooren S, Dutta B, Maas N, Vermeulen S, Menten B, Speleman F, De Moor B, Van Hummelen P, Marynen P, Fryns JP, Devriendt K. Molecular karyotyping: array CGH quality criteria for constitutional genetic diagnosis. J Histochem Cytochem. 2005;53:413–422. doi: 10.1369/jhc.4A6436.2005. [DOI] [PubMed] [Google Scholar]
- 2.Shaffer LG, Beaudet AL, Brothman AR, Hirsch B, Levy B, Martin CL, Mascarello JT, Rao KW. Microarray analysis for constitutional cytogenetic abnormalities. Genet Med. 2007;9:654–662. doi: 10.1097/gim.0b013e31814ce3d9. [DOI] [PubMed] [Google Scholar]
- 3.Branham WS, Melvin CD, Han T, Desai VG, Moland CL, Scully AT, Fuscoe JC. Elimination of laboratory ozone leads to a dramatic improvement in the reproducibility of microarray gene expression measurements. BMC Biotechnol. 2007;7:8. doi: 10.1186/1472-6750-7-8. [DOI] [PMC free article] [PubMed] [Google Scholar]
- 4.Fare TL, Coffey EM, Dai H, He YD, Kessler DA, Kilian KA, Koch JE, LeProust E, Marton MJ, Meyer MR, Stoughton RB, Tokiwa GY, Wang Y. Effects of atmospheric ozone on microarray data quality. Anal Chem. 2003;75:4672–4675. doi: 10.1021/ac034241b. [DOI] [PubMed] [Google Scholar]
- 5.Bejjani BA, Saleki R, Ballif BC, Rorem EA, Sundin K, Theisen A, Kashork CD, Shaffer LG. Use of targeted array-based CGH for the clinical diagnosis of chromosomal imbalance: is less more? Am J Med Genet A. 2005;134:259–267. doi: 10.1002/ajmg.a.30621. [DOI] [PubMed] [Google Scholar]
- 6.Ballif BC, Theisen A, Coppinger J, Gowans GC, Hersh JH, Madan-Khetarpal S, Schmidt KR, Tervo R, Escobar LF, Friedrich CA, McDonald M, Campbell L, Ming JE, Zackai EH, Bejjani BA, Shaffer LG. Expanding the clinical phenotype of the 3q29 microdeletion syndrome and characterization of the reciprocal microduplication. Mol Cytogenet. 2008;1:8. doi: 10.1186/1755-8166-1-8. [DOI] [PMC free article] [PubMed] [Google Scholar]
- 7.Hodgson G, Hager JH, Volik S, Hariono S, Wernick M, Moore D, Nowak N, Albertson DG, Pinkel D, Collins C, Hanahan D, Gray JW. Genome scanning with array CGH delineates regional alterations in mouse islet carcinomas. Nat Genet. 2001;29:459–464. doi: 10.1038/ng771. [DOI] [PubMed] [Google Scholar]
- 8.Wessendorf S, Fritz B, Wrobel G, Nessling M, Lampel S, Goettel D, Kuepper M, Joos S, Hopman T, Kokocinski F, Dohner H, Bentz M, Schwaenen C, Lichter P. Automated screening for genomic imbalances using matrix-based comparative genomic hybridization. Lab Invest. 2002;82:47–60. doi: 10.1038/labinvest.3780394. [DOI] [PubMed] [Google Scholar]