Abstract
Silica monoliths in affinity microcolumns were tested for the high-throughput analysis of drug-protein interactions. Human serum albumin (HSA) was used as a model protein for this work, while carbamazepine and R-warfarin were used as model analytes. A comparison of HSA silica monoliths of various lengths indicated columns as short as 1 to 3 mm could be used to provide reproducible estimates of retention factors or plate heights. Benefits of using smaller columns for this work included the lower retention times and lower back pressures that could be obtained versus traditional HPLC affinity columns, as well as the smaller amount of protein that is required for column preparation. One disadvantage of decreasing column length was the lower precision that resulted in retention factor and plate height measurements. A comparison was also made between microcolumns containing silica particles versus silica monoliths. It was demonstrated with R-warfarin that supports could be used in HSA microcolumns for the determination of retention factors or plate heights. However, the higher efficiency of the silica monolith made this the preferred support for work at higher flow rates or when a larger number of plates are needed during the rapid analysis of drug-protein interactions.
Keywords: Silica monolith, Affinity chromatography, Human serum albumin, Drug-protein binding
1. Introduction
A monolithic support consists of a continuous bed that has both large through-pores to permit solvent flow and smaller side pores for analyte interactions with the stationary phase. These properties tend to give monoliths better mass transfer properties, higher permeability and lower back pressures than traditional particulate supports for HPLC [1]. Monolithic supports have already been used in many types of liquid chromatography [2–5]. These supports have also recently become of interest for use in affinity chromatography, a method in which the stationary phase is a biological-related ligand; the resulting combination of affinity ligands and monolithic supports is referred to as affinity monolith chromatography (AMC) [6].
Various support materials have been considered for use in AMC, including GMA/EDMA co-polymers [7–17], agarose [18,19] and cryogels [20,21], among others. Silica monoliths are another set of supports that have been explored for use in AMC [22–26]. Silica monoliths are attractive for AMC because they combine the benefits of monolithic supports with the use of a silica-based support, which makes it possible to adapt many of the immobilization schemes already employed in the creation of affinity columns using silica particles [6,26,27]. Previous applications of silica monoliths in AMC have included their use in the chiral separations of drugs using immobilized serum proteins [23,26], the screening of enzyme inhibitors [28], the high-throughput analysis of enzymes and proteins [29], and separations based on immobilized metal-ion affinity chromatography [30].
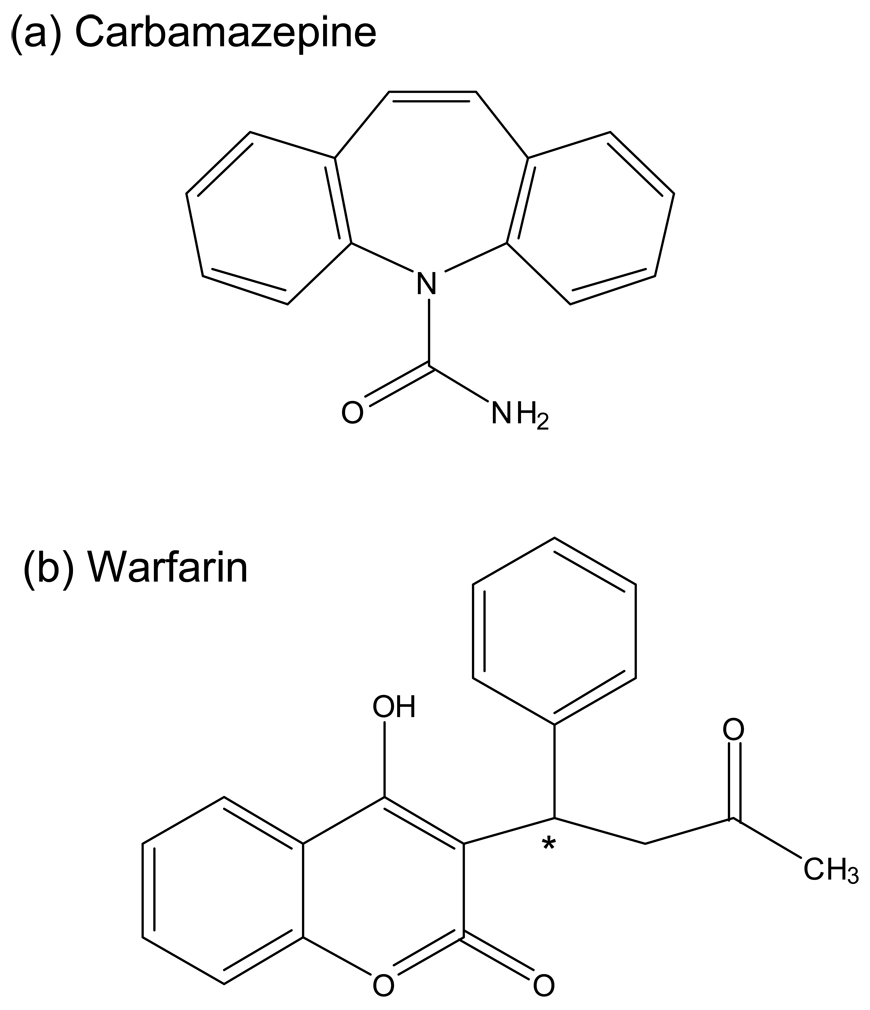
Another possible application of AMC is in the analysis of drug-protein interactions. Human serum albumin (HSA) is the most abundant plasma protein in humans and is known to bind to various drugs and hormones, affecting the transport, distribution, metabolism, and excretion of such substances [31–33]. There are two major binding sites for drugs on HSA, which are referred to as Sudlow sites I and II [31]. Two drugs that have well-known binding properties at these sites are warfarin and carbamazepine (see Figure 1). Warfarin is an anticoagulant drug known to bind to Sudlow site I [31,34], while carbamazepine is an anticonvulsant drug that binds to Sudlow site II [35–37]. The binding of both of these drugs has previously been examined using traditional HPLC affinity columns in which HSA has been immobilized to silica particles [34,36,38–40].
Figure 1.
Structures of (a) carbamazepine and (b) warfarin. The asterisk shows the location of the chiral center in warfarin
HPLC affinity columns have been shown in previous studies to be useful in the analysis of drug-protein interactions, such as those that occur in blood [41,42]. The results obtained when using immobilized HSA in standard HPLC columns give good agreement with data obtained by reference methods using soluble HSA (e.g., equilibrium dialysis and ultrafiltration) [39,41]. Experiments that can be conducted with these columns range from the measurement of percent binding and binding affinity to kinetic studies and drug-drug competition studies [39,40]. The advantages of using HPLC affinity columns for this work include the ability to reuse the same protein preparation for many experiments, the good precision and accuracy of this approach, and the relative speed at which binding studies can be conducted [41,42].
This study will examine the creation and use of affinity microcolumns containing silica monoliths for use in the analysis of drug-protein interactions. HSA will be used as the model protein and R-warfarin or carbamazepine will be the drugs employed in this study. Retention factors and plate heights will be measured for these systems, representing the main parameters used in zonal elution studies to examine drug-protein binding on traditional HPLC affinity columns [39–41,43]. A comparison will also be made between affinity microcolumns containing silica monoliths and those with silica particles. This information will be used to determine the feasibility of using affinity microcolumns and silica monoliths for the high-throughput analysis of drug-protein interactions and to identify chromatographic conditions that are suitable for such work.
2. Experimental
2.1 Reagents
Human serum albumin (Cohn fraction V, essentially fatty acid free, ≥96% pure), carbamazepine (≥ 98% pure), and R-warfarin (≥ 97% pure) were from Sigma (St. Louis, MO, USA). Nucleosil Si-300 silica (300 Å pore size, 7 µm particle size) was from Macherey Nagel (Düren, Germany). Reagents for the bicinchoninic acid (BCA) protein assay were from Pierce (Rockford, IL, USA). All buffers and aqueous solutions were prepared using water from a Nanopure system (Barnstead, Dubuque, IA, USA) and filtered using Osmonics 0.22 µm nylon filters from Fisher (Pittsburgh, PA, USA).
2.2 Apparatus
The Chromolith Performance Si column (4.6 mm i.d. × 10 cm) was donated by Merck KGaA (Darmstadt, Germany). From this column, 1 mm, 3 mm, and 5 mm long pieces were cut to make shorter silica monolith columns by using a lathe. Reagents to activate the silica monolith and immobilize HSA were applied using a Beckman System Gold 118 Solvent Module pump (Fullerton, CA, USA). The silica particle-based columns (3 mm × 2.1 mm i.d.) were packed using an Alltech slurry packer (Deerfield, IL, USA).
The chromatographic system consisted of an isocratic HPLC PU-2080 Plus pump and a UV-2075 Plus detector from Jasco (Easton, MD, USA). Injection was carried out by using a six-port Rheodyne Lab Pro valve (Cotati, CA, USA) and a 5 µL sample loop. An Alltech water jacket and a circulating water bath from Fisher were used to control the temperature in the chromatographic columns. Chromatographic data were collected and processed using in-house programs written in LabView 5.1 (National Instruments, Austin, TX, USA).
2.3 Preparation of HSA silica monoliths
Each silica monolith was first converted into a diol-bonded form, as described previously [23]. To do this, a 1–5 mm long section of the original silica monolith was cut and assembled into a column housing made of delrin. Each of these silica monoliths was first washed with 0.10 M, pH 5.5 sodium acetate buffer for 40 min at 0.5 mL/min (note: unless otherwise indicated, the following steps were conducted at room temperature). Pure 3-glycidoxypropyltrimethoxysilane was passed through the monolith for 50 min at 0.2 mL/min, as used previously for longer silica monoliths in Ref. [23]. After sealing both ends, the monolith column was placed in a water bath at 97 °C for 5 h. A solution of 0.10 M, pH 5.5 sodium acetate buffer was used to wash the column for 50 min at 0.1 mL/min and pure 3-glycidoxypropyltrimethoxysilane was again passed through the column for 50 min at 0.1 mL/min to ensure maximum diol coverage. The column ends were sealed and the column was placed in a water bath at 97 °C for 5 h. The column was removed from the water bath and washed with water for 4 h at 0.2 mL/min. A pH 3.0 solution of dilute sulfuric acid in water was passed through the column for 50 min at 0.2 mL/min. The column was then again sealed at both ends and placed in a water bath at 70 °C for 3 h. All of the resulting diol silica monolith columns were washed with water at 0.2 mL/min for over 5 h. Some of these columns were used for HSA immobilization while others were used as control columns in further studies.
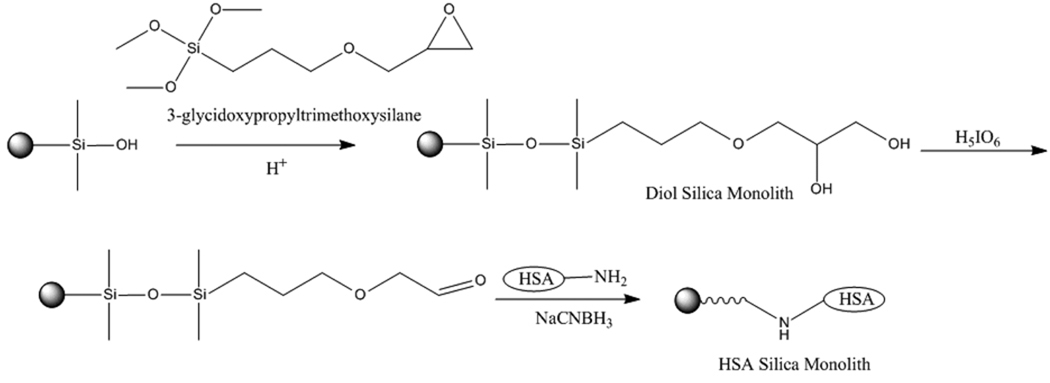
HSA was immobilized onto the diol silica monolith by using the Schiff base method (see Figure 2) [23]. In this method, a 90% (v/v) acetic acid solution in water was passed through each column for 4 h at 0.2 mL/min. A solution of 0.5 g/mL periodic acid in 90% acetic acid in water was then passed through the column in the dark for 7 h at 0.2 mL/min to oxidize the diol groups and form aldehyde groups. The column was washed with water for 8 h at 0.2 mL/min. A 10 mL solution containing 50 mg HSA and 25 mg sodium cyanoborohydride (a mild reducing agent) in 1.5 M, pH 6.0 potassium phosphate buffer was circulated through each column for 24 h at 0.5 mL/min. Separate HSA solutions were used in this step and the next for each column. The sodium cyanoborohydride was used to reduce the reversible Schiff bases formed between amine groups on HSA and aldehyde groups on the support, resulting in stable secondary amine linkages (note: because it is a mild reducing agent, the sodium cyanoborohydride did not reduce the original aldehydes prior to their reaction with amines). A second fresh 12 mL solution of 60 mg HSA and 30 mg sodium cyanoborohydride in the same pH 6.0 buffer was circulated through the column for 65 h at 0.5 mL/min. A 5 mL solution of 0.10 M, pH 8.0 potassium phosphate buffer containing 1 mg/mL sodium borohydride (a strong reducing agent) was applied to each column for 1.5 h at 0.05 mL/min using a syringe pump (Harvard Apparatus, Holliston, MA, USA), with this solution being used to reduce any remaining aldehydes on the support. The monolith columns were then washed with 0.10 M, pH 8.0 potassium phosphate buffer containing 0.5 M sodium chloride, which was passed through each column for 50 min at 0.2 mL/min, followed by an additional washing with 0.067 M, pH 7.4 potassium phosphate buffer for 1.5 h at 0.5 mL/min. The resulting HSA silica monoliths were stored in this last buffer at 4 °C until use. These columns were used within a period of 3 months. Similar but longer silica monoliths have been found to be stable for at least 4 months under the storage and experimental conditions used in this study [23].
Figure 2.
Preparation of a HSA silica monolith by the Schiff base method.
The protein content in the HSA silica monoliths was estimated as described in Ref. [23] by measuring the retention factor for 5 µL injections of 30 µM carbamazepine in the presence of in pH 7.4, 0.067 M potassium phosphate. Similar injections were made onto the control columns to correct for any nonspecific binding of carbamazepine to the support. It was found that nonspecific binding typically made up 21–33% of the total retention seen on the HSA silica monoliths. The estimated protein coverage of these supports was 1.8 (± 0.1) µmol HSA/g support [23]. This result corresponded to a protein content in each column of 0.36 (± 0.02) µmol HSA/mL.
2.4 Preparation of HSA silica particles
To prepare the particle-based supports, Nucleosil Si-300, 7 µm particle size silica was converted into a diol-bonded form, as described previously [44]. A particle size of 7 µm was chosen for this work because it has been commonly used in the past to prepare immobilized HSA for use in HPLC affinity columns for drug-protein binding studies [34,36,38–40]. HSA was immobilized onto part of this diol silica by using the Schiff base method [45], with the remainder of the diol silica being used to prepare a control support in which no HSA was added to the silica. In the Schiff base method, 0.5 g of diol silica was combined with 0.5 g periodic acid in 10 mL of a 90% (v/v) solution of acetic acid in water, with this mixture then being allowed to react for 2 h with shaking. The resulting aldehyde-activated silica was then washed six times with water and three times with 0.10 M, pH 6.0 potassium phosphate buffer.
The aldehyde-activated silica from previous last step was combined with a 5 mL solution of 0.10 M, pH 6.0 potassium phosphate buffer containing 50 mg HSA and 25 mg sodium cyanoborohydride. This mixture was allowed to shake on a rotary mixer at 4 °C for 6 days. The HSA silica that this reaction produced was washed four times with 0.10 M, pH 8.0 potassium phosphate buffer and slowly combined with three portions of 12 mg sodium borohydride, which were added over the course of 90 min while the mixture was allowed to react at room temperature. This slurry was washed three times with 0.10 M, pH 8.0 potassium phosphate buffer that contained 0.5 M sodium chloride, followed by two additional washing with 0.067 M, pH 7.4 potassium phosphate buffer. The final HSA silica and corresponding control support were stored in 0.067 M, pH 7.4 potassium phosphate buffer at 4 °C until use.
Small portions of the HSA silica and control support were washed several more times with water and dried under vacuum at room temperature. These dried samples were analyzed in triplicate using a BCA protein assay [46], with HSA being employed as the standard and the control support being used as the blank. The final protein content of the HSA silica was found to be 0.76 (± 0.05) µmol HSA/g support, which corresponded to a protein content of 0.34 (± 0.02) µmol HSA/mL. The remaining portions of the original HSA silica and control support were downward slurry packed at 4000 psi (28 MPa) for 40 min into stainless steel columns using 0.067 M, pH 7.4 potassium phosphate buffer as the packing solution. These columns were stored in pH 7.4, 0.067 M potassium phosphate buffer at 4 °C until use. These columns were used within a period of 3 months and are typically stable for up to one year under the storage and experimental conditions used in this study [47].
2.5 Chromatographic studies
The mobile phase used throughout these studies was pH 7.4, 0.067 M potassium phosphate buffer. The column temperature was maintained at 37.0 (± 0.1) °C during all experiments. A 5 µL injection volume was used for all samples, with each sample being injected in triplicate under all of the tested chromatographic conditions. All samples were prepared in 0.067 M, pH 7.4 potassium phosphate buffer and stored at 4 °C when not in use. Solutions of R-warfarin were stored at 4 °C for up to one week, and solutions of carbamazepine were stored at 4 °C for several weeks; both of these analytes have been shown previously to be stable under such conditions [36,38]. All mobile phases for were degassed for 25 min prior to use. The following detection wavelengths were used: 308 nm for R-warfarin and 255 nm for carbamazepine. The void time of the system was determined by injecting a 25 µM sample of sodium nitrate that was prepared in the mobile phase. The elution of sodium nitrate was monitored at 205 nm.
A 30 µM carbamazepine sample was chosen for this work because no significant change was noted in the measured retention of this analyte when over two-fold higher or lower concentrations were used, thus indicating that linear elution conditions were present for this sample. A 20 µM R-warfarin sample was utilized for similar reasons. The central moment and second moment (i.e., moment 2, or the variance) were found for each peak by using Peakfit 4.12 (Systat Software, San Jose, CA, USA) along with the linear progressive baseline, Savitsky-Golay smoothing, and EMG peak fit settings of this software. The central moment was used to determine retention factor, and the second moment was used to measure band-broadening and to calculate plate heights. The void time of the system, as required for retention factor measurements, was determined by injecting 25 µM sodium nitrate. Similar injections were made with no column present in the system to correct for the extra-column void time of the system and extra-column band-broadening.
3. Results and discussion
3.1 Retention of carbamazepine on HSA microcolumns using silica monoliths
Zonal elution measurements of drug retention are often made on HPLC affinity columns to estimate the percent binding of a drug to an immobilized protein such as HSA [41]. This approach is also used to examine the effect of a competing drug or solute on the binding by a site selective probe to the column [34,41,47] and to examine the effect of temperature or mobile phase composition on drug-protein interactions [39,41]. The use of zonal elution conditions in these experiments is applicable to the study of solute-ligand systems with weak-to-moderate strength interactions (i.e., as association equilibrium constant of 106 M−1 or lower) and relatively fast association/dissociation kinetics; these conditions make this approach an example of “weak affinity chromatography” (see Refs. [39–41,43] for more details). Carbamazepine is one drug that has been used in a probe for Sudlow site II in binding studies conducted on HSA columns [36]. Carbamazepine has an association equilibrium constant of be 5.3 × 10³ M−1 at pH 7.4 and 37 °C with HSA [36]. This binding strength is typical of that seen for many drugs with this protein [31,42], making carbamazepine a good general model for the work that was conducted in this study. This drug was used to see how varying both column size and flow rate would affect binding studies that might be made on affinity microcolumns.
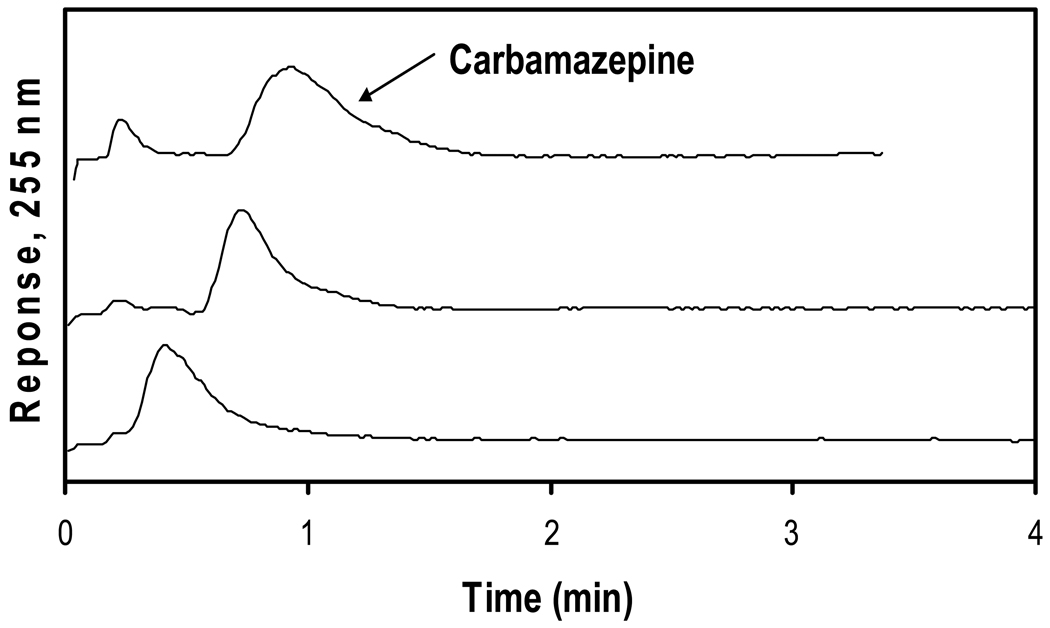
Figure 3 shows chromatograms that were obtained at 0.5 mL/min for injections of carbamazepine on 4.6 mm i.d. HSA microcolumns of various lengths made from silica monoliths. The retention times noted for carbamazepine were 33, 49, and 64 s on the 1 mm, 3 mm and 5 mm long microcolumns, respectively. These retention times are significantly shorter than the retention time of 10.6 min that would be expected for carbamazepine at 0.5 mL/min on a 10 cm × 4.6 mm i.d. HPLC silica monolith containing HSA, based on data given in Ref. [23].
Figure 3.
Chromatograms obtained for injections of 30 µM carbamazepine at 0.5 mL/min onto 4.6 mm i.d. HSA silica monoliths with lengths (from bottom-to-top) of 1, 3, or 5 mm. The experimental conditions are given in the text.
The back pressures measured for the 3 mm long HSA affinity microcolumn made from a silica monolith ranged from 256 psi (1.8 MPa) at 0.5 mL/min to 825 psi (5.7 MPa) at 4.0 mL/min, with almost two-fold lower back pressures being recorded on the 1 mm long microcolumn. In comparison, a 4.6 mm i.d. × 5 cm HSA column based on silica particles has been reported to give a back pressure of 995 psi (6.9 MPa) at 3.0 mL/min [23]. The relatively low back pressures of the silica monoliths and higher flow rates that could be employed with these columns made it possible to further reduce the time needed for the elution of drugs from these columns. In this case, a flow rate of 4.0 mL/min gave retention times of 5.6–8.3 s for carbamazepine on the 1 mm to 5 mm long affinity microcolumns. These values are 50-fold lower than the typical retention time that would be expected for this drug at 0.5 mL/min on a 10 cm × 4.6 mm i.d. HSA column containing a silica monolith [23].
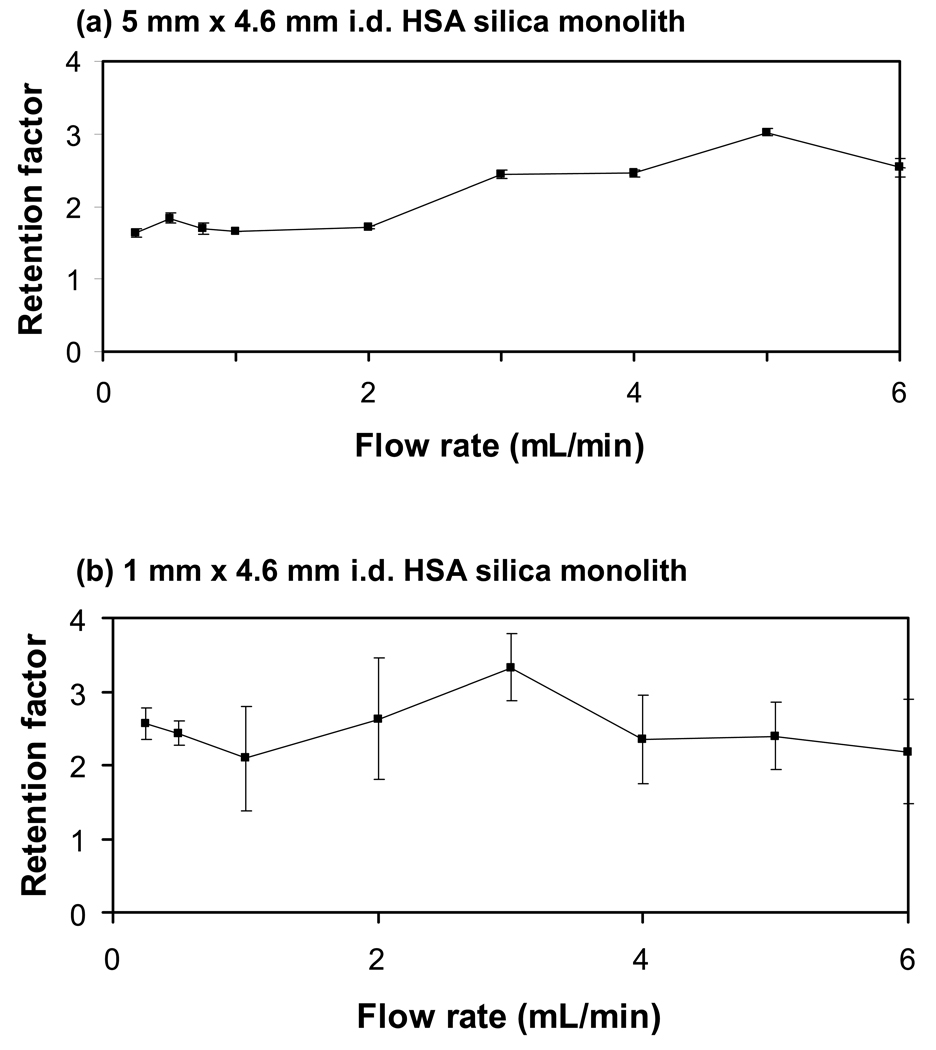
Figure 4 shows how the retention factor for carbamazepine changed with flow rate on the 1 and 5 mm × 4.6 mm i.d. HSA microcolumns containing a silica monolith. Similar results were obtained on the 3 mm × 4.6 mm i.d. HSA microcolumn. It is desirable in zonal studies of drug-protein binding to have a retention factor that does not vary significantly with flow rate. Under these conditions, the mean position of the peak is typically assumed to represent a local equilibrium between the drug and the immobilized protein. This assumption makes it possible to estimate the extent of drug-protein binding or to study the equilibrium processes involved in this binding by using the measured retention factor. It was found in this report that similar retention factors were obtained for carbamazepine even when going from the 5 mm × 4.6 mm i.d. HSA microcolumn to the 1 mm × 4.6 mm i.d. HSA microcolumn. For instance, the average retention factors measured at flow rates of 0.25–2.0 mL/min on the 5 mm versus 1 mm long columns were 1.7 (± 0.1) and 2.4 (± 0.2), respectively, while the average retention factors determined at 0.25–6.0 mL/min were 2.1 (± 0.5) and 2.5 (± 0.4). Comparable results were seen with the 3 mm long microcolumn. Small batch-to-batch differences in protein coverage did lead to some corresponding column-to-column variations in the retention factors, such as those at lower flow rates for the 1 mm and 5 mm column results. However, the results in Figure 4 do clearly indicate that microcolumns in this size range could be used in retention factor measurement for drug-protein binding studies.
Figure 4.
Retention factors measured at various flow rates for injections of 30 µM carbamazepine onto 4.6 mm i.d. HSA silica monoliths with lengths of (a) 5 mm or (b) 1 mm. The experimental conditions are given in the text. The error bars represent a range of ± 1 S.D.
The use of smaller microcolumns has the obvious advantage of allowing faster analysis times by providing shorter column residence times and lower column back pressures. One disadvantage noted in Figure 4 in the use of very short microcolumns for drug-binding studies is there is a loss in precision during retention factor measurements as the column length is decreased. The 5 mm long HSA microcolumns gave a precision in these measurements between 0.25 and 6.0 mL/min that ranged from ± 0.5% to ± 4% (average, ± 2.6%), while the precision for the 3 mm column under the same conditions was ± 3% to ± 16% (average, ± 8%). In comparison, the 1 mm column at these same flow rates had a precision of ± 7% to ± 33% (average, ± 21%) for the measured retention factors of carbamazepine. This decrease in precision was related to the faster elution times of carbamazepine from the shorter microcolumns, which lowered the degree of certainty associated with the central moments determined for the corresponding peaks.
Besides providing shorter analysis times, affinity microcolumns also require a smaller amount of immobilized protein or ligand than traditional HPLC affinity columns. For instance, the protein content of a 3.5 cm × 2.1 mm i.d. HSA silica particle-based affinity column (i.e., one of the smaller columns used in previous studies) has been reported to be 36 nmol HSA [47]. The 1 and 3 mm × 4.6 mm i.d. affinity microcolumns used in this current report contained approximately 1.2 to 3.5 nmol HSA, or 10–30 fold less protein than the column in Ref. [47]. These microcolumns also contained roughly 33–100 fold less protein than a 10 cm × 4.6 mm i.d. HPLC silica monolith that was used in a previous study for the immobilization of HSA [23].
One possible disadvantage of having lower protein content in an affinity column is that smaller amounts of sample must be injected to avoid column overloading and concentration-dependent changes in retention (i.e., non-linear elution effects). It was found in this report that samples containing up to 80 µM carbamazepine gave less than a 1.9–5.1% change in the measured retention factor. This result indicated that such non-linear effects were not a significant problem at the typical concentration of 30 µM carbamazepine that was used throughout this study for all of the affinity microcolumns (note: similar results were obtained for R-warfarin later in this report).
3.2 Band-broadening of carbamazepine on HSA microcolumns using silica monoliths
The band-broadening and width of peaks obtained in zonal elution studies with affinity columns are also of interest because this information can be used to learn about the kinetics of drug-protein binding [41,42]. This technique again works well for solute-ligand systems with weak-to-moderate strength interactions and relatively fast association/dissociation kinetics, such as those that occur between many drugs and small solutes with HSA [41,43]. This type of experiment requires the ability to measure plate heights over a wide range of flow rates. The next series of studies in this report examined the possible use of affinity microcolumns and silica monoliths for such work.
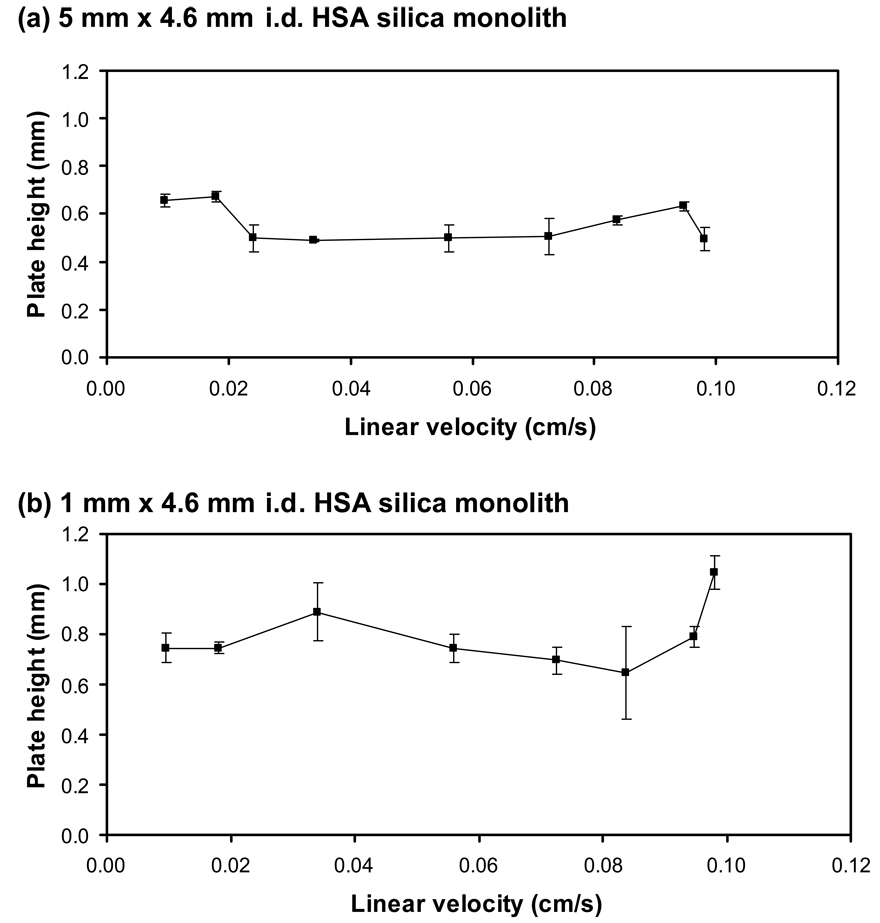
Figure 5 shows some typical plate height plots that were generated using the 1 mm and 5 mm long HSA microcolumns. Comparable plots were obtained for the 3 mm long column. The plate heights measured for these columns were all between 0.5 and 0.8 mm at 37 °C and showed no appreciable change over the linear velocities that were examined in this report. These values are comparable to plate heights of 0.4–0.7 mm that have been reported at 25 °C on a 10 cm × 4.6 mm i.d. HSA silica monolith using L-tryptophan as the analyte (i.e., a solute that binds to Sudlow site II with a similar strength to that of carbamazepine) [23]. The little or no change seen in the plate height over the linear velocities that were tested in this report indicates that these conditions were obtained over the region in which contributions from stationary phase mass transfer and stagnant mobile phase mass transfer dominate the plot in Figure 5.
Figure 5.
Plate height plots obtained for injections of 30 µM carbamazepine onto 4.6 mm i.d. HSA silica monoliths with lengths of (a) 5 mm or (b) 1 mm. The experimental conditions are given in the text. The error bars represent a range of ± 1 S.D.
The corresponding number of theoretical plates for carbamazepine on the HSA microcolumns was approximately 1–2, 3–6 or 8–9 for the 1 mm, 3 mm and 5 mm long columns, respectively. Given the small number of theoretical plates that were present on the 1 mm long column, it was somewhat surprising to see that the measured plate heights for this column gave such good agreement with the values for the longer 3 mm and 5 mm HSA columns in this report, as well as with data for a 10 cm HSA silica monolith that has been used in previous studies [23]. This may reflect the presence of relatively fast association and dissociation kinetics for carbamazepine with immobilized HSA, as has been previously observed for L-tryptophan [48].
One disadvantage of using affinity microcolumns to determine plate heights is there was a clear decrease in the precision of these measurements as the column length was decreased, especially when going from the 5 mm column to the 1 mm long column. For the 5 mm long column, the precision of the plate heights in Figure 5 ranged from ± 1.2% to ± 15%, with an average precision of ± 7%. The 3 mm long column gave similar precision values, which ranged from ± 1.4% to ± 9%, with an average precision of ± 5%. In comparison to these results, the 1 mm long column gave precision that varied between ± 3% to ± 29%, with an average precision of ± 10%. Although high precision plate height measurements may require longer columns [41–43], these data do suggest that affinity microcolumns can be used to provide good estimates of plate heights for at least the preliminary screening of drug-protein interaction kinetics while also minimizing the amount of time required for such studies.
3.3 Retention of warfarin on HSA microcolumns using silica monoliths
Warfarin is frequently used in zonal elution studies as a probe for Sudlow site I in drug competition studies on HSA columns [34,47]. The binding of warfarin with HSA columns has been previously characterized in terms of both the equilibrium constant [39] and rate constants [40] for this interaction. One challenge in working with warfarin is its strong binding for HSA. For instance, the association equilibrium constant of an HSA column for R-warfarin was been found to be 2.1 × 10⁵ M−1 at pH 7.4 and 37 °C, with S-warfarin having slightly stronger binding under these conditions [38,40] Many previous studies using HSA in HPLC columns have employed columns with lengths of 4–10 cm, which give relatively long retention times for warfarin (e.g., 25–150 min) due to the strong binding of this drug to these columns [23,34,38,47]. The use of an affinity microcolumn is particularly attractive for this drug because it could significantly reduce the time required in experiments that use either R- or S-warfarin as site selective probes for HSA when examining the binding of new drug candidates to this protein [34].
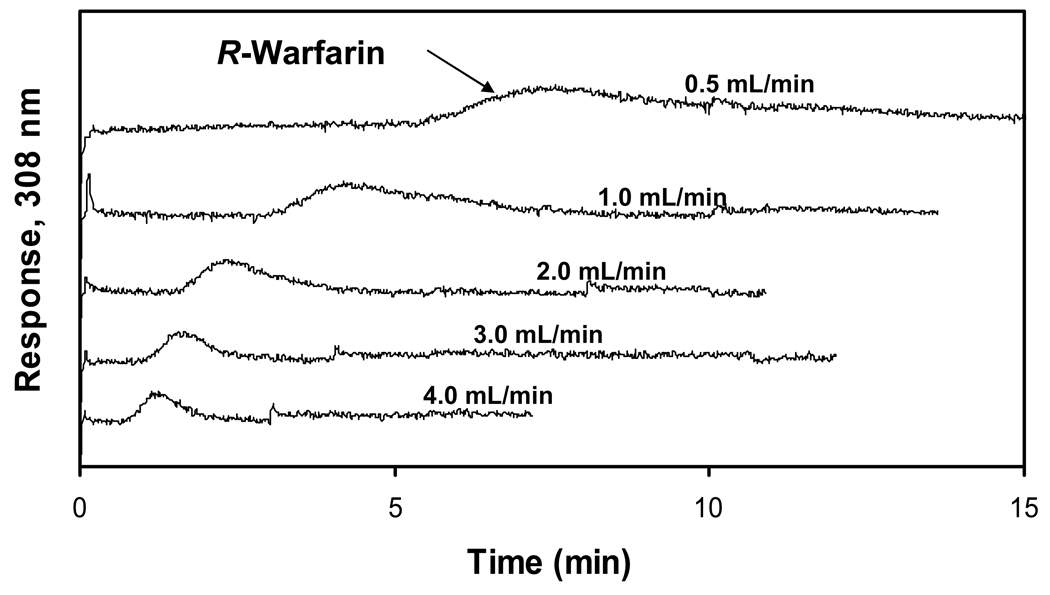
Some typical chromatograms are shown in Figure 6 for injections of R-warfarin onto a 3 mm × 4.6 mm i.d. HSA microcolumn containing a silica monolith. The retention times noted for R-warfarin on this microcolumn were 5.4 min at 1.0 mL/min and 9.5 min at 0.5 mL/min. These retention times are shorter than the 150–160 min retention time that was observed earlier for R-warfarin at 1.0 mL/min on a 10 cm × 4.6 mm i.d. HPLC silica monolith containing HSA [23]. These retention times are also lower than values of 12–15 min or 20–25 min, respectively, that have been obtained at 0.5 mL/min for 5 cm × 4.1 mm i.d. or 10 cm × 2.1 mm i.d. HSA columns using silica particles [38,49]. Similar results would be expected for S-warfarin, which typically has a retention factor that is slightly higher than for R-warfarin under the mobile phase and temperature conditions used in this study [39]. Racemic warfarin was not used in this current report because it was expected from previous results with larger HSA columns that the affinity microcolumns would not have sufficient resolution to separate R- and S-warfarin, thus complicating the determination of retention and band-broadening for such analytes if a racemic mixture was used as the sample [23,39].
Figure 6.
Chromatograms obtained at various flow rates for injections of 20 µM R-warfarin on a 3 mm × 4.6 mm i.d. HSA silica monolith column. The experimental conditions are given in the text.
The relatively low back pressures and high flow rates that could be used with silica monoliths made it possible to further reduce the time needed for the elution of R-warfarin. In this case, a flow rate of 4.0 mL/min on the affinity microcolumn gave a retention time of 1.37 min for R-warfarin, which was at least ten-fold lower than the typical retention times noted at 0.5 mL/min on 4.1 mm i.d. × 4.5 cm HSA columns containing silica particles [49] and over 100-fold lower than the retention time seen at 1.0 mL/min on a 10 cm × 4.6 mm i.d. HPLC silica monolith containing HSA [23].
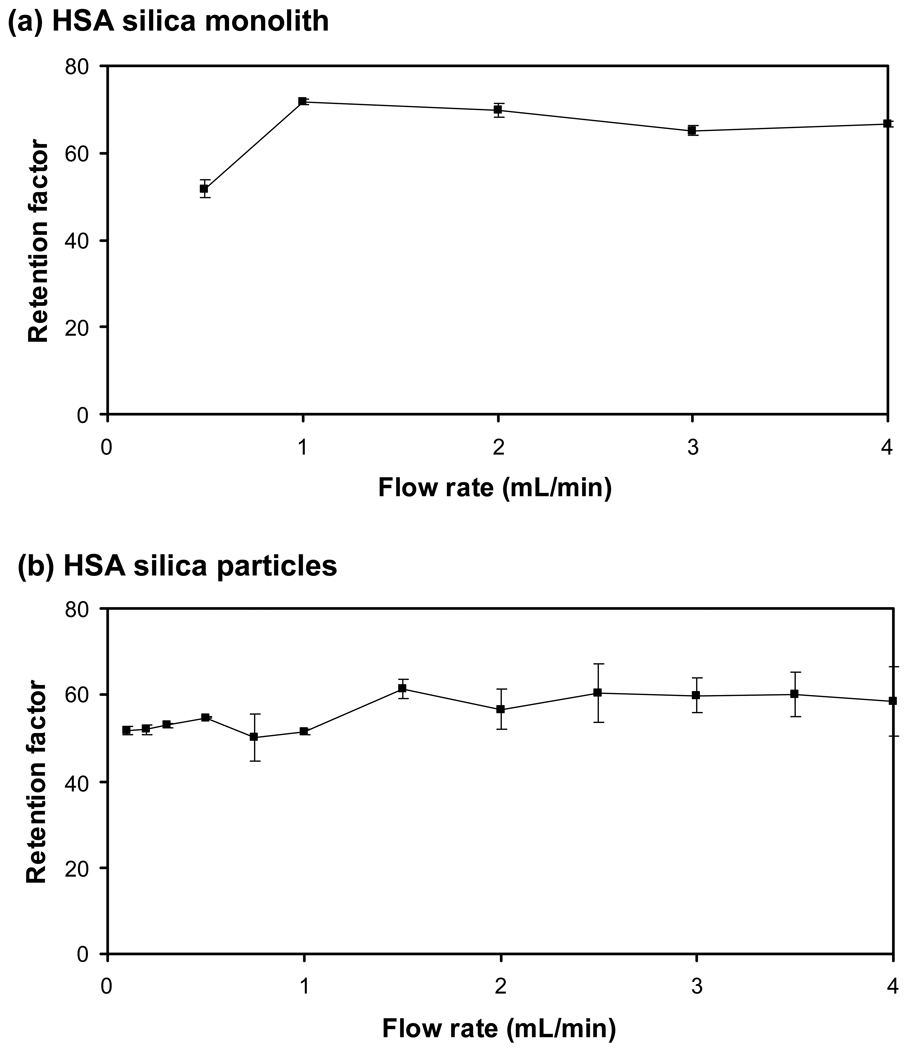
Figure 7a shows how the retention factor for R-warfarin changed with flow rate on the 3 mm × 4.6 mm i.d. HSA microcolumn containing a silica monolith. This retention factor had an average value of 65 (± 7) in going from 0.5 mL/min to 4.0 mL/min, with a variation of only 7% being noted at flow rates ranging from 1 mL/min to 4 mL/min. The precision of retention factors measured at the individual flow rates in this range varied from ± 0.9% to ± 4.0%, with an average of ± 2%. These results again indicated that an affinity microcolumn of this size and containing a silica monolith could be used to provide reproducible retention factors for drug-protein binding studies. It is interesting to note that the precision seen for the retention factors of R-warfarin on the 3 mm × 4.6 mm i.d. HSA microcolumn were much better than those obtained earlier for carbamazepine on the same column. This difference occurred because of the much higher retention of R-warfarin versus carbamazepine, which made it easier to measure the retention factor for the former analyte. The same general trend would be expected on other affinity microcolumns when comparing drugs that have strong binding to an immobilized protein versus those with weak-to-moderate binding.
Figure 7.
Retention factors obtained at various flow rates for injections of 20 µM R-warfarin obtained on (a) a 3 mm × 4.6 mm i.d. HSA silica monolith column and (b) a 3 mm × 2.1 mm HSA column containing silica particles. The experimental conditions are given in the text. The error bars represent a range of ± 1 S.D.
3.4 Band-broadening of warfarin on HSA microcolumns made with silica monoliths
The band-broadening of warfarin on the HSA microcolumns was next examined. This topic was of interest because measurements of band-broadening have been previously employed to examine the kinetics of R-warfarin association and dissociation on traditional HPLC affinity columns containing HSA [40].
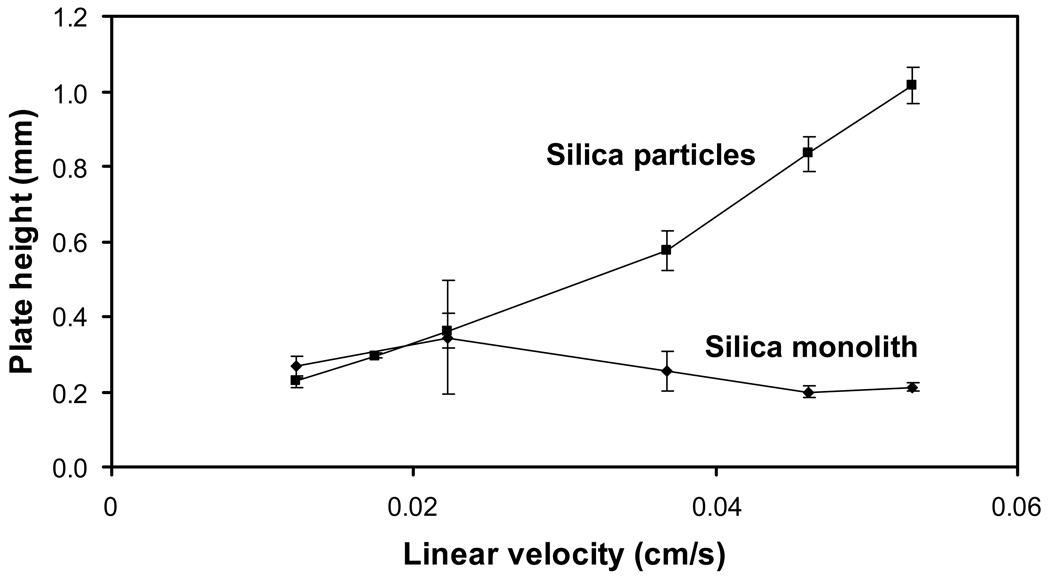
Figure 8 shows a plate height plot obtained on the 3 mm × 4.6 mm i.d. HSA microcolumn containing a silica monolith. This plate height plot was fairly flat, with a variation of only ± 12% being seen in the measured plate heights between linear velocities of 0.01 and 0.05 cm/s (i.e., flow rates of 0.5 to 4.0 mL/min). Similar plate height plots have been observed at linear velocities spanning from roughly 0.12 to 0.35 cm/s for the injection of racemic warfarin on a 10 cm × 4.6 mm i.d. HPLC silica monolith containing HSA [23]. The small change noted in the plate height with linear velocity in Figure 8 indicates that these conditions were obtained over the region in which contributions from stationary phase mass transfer and stagnant mobile phase mass transfer dominate.
Figure 8.
Plate height plots obtained for injections of 20 µM R-warfarin on a 3 mm × 4.6 mm i.d. HSA silica monolith or a 3 mm × 2.1 mm i.d. HSA column containing silica particles. The experimental conditions are given in the text. The error bars represent a range of ± 1 S.D.
The plate heights measured here, which were around 0.2 mm at 37 °C, were slightly higher than values of 0.04–0.06 mm that have been reported at 25 °C for R-warfarin on the 10 cm × 4.6 mm i.d. HSA silica monolith used in Ref. [23]. The corresponding number of theoretical plates for R-warfarin on the 3 mm × 4.6 mm i.d. HSA silica monolith was 11.5 to 15.2 at the given flow rates. The precision of the plate heights found using the affinity microcolumns ranged from ± 5% to ± 20%, with an average precision of ± 11%. This level of precision was actually slightly lower than noted earlier for carbamazepine but was sufficient for at least the preliminary screening of drug-protein interactions when using this type of affinity microcolumn.
3.5 HSA affinity microcolumns using silica monoliths versus silica particles
The final section of this study involved a comparison between affinity microcolumns that contained silica monoliths and similar affinity microcolumns that contained 7 µm silica particles. R-warfarin was used as the model analyte in this comparison and an intermediate microcolumn length of 3 mm was employed for this work. The same preparation of HSA and the same immobilization method (i.e., the Schiff base technique) were used for all supports in this investigation. It has been noted earlier that HSA silica monoliths can be prepared with up to a third more protein per unit volume than can be obtained with silica particles [23]. In this current study, a silica monolith with only a slightly higher content than the silica particles was used in preparing the HSA columns. The HSA content in the silica monolith was estimated to be 0.36 (± 0.02) µmol/mL and the content in the column with silica particles was 0.34 (± 0.02) µmol/mL. As shown in Figure 7, the use of the same protein, immobilization method and similar protein contents resulted in similar retention factors for R-warfarin on these columns, with an average retention factor that was 16% higher for the silica monolith.
Like the results noted earlier in Figure 7a for the HSA silica monoliths, the retention factors given in Figure 7b for R-warfarin on the HSA microcolumn packed with 7 µm silica particles gave consistent results up to flow rates of 4.0 mL/min. The variation in the results in Figure 7b was ± 7% between 0.1 and 4.0 mL/min, which was the same variation found in Figure 7a for data obtained using the HSA silica monolith. The precision of the retention factors measured on the column containing silica particles ranged from ± 1.8% to ± 14%, with an average of ± 6%. This precision was slightly worse than noted for the HSA microcolumn based on a silica monolith, but indicated that the silica particle-based microcolumn could also be used to provide reasonably reproducible retention factors for drug-protein binding experiments.
A larger difference between the microcolumns using a silica monolith or silica particles was seen when comparing their efficiencies (see Figure 8). Although the silica monolith gave consistent plate heights throughout the range of linear velocities that were sampled, the column containing silica particles gave a consistent increase in plate with linear velocity over the same range. These results agree with plate height plots that have been previously reported for R-warfarin on a 10 cm × 4.6 mm i.d. HSA silica monolith and an HSA column of a comparable size containing silica particles [23]. At the highest linear velocities that were used, the silica monolith gave plate heights that were almost five-fold lower than those for the HSA microcolumn with 7 µm silica particles (note: a smaller difference would be expected when using particles with a diameter of 3 or 5 µm). This difference gave the silica monolith a greater number of theoretical plates and greater efficiency at higher flow rates. This property, in turn, should make it easier to use affinity microcolumns based on silica monoliths at these higher flow rates for the rapid screening or characterization of drug-protein binding.
4. Conclusion
This report examined the development and use of affinity microcolumns containing HSA silica monoliths for the high-throughput analysis of drug-protein interactions. Studies using carbamazepine or warfarin as the injected analyte indicated that microcolumns as short as 1 to 3 mm could be used to provide reproducible estimates of retention factors or plate heights. Some benefits that were noted when using smaller columns for these measurements included the lower retention times and lower back pressures that could be obtained versus traditional HPLC affinity columns. Another benefit was the smaller amount of protein that was required for column preparation. One disadvantage with decreasing column length was the lower precision that resulted in retention factor and plate height measurements. Another possible disadvantage that was not a problem in this particular study was the lower sample capacity of the shorter columns.
A comparison was also made between HSA microcolumns containing 7 µm silica particles versus silica monoliths. It was found in work with R-warfarin that both types of supports could be used in HSA microcolumns for the determination of retention factors or plate heights in drug-protein binding studies. However, the better efficiency of the silica monolith made this the preferred support for work in which higher flow rates or a larger number of theoretical plates are needed for the analysis of drug-protein interactions. The information provided in this report should be useful in creating and adapting affinity microcolumns that contain HSA or other proteins for drug-binding studies. The ability of these microcolumns to provide reproducible results in a short amount of time should be particularly appealing for the high-throughput screening of drug protein binding or in the rapid determination of percent binding, binding affinity, or dissociation/association rates for proteins with drug candidates [41–43].
Acknowledgments
This work was supported by the National Institutes of Health under grant R01 GM044931 and was conducted in facilities that were renovated under NIH grant RR015468.
References
- 1.Ikegami T, Tanaka N. Curr. Opin. Chem. Biol. 2004;8:527–533. doi: 10.1016/j.cbpa.2004.08.009. [DOI] [PubMed] [Google Scholar]
- 2.Guiochon G. J. Chromatogr. A. 2007;1168:101–168. doi: 10.1016/j.chroma.2007.05.090. [DOI] [PubMed] [Google Scholar]
- 3.Unger KK, Skudas R, Schulte MM. J. Chromatogr. A. 2008;1184:393–415. doi: 10.1016/j.chroma.2007.11.118. [DOI] [PubMed] [Google Scholar]
- 4.Ikegami T, Tanaka N. Curr. Opin. Chem. Biol. 2004;8:527–533. doi: 10.1016/j.cbpa.2004.08.009. [DOI] [PubMed] [Google Scholar]
- 5.Svec F. J. Sep. Sci. 2004;27:1419–1430. doi: 10.1002/jssc.200401825. [DOI] [PubMed] [Google Scholar]
- 6.Mallik R, Hage DS. J. Sep. Sci. 2006;29:1686. doi: 10.1002/jssc.200600152. [DOI] [PubMed] [Google Scholar]
- 7.Kalashnikova I, Ivanova ND, Tennikova TB. Russ. J. Appl. Chem. 2008;81:867–873. [Google Scholar]
- 8.Kalashnikova I, Ivanova N, Tennikova T. Anal. Chem. 2007;79:5173–5180. doi: 10.1021/ac0700629. [DOI] [PubMed] [Google Scholar]
- 9.Vlakh E, Ostryanina N, Jungbauer A, Tennikova T. J. Biotechnol. 2004;107:275–284. doi: 10.1016/j.jbiotec.2003.10.013. [DOI] [PubMed] [Google Scholar]
- 10.Ostryanina ND, Vlasov GP, Tennikova T. J. Chromatogr. A. 2002;949:163–171. doi: 10.1016/s0021-9673(02)00007-9. [DOI] [PubMed] [Google Scholar]
- 11.Platonova GA, Tennikova T. J. Chromatogr. A. 2005;1065:75–81. doi: 10.1016/j.chroma.2004.10.073. [DOI] [PubMed] [Google Scholar]
- 12.Jiang T, Mallik R, Hage DS. Anal. Chem. 2005;77:2362–2372. doi: 10.1021/ac0483668. [DOI] [PubMed] [Google Scholar]
- 13.Champagne J, Delattre C, Shanthi C, Satheesh B, Duverneuil L, Vijayalakshmi MA. Chromatographia. 2007;65:639–648. [Google Scholar]
- 14.Zacharis CK, Kalaitzantonakis EA, Podgornik A, Theodoridis G. J. Chromatogr. A. 2007;1144:126–134. doi: 10.1016/j.chroma.2006.12.081. [DOI] [PubMed] [Google Scholar]
- 15.Josic D, Buchacher A. J. Biochem. Biophys. Methods. 2001;48:153–174. doi: 10.1016/s0165-022x(01)00195-6. [DOI] [PubMed] [Google Scholar]
- 16.Mallik R, Jiang T, Hage DS. Anal. Chem. 2004;76:7013–7022. doi: 10.1021/ac049001q. [DOI] [PubMed] [Google Scholar]
- 17.Kalashnikova I, Ivanova N, Tennikova T. Anal. Chem. 2008;80:2188–2198. doi: 10.1021/ac702258t. [DOI] [PubMed] [Google Scholar]
- 18.Gustavsson P-E, Larsson P-O. J. Chromatogr. A. 2001;925:69–78. doi: 10.1016/s0021-9673(01)01027-5. [DOI] [PubMed] [Google Scholar]
- 19.Gustavsson P-E, Larsson P-O. J. Chromatogr. A. 1999;832:29–39. doi: 10.1016/s0021-9673(98)00979-0. [DOI] [PubMed] [Google Scholar]
- 20.Lozinsky VI, Plieva FM, Galaev IY, Mattiasson B. Bioseparation. 2002;10:163–188. doi: 10.1023/a:1016386902611. [DOI] [PubMed] [Google Scholar]
- 21.Kumar A, Bansal V, Andersson J, Roychoudhury PK, Mattiasson B. J. Chromatogr. A. 2006;1103:35–42. doi: 10.1016/j.chroma.2005.08.094. [DOI] [PubMed] [Google Scholar]
- 22.Massolini G, Calleri E, Lavecchia A, Loiodice F, Lubda D, Temporini C, Fracchiolla G, Tortorella P, Novellino E, Caccialanza G. Anal. Chem. 2003;75:535–542. doi: 10.1021/ac0204193. [DOI] [PubMed] [Google Scholar]
- 23.Mallik R, Hage DS. J. Pharm. Biomed. Anal. 2008;46:820–830. doi: 10.1016/j.jpba.2007.03.017. [DOI] [PMC free article] [PubMed] [Google Scholar]
- 24.Kovarik P, Hodgson RJ, Covey T, Brook MA, Brennan JD. Anal. Chem. 2005;77:3340–3350. doi: 10.1021/ac048263p. [DOI] [PubMed] [Google Scholar]
- 25.Besanger TR, Hodgson RJ, Guillon D, Brennan JD. Anal. Chim. Acta. 2006;561:107–118. doi: 10.1016/j.aca.2005.12.066. [DOI] [PubMed] [Google Scholar]
- 26.Mallik R, Hage DS. J. Chromatogr. A. 2007;1149:294–304. doi: 10.1016/j.chroma.2007.03.063. [DOI] [PMC free article] [PubMed] [Google Scholar]
- 27.Nunez O, Nakanishi K, Tanaka N. J. Chromatogr. A. 2008;1191:231–252. doi: 10.1016/j.chroma.2008.02.029. [DOI] [PubMed] [Google Scholar]
- 28.Hodgson RJ, Chen Y, Zhang Z, Tleugabulova D, Long H, Zhao X, Organ M, Brook MA, Brennan JD. Anal. Chem. 2004;76:2780–2790. doi: 10.1021/ac0352124. [DOI] [PubMed] [Google Scholar]
- 29.Kato M, Inuzuka K, Sakai-Kato K, Toyo'oka T. Anal. Chem. 2005;77:1813–1818. doi: 10.1021/ac048388u. [DOI] [PubMed] [Google Scholar]
- 30.Feng S, Pan C, Jiang X, Xu S, Zhou H, Ye M, Zou H. Proteomics. 2007;7:351–360. doi: 10.1002/pmic.200600045. [DOI] [PubMed] [Google Scholar]
- 31.Peters T., Jr . All About Albumin: Biochemistry, Genetics, and Medical Applications. San Diego, CA: Academic Press; 1996. [Google Scholar]
- 32.Otagiri M. Drug Metab. Pharmacokinet. 2005;20:309–323. doi: 10.2133/dmpk.20.309. [DOI] [PubMed] [Google Scholar]
- 33.Bertucci C, Domenici E. Curr. Med. Chem. 2002;9:1463–1481. doi: 10.2174/0929867023369673. [DOI] [PubMed] [Google Scholar]
- 34.Joseph KS, Moser AC, Basiaga SBG, Schiel JE, Hage DS. J. Chromatogr. A. 2009;1216:3492–3500. doi: 10.1016/j.chroma.2008.09.080. [DOI] [PMC free article] [PubMed] [Google Scholar]
- 35.Lai CM, Moore P, Quon CY. Res. Comm. Mol. Path. Pharmacol. 1995;88:51–62. [PubMed] [Google Scholar]
- 36.Kim HS, Hage DS. J. Chromatogr. B. 2005;816:57–66. doi: 10.1016/j.jchromb.2004.11.006. [DOI] [PubMed] [Google Scholar]
- 37.MacKichan JJ, Zola EM. Br. J. Clin. Pharmacol. 1984;18:487–493. doi: 10.1111/j.1365-2125.1984.tb02496.x. [DOI] [PMC free article] [PubMed] [Google Scholar]
- 38.Moser AC, Kingsbury C, Hage DS. J. Pharm. Biomed. Anal. 2006;41:1101–1109. doi: 10.1016/j.jpba.2006.02.012. [DOI] [PubMed] [Google Scholar]
- 39.Loun B, Hage DS. Anal. Chem. 1994;66:3814–3822. doi: 10.1021/ac00093a043. [DOI] [PubMed] [Google Scholar]
- 40.Loun B, Hage DS. Anal. Chem. 1996;68:1218–1225. doi: 10.1021/ac950827p. [DOI] [PubMed] [Google Scholar]
- 41.Hage DS. J. Chromatogr. B. 2002;768:3–30. doi: 10.1016/s0378-4347(01)00482-0. [DOI] [PubMed] [Google Scholar]
- 42.Hage DS, Jackson A, Sobansky MR, Schiel JE, Yoo MJ, Joseph KS. J. Sep. Sci. 2009;32:835–853. doi: 10.1002/jssc.200800640. [DOI] [PMC free article] [PubMed] [Google Scholar]
- 43.Hage DS, Chen J. In: Handbook of Affinity Chromatography. 2nd Ed. Hage DS, editor. Boca Raton: Taylor & Francis/CRC Press; 2006. pp. 595–628. [Google Scholar]
- 44.Ruhn PF, Garver S, Hage DS. J. Chromatogr. A. 1994;669:9–19. doi: 10.1016/0021-9673(94)80332-3. [DOI] [PubMed] [Google Scholar]
- 45.Loun B, Hage DS. J. Chromatogr. 1992;579:225–235. [PubMed] [Google Scholar]
- 46.Smith PK, Krohn RI, Hermanson GT, Mallia AK, Gartner FH, Provenzano MD, Fujimoto EK, Goeke NM, Olson BJ, Klenk DC. Anal. Biochem. 1985;150:76–85. doi: 10.1016/0003-2697(85)90442-7. [DOI] [PubMed] [Google Scholar]
- 47.Yoo MJ, Smith QR, Hage DS. J. Chromatogr. B. 2009;877:1149–1154. doi: 10.1016/j.jchromb.2009.02.070. [DOI] [PMC free article] [PubMed] [Google Scholar]
- 48.Yang J, Hage DS. J. Chromatogr. A. 1997;766:15–25. doi: 10.1016/s0021-9673(96)01040-0. [DOI] [PubMed] [Google Scholar]
- 49.Loun B. Ph.D. thesis. Lincoln, NE: University of Nebraska-Lincoln; 1994. [Google Scholar]


