

Abstract
Background
The growing number of individuals surviving childhood cancer has increased the awareness of adverse long-term sequelae. One of the most worrisome complications following cancer therapy is the development of second malignant neoplasms (SMN).
Methods
We describe the incidence of solid organ SMN in survivors of pediatric malignant bone tumors treated on legacy CCG/POG protocols from 1976 to 2005. This retrospective cohort study included 2842 patients, 1686 treated for osteosarcoma (OS) and 1156 treated for Ewings Sarcoma (ES).
Results
The cohort included 56% males and 44% females, with a median age at primary diagnosis of 13 years. The median length of follow-up was 6.1 years (range: 0 to 20.9 years). In this analysis, 64% of patients were alive. Seventeen patients with solid organ SMN were identified. The standardized incidence ratio was 2.9 (95% CI, 1.4–5.4) for patients treated for OS and 5.0 (95% CI, 2.6–9.4) for patients treated for ES. The median time from diagnosis to development of solid SMN was 7 years (range: 1 to 13 years). The 10-year cumulative incidence of solid organ SMN for the entire cohort was 1.4% (95%CI 0.6–2%).
Conclusions
The magnitude of risk of solid SMNs was modest after treatment for malignant bone tumors. However, radiation-related solid SMNs will increase with longer follow-up. As nearly one-third of patients succumb to their disease, recurrence remains the most significant problem. Development of improved therapies with fewer long-term consequences is paramount. Follow-up should focus on monitoring for both recurrence of primary malignancies and development of SMN.
The two most common malignant bone tumors in children and adolescents are osteosarcoma and Ewing sarcoma family of tumors (ESFT). As reported by SEER from 1975–951, the annual incidence rate of malignant bone tumors is 8.7 per million children younger than 20 years of age with approximately 400 children diagnosed with osteosarcoma and 200 children diagnosed with ESFT each year in the United States. The 5-year survival is improving for children with malignant bone tumors and, with aggressive, multimodal therapy, nearly 70% are expected to be long-term survivors. One of the most worrisome complications following cancer therapy is second malignant neoplasms (SMNs). The overall cumulative incidence of SMN in survivors of childhood cancer is reported as 3.2% at 20 years, but varies from 1.6% to 7.6% depending on the primary diagnosis.2
As osteosarcoma is generally considered radioresistant, chemotherapy and surgery are the primary therapeutic modalities for this disease. The backbone of osteosarcoma chemotherapy includes cisplatinum, doxorubicin and high dose methotrexate. The addition of other agents, such as carboplatinum, ifosfamide and etoposide, have been investigated 3–5. While osteosarcoma is usually sporadic, a rare patient may have an underlying cancer predisposition syndrome, namely Li-Fraumeni syndrome, possibly resulting in an increased risk of SMNs because of genetic susceptibility. There is limited information regarding the risk of SMNs after the treatment of osteosarcoma6,7
Therapy for ESFT involves multiagent chemotherapy and local control with either surgery and/or radiation. During the 1980s and 1990s the backbone of therapy included vincristine, doxorubicin, and cyclophosphamide. Therapeutic trials have demonstrated significant survival advantage by addition of ifosfamide and etoposide for patients with localized disease.8,9 In contrast to osteosarcoma, Li-Fraumeni is not typically associated with ESFT.
Several studies have examined the risk of SMN after treatment for ESFTs. However, small sample size10, varying therapies11, short follow-up12 and single institution studies13 limit the generalizability of these results. While most of the previous reports have focused on secondary leukemia or myelodysplasia occurring after bone tumors, only a few have focused on solid tumors developing in this patient population. 14
This study aims to determine the incidence of solid second malignancies, and identify potential risk factors in children and adolescents with malignant bone tumors entered on legacy Children’s Cancer Group/Pediatric Oncology Group (CCG/POG) protocols since 1976.
Methods
CCG/POG conducted clinical trials in cooperation with member institutions throughout the United States, Canada, Australia and selected countries from Europe. The member institutions were required to register all newly diagnosed cancer patients with the operations office, after which eligible patients were entered into active therapeutic protocols. The operations office was responsible for determining patient eligibility, randomized assignments to the appropriate therapeutic arms (if necessary), and follow-up of patients for all potential outcomes. Member institutions were required to submit semi-annual follow-up reports on all patients enrolled in therapeutic protocols. Those reports included information on survival status, disease status, and development of second malignancies for all patients.
Our cohort consisted of 2842 patients with newly diagnosed osteosarcoma or ESFT who were younger than 33 years at diagnosis and were enrolled in one of the 11 therapeutic protocols for untreated osteosarcoma or ESFT conducted between 1976 and 2002. The distribution of patients by the therapeutic trials is summarized in Table 1. Informed consent was obtained from patients, parents, or guardians at the time of enrollment. Clinical results of many of the trials, with the therapeutic plans, have been published (references indicated in Table 1).
Table 1.
Treatment protocols, timing and distribution of patients included in this cohort study.
| Protocol Numberref | Diagnosis | Date opened | Date closed | Number (%t) | Agents utilized* |
|---|---|---|---|---|---|
| CCG74125 | OS | September 1976 | October 1981 | 257(9%) | D,M,V |
| CCG78226 | OS | August 1983 | October 1986 | 232 (8%) | P,D,M,A,V,B,C |
| CCG792127 | OS | October 1993 | November 1997 | 777 (27%) | P,D,M,I |
| POG865128 | OS | March 1987 | March 1993 | 100 (4%) | P,D,M,A,B |
| POG925929 | OS | January 1992 | November 1994 | 37 (1%) | P,D,M,I,Ca |
| POG94504 | OS | May 1995 | September 1997 | 41 (1%) | P,D,M,I,E |
| POG975430 | OS | September 1999 | February 2002 | 242 (9%) | P,D,M,I,E |
| CCG78819 | ESFT | December 1988 | November 1992 | 324 (11%) | D,I,E,V,A,C |
| CCG794231 | ESFT | May 1995 | September 1998 | 465 (16%) | D,I,E,V,C |
| POG88509 | ESFT | December 1988 | December 1994 | 257 (9%) | D,I,E,V,A,C |
| POG945732 | ESFT | August 1999 | March 2000 | 110 (4%) | D,I,E,V,C |
OS = osteosarcoma ESFT = Ewing Sarcoma Family of Tumors P=cisplatin, D=doxorubicin, M=methotrexate, I=ifosfamide, E=etoposide, V=vincristine, B=bleomycin, A=actinomycin D, C=cyclophosphamide, Ca=Carboplatin
not all patients received each agent on the protocol as some protocols were varying pilot studies and some were randomized clinical trials
For each protocol, a therapeutic summary was prepared that included the dose of radiation therapy (and assigned fields) and chemotherapeutic exposures. Assigned cumulative doses were calculated for cisplatinum, doxorubicin, etoposide, cyclophosphamide, and ifosfamide. The use of chemotherapy and radiation therapy was categorized as dichotomized variables (Yes/No) and was included in the analysis using intent to treat method. The total cumulative doses ranged from 0 to 480 mg/m2 of body surface area for cisplatinum; from 90 to 600 mg/m2 for doxorubicin; from 0 to 5000 mg/m2 for etoposide; from 0 to 21.6 g/m2 for cyclophosphamide; and from 0 to 140 g/m2 for ifosfamide. Assigned radiation doses depended on tumor type, protocol and site of disease.
For patients with second neoplasms, date of diagnosis, histological characteristics, and tumor site were recorded. Pathology reports were requested from treating institutions and reviewed to verify diagnoses.
The time at risk for second neoplasms was computed from the date of diagnosis of osteosarcoma/ESFT to the date of diagnosis of second neoplasm, date of death, or date of last contact, whichever came first. The end of follow-up for the study was April 1, 2005. Overall and event-free survival was calculated using actuarial methods. Cumulative incidence of second solid malignancy (overall and by histological subtypes) over time was calculated and compared across characteristics of interest by the method proposed by Gray.15 To estimate the risk of second solid neoplasms, the number of person-years of observation was complied for subgroups of the cohort, defined by age and sex. Rates of incidence of cancer (obtained from the registry of Surveillance, Epidemiology, and End Results Program of the National Institute of Health)16 were used to calculate the expected number of cases of cancer. Standardized Incidence Ratio (SIR) was calculated as the ratio of observed to expected cases. The 95% confidence interval for the SIR was calculated assuming the number of cases follows a Poisson distribution.17
Results
The key characteristics of the cohort are summarized in Table 2. The median age at diagnosis was 13 years (range, 0 to 33) for malignant bone tumors. The median follow up time from the date of enrollment to date of last contact was 6.1 years (range: 0 to 20.9 years) among the 1812 patients alive at last contact. The date of last contact was within three years for 46% of patients who were alive before April 1, 2005. The overall survival of this cohort was 60% at 10 years (Figure 1A) and there is a significant difference in overall survival based on logrank test; however, the ultimate cure rate is not significantly different by primary diagnosis (Figure 1B). Seventeen patients developed a solid second malignant neoplasm, at a median of 7 years (range 1 to 13) from primary diagnosis. The histological subtypes included breast cancer (n=3), malignant fibrous histiocytoma (n=3), osteosarcoma (n=2), chondrosarcoma, leimyosarcoma, undifferentiated sarcoma, undifferentiated carcinoma, lung adenocarcinoma, renal cell carcinoma, ovarian cancer, papillary carcinoma and anaplastic astrocytoma (n=1 each) –Table 3.
Table 2.
Characteristics of the patient population with second neoplasms
| Total Cohort | Patients with Solid Second Neoplasms | |||
|---|---|---|---|---|
| All solid SMNs | Breast | Secondary Sarcomas | ||
| No. of Patients | 2842 | 17 | 3 | 9 |
| Type of Disease | ||||
| Osteosarcoma | 1686 (59 %) | 8 | 3 | 3 |
| Ewings Sarcoma | 1156 (41 %) | 9 | 0 | 6 |
| Gender | ||||
| Male | 1579 (56 %) | 5 (29 %) | 0 (0 %) | 4 (44 %) |
| Female | 1263 (44 %) | 12 (71 %) | 3 (100 %) | 5 (56 %) |
| Age at Diagnosis of Primary sarcoma (yr.) | ||||
| Median (Range) | 13 (0, 33) | 14 (2, 17) | 15 (14, 17) | 8 (2, 16) |
| Years from study enrollment to second Neoplasm (yr.) | ||||
| Median (range) | — | 7 (1, 13) | 7 (5, 13) | 6 (2, 12) |
| Age at Diagnosis of Second Neoplasm (yr.) | ||||
| Median (range) | — | 19 (8, 31) | 23 (19, 31) | 16 (8, 26) |
| Therapeutic Exposure (yes) | ||||
| Cisplatinum | 1429 (50 %) | 6(35 %) | 1 (33 %) | 3 (33 %) |
| Doxorubicin | 2842 (100 %) | 17(100 %) | 3 (100 %) | 9 (100 %) |
| Etoposide | 1120 (39 %) | 8 (47 %) | 0 (0 %) | 5 (56 %) |
| Cyclophosphamide | 1488 (52 %) | 15(88 %) | 1 (33 %) | 9 (100 %) |
| Ifosfamide | 1625 (57 %) | 8 (47 %) | 0 (0 %) | 5 (56 %) |
| Radiation | ||||
| No | 1329 (47 %) | 5 (29 %) | 1 (33 %) | 3 (33 %) |
| Yes | 1513 (53 %) | 12(71 %) | 2 (67 %) | 6 (67 %) |
| Status | ||||
| Died | 1030 (36 %) | 7 (41 %) | 1 (33 %) | 4 (44 %) |
| Alive | 1812 (64 %) | 10 (59 %) | 2 (67 %) | 5 (56 %) |
Figure 1.


Figure 1A Overall survival of all bone tumor patients.
Figure 1B Overall survival of bone tumor patients by primary diagnosis (Ewing sarcoma vs Osteosarcoma)
Table 3.
Key clinical information on patients with solid SMN
| Patient | Initial Diagnosis | Time to SMN diagnosis (yrs) | Treatment | Solid SMN | |||
|---|---|---|---|---|---|---|---|
| Cancer type (COG study number) | Age- primary diagnosis (yrs) | Cyclophosphamide (yes/no) | Etoposide (yes/no) | Radiation (yes/no) | Cancer type | ||
| 1 | Osteosarcoma (741) | 14 | 5 | No | No | Yes | Infiltrating ductal carcinoma of L Breast |
| 2 | Osteosarcoma (741) | 17 | 14 | No | No | Yes | Inflitrating colloid mucinous carcinoma L Breast |
| 3 | Osteosarcoma(782) | 16 | 1 | Yes | No | No | Adenocarcinoma of lung L chest |
| 4 | Osteosarcoma(782) | 14 | 12 | Yes | No | No | Leiomyosarcoma - originating in radiated R orbital field |
| 5 | Osteosarcoma(782) | 16 | 2 | Yes | No | No | Malignant fibrous histiocytoma of bone(orbit/sinus) |
| 6 | Osteosarcoma(782) | 15 | 8 | Yes | No | No | Breast cancer |
| 7 | Osteosarcoma(782) | 8 | 7 | Yes | No | No | Malignant undifferentiated tumor of R chest wall |
| 8 | Ewing Sarcoma(7881) | 13 | 10 | Yes | Yes | Yes | Ovarian tumor(Stage I) |
| 9 | Ewing Sarcoma(7881) | 7 | 9 | Yes | Yes | Yes | Malignant fibrous histiocytoma of bone(orbit) |
| 10 | Ewing Sarcoma(7881) | 7 | 5 | Yes | Yes | Yes | Chondrosarcoma vs chondroblastic osteosarcoma |
| 11 | Ewing Sarcoma(7881) | 15 | 8 | Yes | Yes | Yes | Osteosarcoma |
| 12 | Osteosarcoma(8651) | 14 | 10 | Yes | No | Yes | Anaplastic astrocytoma |
| 13 | Ewing Sarcoma(8850) | 5 | 10 | Yes | No | Yes | Osteosarcoma |
| 14 | Ewing Sarcoma(8850) | 2 | 6 | Yes | Yes | Yes | Malignant fibrous histiocytoma of bone(femur) |
| 15 | Ewing Sarcoma(7942) | 13 | 6 | Yes | Yes | Yes | Poorly differentiated sarcoma with myogenic features |
| 16 | Ewing Sarcoma(7942) | 7 | 8 | Yes | Yes | Yes | Papillary carcinoma of the thyroid |
| 17 | Ewing Sarcoma(7942) | 15 | 7 | Yes | Yes | Yes | Renal cell carcinoma |
The estimated cumulative incidence rate for solid second malignant neoplasm was 1.4% (S.E. 0.4%) at 10 years for the entire cohort (Figure 2A), and was 0.9% (S.E. 0.4%) for osteosarcoma and 1.8% (S.E. 0.65%) for ESFT (Figure 2B). Compared to a gender and age matched general population, patients with ESFT were at a 5-fold increased risk of developing a solid second malignancy (SIR=5.0, 95% CI 2.6 to 9.4), while patients with osteosarcoma were at a 2.9-fold increased risk (SIR=2.9, 95% CI 1.4 to 5.4).
Figure 2.
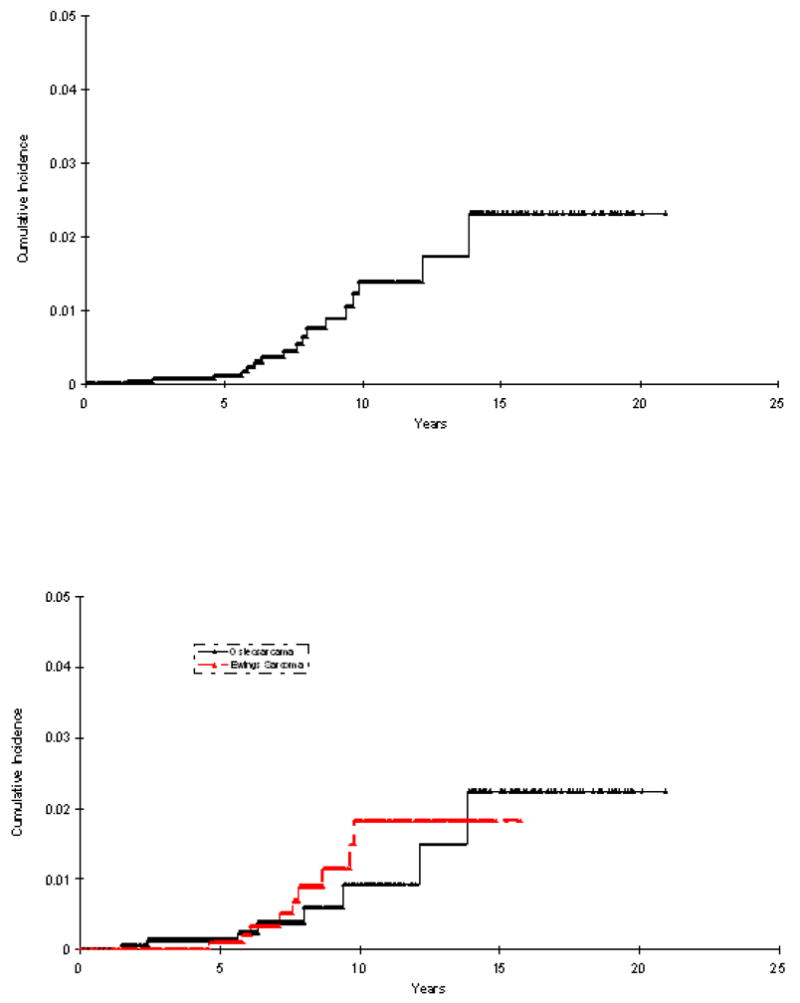
Figure 2A Cumulative incidence of SMN among all bone tumor patients
Figure 2B Cumulative incidence of SMN among bone tumor patients by primary diagnosis (Ewing sarcoma vs Osteosarcoma)
Certain therapeutic exposures were associated with increased risk of solid second malignant neoplasms. Exposure to etoposide and cyclophosphamide were associated with an increased the risk of solid second malignant neoplasms with a standardize incidence ratio of 4.8 (95% CI. 2.5 to 9.5) and 5.8 (95% CI 3.5 to 9.5), respectively. Exposure to radiation therapy also increased the risk of solid second malignancies with a standardized incidence ratio of 4.1 (95% CI 2.4 to 7). With a median follow up time of 9.3 years (range:3.0 to 18.7 years) for the 17 patients who developed solid SMN, the estimated five-year overall survival after development of a solid second malignant neoplasm was 38% (Figure 3).
Figure 3.
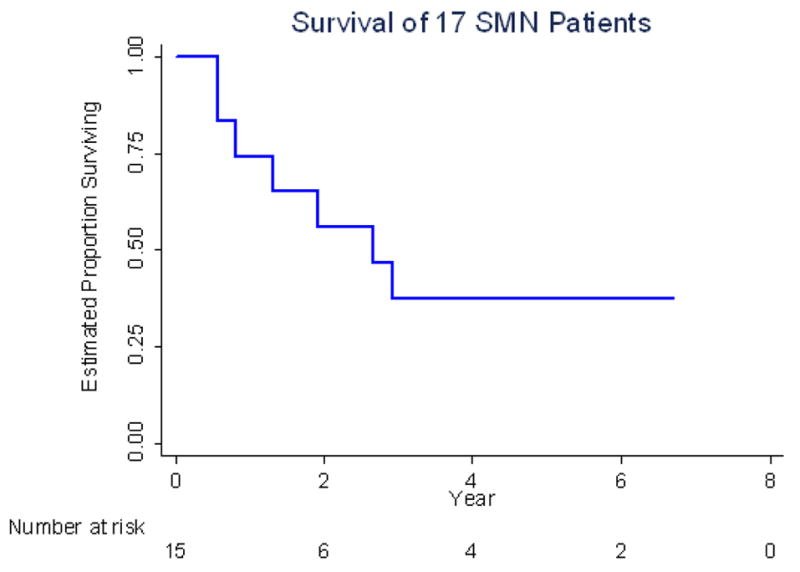
Overall survival of 17 patients with solid second malignant neoplasms since their solid second malignant neoplasms date.
Sensitivity Analysis
At the time of the analysis, contact was documented with 46% of those alive within the previous 3 years. To alleviate potential problems related to incomplete follow-up, sensitivity analyses were performed where all patients who had not had an event (death or SMN) were censored as of April 1, 2005, irrespective of their actual date of last contact. It was assumed that those lost to follow-up did not develop an SMN. With these extremely conservative assumptions, a lower boundary was placed on the reported estimates. The results of the sensitivity analysis are presented in Table 4.
Table 4.
Standardized Incidence Ratio – Sensitivity Analysis
| Estimate from Observed Data | Follow-up until April 1, 2005 | ||||
|---|---|---|---|---|---|
| SIR | 95% CI | SIR | 95% CI | ||
| All SMNs | 3.73 | 2.35–5.99 | 1.57 | 0.99–2.52 | |
| By Primary Diagnosis | |||||
| Osteosarcoma | 2.93 | 1.41–5.39 | 1.05 | 0.50–2.63 | |
| Ewing Sarcoma | 4.96 | 2.64–9.42 | 2.79 | 1.49–5.30 | |
| By type of SMN | |||||
| Breast Cancer | 27.80 | 10.05–81.26 | 5.17 | 1.87–15.12 | |
| Sarcomas | 17.66 | 9.41–33.53 | 8.46 | 4.51–16.06 | |
| By key therapeutic exposures | |||||
| Cyclophosphamide | Yes | 5.77 | 3.52–9.51 | 2.54 | 1.55–4.19 |
| No | 1.03 | 0.32–3.71 | 0.41 | 0.13–1.47 | |
| Etoposide | Yes | 4.83 | 2.49–9.53 | 2.74 | 1.41–5.40 |
| No | 3.11 | 1.66–5.91 | 1.14 | 0.61–2.17 | |
| Radiation | Yes | 4.08 | 2.35–7.13 | 1.88 | 1.09–3.29 |
| No | 3.12 | 1.37–7.27 | 1.13 | 0.50–2.63 | |
SIR denotes standardized incidence ratio
CI denotes confidence interval
SMN denotes second malignant neoplasms
Discussion
This retrospective cohort study showed that the cumulative incidence of solid SMNs in patients diagnosed with primary malignant bone tumors is relatively low with a cumulative incidence of 1.4% at 10 years. Comparable risks of second solid malignancies were observed in patients with ESFT and osteosarcoma. We found that radiation, cyclophosphamide and etoposide may be associated with an increased risk of solid SMNs. The outcome after development of a solid SMN is poor with a 5 year overall survival of less than 40%.
The strength of this study lies in the size of the cohort and, despite limitations, the quality of the data. The COG cohort of patients with malignant bone tumors includes more patients than those included in SEER and the Childhood Cancer Survivorship Study (CCSS) databases. Of the 752 children diagnosed with osteosarcoma and 479 initially diagnosed with Ewing sarcoma followed in the SEER database, there were 10 and 15 SMN reported with 15 and 44 excess cancers per 10,000 person-years, respectively.18 In the initial report from CCSS, 25 of the 1136 patients being followed with malignant bone cancer developed a SMN.19 Of these, it is notable that 6 were breast cancers. There was a 17.9 absolute excess risk for second cancers per 10,000 person-years of follow-up. The outcome was not separately reported for osteosarcoma and Ewing sarcoma. The data from the COG cohort expand on and corroborate the findings from these studies.
Earlier studies have reported a high incidence of SMNs in patients with ESFT, with the magnitude of risk approaching 30% at 10 to 20 years after treatment.20,21 More recent studies suggest a lower incidence ranging from 1% at five years to 6.5 percent at 10 years.11–13,22 While each of these studies is based on relative small sample sizes, most identify radiation as playing a role in the risk of developing a solid second malignant neoplasm. The current study reports a cumulative incidence of solid second malignant neoplasms in patients with ESFT in this cohort to be 1.8% at 10 years. It is anticipated that the incidence will rise with increasing follow-up, as has been reported for radiation-related second malignancies in other cohorts.
There are fewer reports on the incidence of SMNs in survivors of osteosarcoma. In our study, the overall 10-year cumulative incidence of solid second malignant neoplasms was 0.9%. Others have reported a 10-year cumulative incidence of 2 to 3% at 10 years, but the studies also included hematologic malignancies.6,7 Although the relative risk of solid SMNs in long-term survivors of osteosarcoma was higher than the general population in the current study, the magnitude of risk was lower than that for Ewing sarcoma. This likely reflects increased utilization of radiation in patients surviving Ewing sarcoma, but may also relate to higher cumulative doses of alkylating agents and etoposide in patients with Ewing sarcoma (data not shown). Of note, all 3 of the solid SMN of the breast arose in survivors of osteosarcoma. These, and perhaps others, may be patients with Li-Fraumeni syndrome, which is characterized by the development of sarcomas and early-breast cancer and an exceptionally high risk of developing multiple primary cancers.23
Thus, our study, with relatively large numbers confirms the reports of others 11–13,22 that the magnitude of risk of solid SMNs is modest after treatment for a primary bone cancer. There are two major possible explanations for the low cumulative incidence of solid SMNs. First, and more optimistically, there may be fewer solid SMNs in the recent era related to improved therapeutic techniques. For example, it is possible that a patient may be able to achieve adequate local control with surgery alone after neoadjuvant therapy, thus omitting the need for radiation. Additionally radiation techniques have substantially improved reducing the normal tissue exposure. The second reason could stem from the fact that the cohort has been followed for a median of 6 years, and that, with increasing follow-up, radiation-related solid malignancies will emerge, since they typically occur after a latency of 10 to 15 years.
However, as with other large cohorts, there is patient attrition with extended follow-up. In order to compensate for the impact of loss to follow-up on the magnitude of risk, we have conducted sensitivity analyses, based on the assumption that patients lost to follow-up are alive and have not had an adverse event of interest. This extremely conservative assumption allows one to put a lower limit on the magnitude of risk, thus permitting an estimate of the true risk somewhere between the reported value and that derived by these sensitivity analyses. Another limitation relates to the small numbers of events that preclude any significant examination of the risks for SMNs or any meaningful subset analyses. Also, there is no family history data available preventing us from predicting if any patients were likely to have Li-Fraumeni or another cancer predisposition syndrome. Finally, we were not able to accurately assess whether the SMN arose within the radiation field.
Methods to assure ongoing, long-standing follow-up of children surviving cancer are necessary. The Children’s Oncology Group has instituted long-term follow-up guidelines that may help assure ongoing surveillance of late effects.24 Additional resources are necessary and are currently being instituted by COG, to assure the long-term follow-up of cancer survivors.
Acknowledgments
Supported by COG Chairs’ grant CA 98543, CCG grant CA 13539, POG grant CA 30969. A complete listing of grant support for research conducted by CCG and POG before initiation of the COG grant in 2003 is available online at: http://www.childrensoncologygroup.org/admin/grantinfo.htm. Also supported by funds from the Campini Foundation and Swim Across America.
References
- 1.Gurney J, Swensen A, Bulterys M. Malignant bone tumors. In: Ries L, Smith M, Gurney J, et al., editors. Cancer Incidence and Survival among Children and Adolescents: United States SEER Program 1975–1995. Bethesda, MD: National Cancer Institute, SEER Program; 1999. pp. 99–110. [Google Scholar]
- 2.Robison LL, Green DM, Hudson M, et al. Long-term outcomes of adult survivors of childhood cancer. Cancer. 2005;104:2557–64. doi: 10.1002/cncr.21249. [DOI] [PubMed] [Google Scholar]
- 3.Gentet JC, Brunat-Mentigny M, Demaille MC, et al. Ifosfamide and etoposide in childhood osteosarcoma. A phase II study of the French Society of Paediatric Oncology. Eur J Cancer. 1997;33:232–7. doi: 10.1016/s0959-8049(96)00439-x. [DOI] [PubMed] [Google Scholar]
- 4.Goorin AM, Harris MB, Bernstein M, et al. Phase II/III trial of etoposide and high-dose ifosfamide in newly diagnosed metastatic osteosarcoma: a pediatric oncology group trial. J Clin Oncol. 2002;20:426–33. doi: 10.1200/JCO.2002.20.2.426. [DOI] [PubMed] [Google Scholar]
- 5.Ferguson WS, Harris MB, Goorin AM, et al. Presurgical window of carboplatin and surgery and multidrug chemotherapy for the treatment of newly diagnosed metastatic or unresectable osteosarcoma: Pediatric Oncology Group Trial. J Pediatr Hematol Oncol. 2001;23:340–8. doi: 10.1097/00043426-200108000-00004. [DOI] [PubMed] [Google Scholar]
- 6.Aung L, Gorlick RG, Shi W, et al. Second malignant neoplasms in long-term survivors of osteosarcoma: Memorial Sloan-Kettering Cancer Center Experience. Cancer. 2002;95:1728–34. doi: 10.1002/cncr.10861. [DOI] [PubMed] [Google Scholar]
- 7.Pratt CB, Meyer WH, Luo X, et al. Second malignant neoplasms occuring in survivors of osteosarcoma. Cancer. 1997;80:960–5. doi: 10.1002/(sici)1097-0142(19970901)80:5<960::aid-cncr19>3.0.co;2-u. [DOI] [PubMed] [Google Scholar]
- 8.Kolb EA, Kushner BH, Gorlick R, et al. Long-term event-free survival after intensive chemotherapy for Ewing’s family of tumors in children and young adults. J Clin Oncol. 2003;21:3423–30. doi: 10.1200/JCO.2003.10.033. [DOI] [PubMed] [Google Scholar]
- 9.Grier HE, Krailo MD, Tarbell NJ, et al. Addition of ifosfamide and etoposide to standard chemotherapy for Ewing’s sarcoma and primitive neuroectodermal tumor of bone. N Engl J Med. 2003;348:694–701. doi: 10.1056/NEJMoa020890. [DOI] [PubMed] [Google Scholar]
- 10.Smith LM, Cox RS, Donaldson SS. Second cancers in long-term survivors of Ewing’s sarcoma. Clin Orthop. 1992:275–81. [PubMed] [Google Scholar]
- 11.Dunst J, Ahrens S, Paulussen M, et al. Second malignancies after treatment for Ewing’s sarcoma: a report of the CESS-studies. Int J Radiat Oncol Biol Phys. 1998;42:379–84. doi: 10.1016/s0360-3016(98)00228-4. [DOI] [PubMed] [Google Scholar]
- 12.Paulussen M, Ahrens S, Lehnert M, et al. Second malignancies after ewing tumor treatment in 690 patients from a cooperative German/Austrian/Dutch study. Ann Oncol. 2001;12:1619–30. doi: 10.1023/a:1013148730966. [DOI] [PubMed] [Google Scholar]
- 13.Fuchs B, Valenzuela RG, Petersen IA, et al. Ewing’s sarcoma and the development of secondary malignancies. Clin Orthop. 2003:82–9. doi: 10.1097/01.blo.0000093900.12372.e4. [DOI] [PubMed] [Google Scholar]
- 14.Kuttesch JF, Jr, Wexler LH, Marcus RB, et al. Second malignancies after Ewing’s sarcoma: radiation dose-dependency of secondary sarcomas. J Clin Oncol. 1996;14:2818–25. doi: 10.1200/JCO.1996.14.10.2818. [DOI] [PubMed] [Google Scholar]
- 15.Gray R. A class of k-sample tests for comparing the cumulative incidence of a competing risk. Ann Stat. 1988;16:1141–1154. [Google Scholar]
- 16.Ries L, Eisner M, Kosary C, et al. SEER Cancer Statistics Review 1975–2000. National Cancer Institute; Bethesda, MD: 2003. http://seer.cancer.gov/csr/1975_2000. [Google Scholar]
- 17.Breslow N, Day N. The design and analysis of cohort studies. II. New York: IARC; 1987. Statistical methods in cancer research. [PubMed] [Google Scholar]
- 18.Curtis RE, Freedman DM, Ron E, et al. New Malignancies Among Cancer Survivors: SEER Cancer Registries, 1973–2000. Bethesda, MD: National Cancer Institute; 2006. [Google Scholar]
- 19.Neglia JP, Friedman DL, Yasui Y, et al. Second malignant neoplasms in five-year survivors of childhood cancer: childhood cancer survivor study. J Natl Cancer Inst. 2001;93:618–29. doi: 10.1093/jnci/93.8.618. [DOI] [PubMed] [Google Scholar]
- 20.Strong LC, Herson J, Osborne BM, et al. Risk of radiation-related subsequent malignant tumors in survivors of Ewing’s sarcoma. J Natl Cancer Inst. 1979;62:1401–6. [PubMed] [Google Scholar]
- 21.Tucker MA, D’Angio GJ, Boice JD, Jr, et al. Bone sarcomas linked to radiotherapy and chemotherapy in children. N Engl J Med. 1987;317:588–93. doi: 10.1056/NEJM198709033171002. [DOI] [PubMed] [Google Scholar]
- 22.Bacci G, Longhi A, Barbieri E, et al. Second malignancy in 597 patients with ewing sarcoma of bone treated at a single institution with adjuvant and neoadjuvant chemotherapy between 1972 and 1999. J Pediatr Hematol Oncol. 2005;27:517–20. doi: 10.1097/01.mph.0000183270.28785.33. [DOI] [PubMed] [Google Scholar]
- 23.Hisada M, Garber JE, Fung CY, et al. Multiple primary cancers in families with Li-Fraumeni syndrome. J Natl Cancer Inst. 1998;90:606–11. doi: 10.1093/jnci/90.8.606. [DOI] [PubMed] [Google Scholar]
- 24.Landier W, Bhatia S, Eshelman DA, et al. Development of risk-based guidelines for pediatric cancer survivors: the Children’s Oncology Group Long-Term Follow-Up Guidelines from the Children’s Oncology Group Late Effects Committee and Nursing Discipline. J Clin Oncol. 2004;22:4979–90. doi: 10.1200/JCO.2004.11.032. [DOI] [PubMed] [Google Scholar]
- 25.Krailo M, Ertel I, Makley J, et al. A randomized study comparing high-dose methotrexate with moderate-dose methotrexate as components of adjuvant chemotherapy in childhood nonmetastatic osteosarcoma: a report from the Childrens Cancer Study Group. Med Pediatr Oncol. 1987;15:69–77. doi: 10.1002/mpo.2950150205. [DOI] [PubMed] [Google Scholar]
- 26.Provisor AJ, Ettinger LJ, Nachman JB, et al. Treatment of nonmetastatic osteosarcoma of the extremity with preoperative and postoperative chemotherapy: a report from the Children’s Cancer Group. J Clin Oncol. 1997;15:76–84. doi: 10.1200/JCO.1997.15.1.76. [DOI] [PubMed] [Google Scholar]
- 27.Meyers PA, Schwartz CL, Krailo M, et al. Osteosarcoma: a randomized, prospective trial of the addition of ifosfamide and/or muramyl tripeptide to cisplatin, doxorubicin, and high-dose methotrexate. J Clin Oncol. 2005;23:2004–11. doi: 10.1200/JCO.2005.06.031. [DOI] [PubMed] [Google Scholar]
- 28.Goorin AM, Schwartzentruber DJ, Devidas M, et al. Presurgical chemotherapy compared with immediate surgery and adjuvant chemotherapy for nonmetastatic osteosarcoma: Pediatric Oncology Group Study POG-8651. J Clin Oncol. 2003;21:1574–80. doi: 10.1200/JCO.2003.08.165. [DOI] [PubMed] [Google Scholar]
- 29.Goorin AM, Gieser P, Ferguson W, et al. Successful phase II trial of etoposide and high dose ifosfamide in newly diagnosed metastatic osteosarcoma: a pediatric oncology group trial (POG) ASCO. 1998:A2056. doi: 10.1200/JCO.2002.20.2.426. [DOI] [PubMed] [Google Scholar]
- 30.Schwartz CL, Wexler LH, Devidas M, et al. P9754 therapeutic intensification in non-metastatic osteosarcoma: A COG trial. J Clin Oncol. 2004;22:A8514. [Google Scholar]
- 31.Granowetter L, Womer R, Devidas M, et al. Comparison of dose intensified and standard dose chemotherapy for the treatment of non-metastatic Ewing’s sarcoma (ES) and primitive neuroectodermal tumor (PNET) of bone and soft tissue: a Pediatric Oncology Group-Children’s Cancer Group phase III trial. Med Pediatr Oncol. 2001;37:172. [Google Scholar]
- 32.Bernstein ML, Devidas M, Lafreniere D, et al. Intensive therapy with growth factor support for patients with Ewing tumor metastatic at diagnosis: Pediatric Oncology Group/Children’s Cancer Group Phase II Study 9457--a report from the Children’s Oncology Group. J Clin Oncol. 2006;24:152–9. doi: 10.1200/JCO.2005.02.1717. [DOI] [PubMed] [Google Scholar]