Abstract
Although the state of wakefulness has an impact on many physiological parameters, this variable is seldom controlled for in in vivo experiments, because the existing techniques to identify periods of wakefulness are laborious and difficult to implement. We here report on a simple non-invasive technique to achieve this goal, using the analysis of video material, collected along with the electrophysiologic data, to analyze eye-lid movements. The technique was applied to recordings in non-human primates, and allowed us to automatically identify periods during which the subject has its eyes open. A comparison with frontal electroencephalographic records confirmed that such periods corresponded to wakefulness.
Introduction
Although in vivo electrophysiological recordings of brain activity in animals are strongly influenced by the state of arousal of the experimental subjects (Gatev and Wichmann, 2003; Merica and Fortune, 2004), wakefulness is often not directly monitored in these studies (Darbin and Wichmann, 2008), because the available monitoring techniques are difficult and laborious to implement. The existing techniques rely on the detection of slow-wave activity in electroencephalograms (EEG, Gatev and Wichmann, 2008; Louis et al., 2004), or on manual scoring of eyelid opening. As an alternative to these techniques, we developed a simple, automated technique to identify periods of wakefulness in head-restrained animals. The method is based on the analysis of eyelid movements (see also Kaefer, 2003) in standard video records that can be obtained in parallel to the electrophysiologic recordings of brain activity, even under dim lighting conditions. We demonstrate the use of this technique in a Rhesus monkey.
Methods
General method
The method requires that the animal is head-restrained throughout the recording procedure, as is frequently the case in extracellular in vivo recordings. A difficulty in the video detection of eyelid opening or closing is the fact that the video contrast between eyelid and iris color (and hence, between periods during which the eye lids are open or closed) is small, especially under low-light conditions. We introduce a method to substantially enhance the contrast by placing a dark ink marker on one of the animal’s eyelids either acutely or permanently, as a tattoo. With one eyelid marked in this way, episodes of eyelid closure can be detected as periods of high contrast between the images of the two eyes, while episodes of open eyelids are classified as periods of low contrast. A stationary camera records the face of the animal. Each frame of the video is time-stamped and stored along with the electrophysiological data. During off-line analysis, portions of the video frames that correspond to the two eyes are first manually identified as regions of interest (ROIs), followed by an automated search for contrast differences between the two ROIs throughout the entire record.
Animals
The method was developed in a male Rhesus monkey (Macaca mulatta; 8 kg). The animal was maintained under protected housing conditions with ad lib access to food and water. All experiments were performed in accordance with the National Institutes of Health’s Guide for the Care and Use of Laboratory Animals (Anonymous, 1996) and the United States Public Health Service Policy on Humane Care and Use of Laboratory Animals (amended 2002). The studies were approved by the Institutional Animal Care and Use Committee of Emory University. Prior to the other experiments, the monkey was trained to sit in a primate chair and to allow handling by the investigators.
Animal surgery
Under aseptic conditions and isoflurane anesthesia (1–3%), the animal was implanted with chronic epidural EEG electrodes which were positioned above the primary motor cortex (M1). EEG is not necessary for the implementation of the proposed video analysis method, but was used here to examine the correlation between eyelid closure and episodes of somnolence. The EEG electrodes and a connector allowing easy access to the EEG signals were affixed to the skull with dental acrylic. In addition, a metal head holder was embedded in the acrylic.
Video recording
The animal was seated in a primate chair with its head restrained. Before starting the recordings, a skin marking pen (Skin-Skribe, HMS, Naugatuck, CT USA) was used to apply removable dark dye on the right eyelid and surrounding areas. Images of the animal’s face were then obtained with a USB-webcam (Quickcam Pro 4000, Logitech, Fremont, CA) that was located in a fixed position, 20 cm away from the animal’s face. The video signals were stored to computer disk (17 fps, 320 × 240 pixels; Active Webcam - PY Software, Etobicoke, ON, Canada).
Video analysis
The video material was down-sampled to a rate of one frame per second. We found that this rate is sufficient for the analysis of eyelid-closure, and that the down-sampling step significantly enhances processing speed. All subsequent steps of the analysis utilized algorithms that were custom-written in MATLAB (Mathworks, Natick, MA).
As the first step of the frame-by-frame analysis, the outlines of the eyes were marked as polygons on a video frame in which the animal has its eyes fully open or fully closed. These polygons defined the two ROIs. The following analysis steps were repeated for each frame. The 8-bit color video frames were converted to 8-bit grayscale images and the distribution of pixel values in the two ROIs was estimated separately by dividing the 256 possible grayscale intensities into eight equal-sized bins (32 intensity values per bin).
To quantify periods of open or closed eyes, we computed a simple similarity metric, based on correlating the two distributions. The similarity between the distributions was assessed by calculating Pearson’s correlation coefficient for corresponding bin values of the two ROIs. On frames in which both eyelids are open, the ROIs are comprised of similar grayscale values, resulting in a positive coefficient of correlation (R), trending toward +1. In contrast, frames in which the eyelids are closed showed a high contrast between the unmarked lid and the marked lid, with R trending towards −1.
After all frames had been assigned an R value, two thresholds (T1, T2) were manually set to categorize the positions of the eye lids, based on the distribution of the R values. For this step, the R values were grouped into ten bins (bin width, 0.2). The user then inspected and characterized five example frames per bin and rated them according to three categories: ‘eyes open’, ‘eyes closed’ and ‘uncertain’. The probability distribution for each category as function of the binned R values was then displayed, allowing the user to define the thresholds between ‘closed’ and ‘uncertain’ (T1) and between ‘uncertain’ and ‘open’ states (T2). Using these thresholds, each frame of the entire record was rated as showing closed eyelids (a state labeled ‘−1’) for R < T1, open eyelids (‘+1’) for R > T2, or intermediate (‘0’) for T2 ≤ R ≤ T1.
To avoid misclassification of periods of transient eye closure or eye opening as true state changes, a frame’s ‘state’ value was changed from +1 or −1 to 0, if the non-zero values occurred for the duration of a single frame. Likewise, a frame was changed from a zero-value to either +1 or −1, if five or more of the surrounding frame values were +1 or −1, respectively. These two rules were applied in succession, so that transient inappropriate polarity changes of the state values (from +1 to −1 and vice versa) were corrected.
EEG recording and analysis
The EEG signals were filtered (1–70 Hz), amplified (X10,000) and sampled to computer disk (1902 programmable amplifier, Power1401 A/D converter, sampled at 250 Hz, Spike2, CED, Cambridge, UK). Video and EEG recordings were performed simultaneously and stored to the same computer, synchronized using the PC clock. For later off-line analysis, the EEG signal were digitally filtered with a 1–13 Hz passband (4th order Butterworth filter). The spectral power in this range of frequencies (encompassing the delta-, theta- and alpha bands of frequencies) is known to be strongly influenced by the state of wakefulness, with increased power corresponding to somnolence (Gottesmann et al., 1977). EEG power in this range was calculated by integrating power spectra that were computed with a 250-point Fourier transformation (Welch’s modified periodogram, Hamming window).
The relationship between the spectral power values of non-overlapping one-second segments of filtered EEG and the corresponding state values is shown in figure 4. The power values were calculated throughout the entire example record. For figure 4B, we statistically compared the integrated EEG power between segments corresponding to video frames with ‘+1’ or −1’ state values, using the non-parametric Mann-Whitney test.
Figure 4.
Relationship between EEG power and eyelid closure. A. Example of the relationship between the raw EEG (top trace), EEG power of the filtered EEG (1–13 Hz, middle trace), and the corresponding state values, as determined by the eyelid closure detection algorithm (bottom trace). Notice that the algorithm registers intervals of closed (open) eyes when the EEG power increases (decreases). B. Comparison of integrated EEG power values corresponding to ‘eyes open’ and ‘eyes closed’ states for the record shown in part A of the figure (based on 68 ‘eyes closed’ and 73 ‘eyes open’ frames). Shown are median power spectrum values (with 25th/75th percentiles), calculated from one-second segments of filtered EEG (1–13 Hz), each centered on the time when the corresponding video frames were taken. *, p < 0.001, Mann-Whitney test.
Results and Discussion
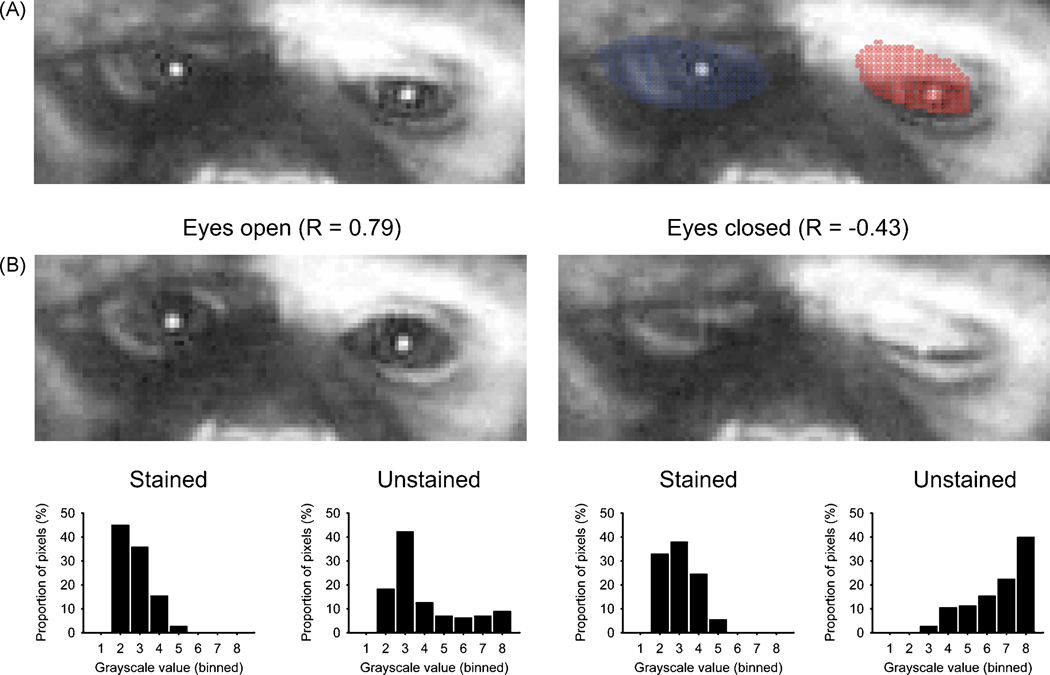
Figure 1 shows an example of the ROI analysis. The animal’s right eyelid was stained with a skin marker. Figure 1A shows the definition of ROIs in this animal, and figure 1B shows the results of ROI analysis of single frames. In the frame on the left of figure 1B, the animal’s eyes were fully open, resulting in very similar grayscale distributions of the pixels on the normal and the marked side (Fig. 1B, left side, bottom), and a high R-value (0.79). When the animal closed the eyelids (Fig. 1B, right side), the contrast between the two sides became apparent; and the grayscale distribution between the two ROIs differed considerably (Fig. 1B, right side, bottom). For this frame, the R value was substantially lower than before (R = −0.43).
Figure 1.
Examples of video frame analysis. A. ROI demarcation for a frame during which the monkey partially closed its eyes. The frames on the left and right side are identical except that the image on the right shows the ROI demarcation for the right and left orbital regions in blue and red colors, respectively. B. Computation of the similarity metric for video frames with open or closed eyes. Note the stained mark on the right eye lid and surrounding areas of skin which contrasts with the unstained skin of the lid on the left eye. The figure shows example video frames during times at which the animal’s eyes were open (left) or closed (right). The corresponding distributions of pixel brightness values are shown on the bottom. The distributions of pixel brightness values within the ROIs in the stained and unstained eyes were similar in the ‘eyes open’ frame (left), with a coefficient of correlation (R) of 0.79. In contrast, when the eyes were closed (right), the distributions of pixel brightness values differed between the ROIs, and R was −0.43.
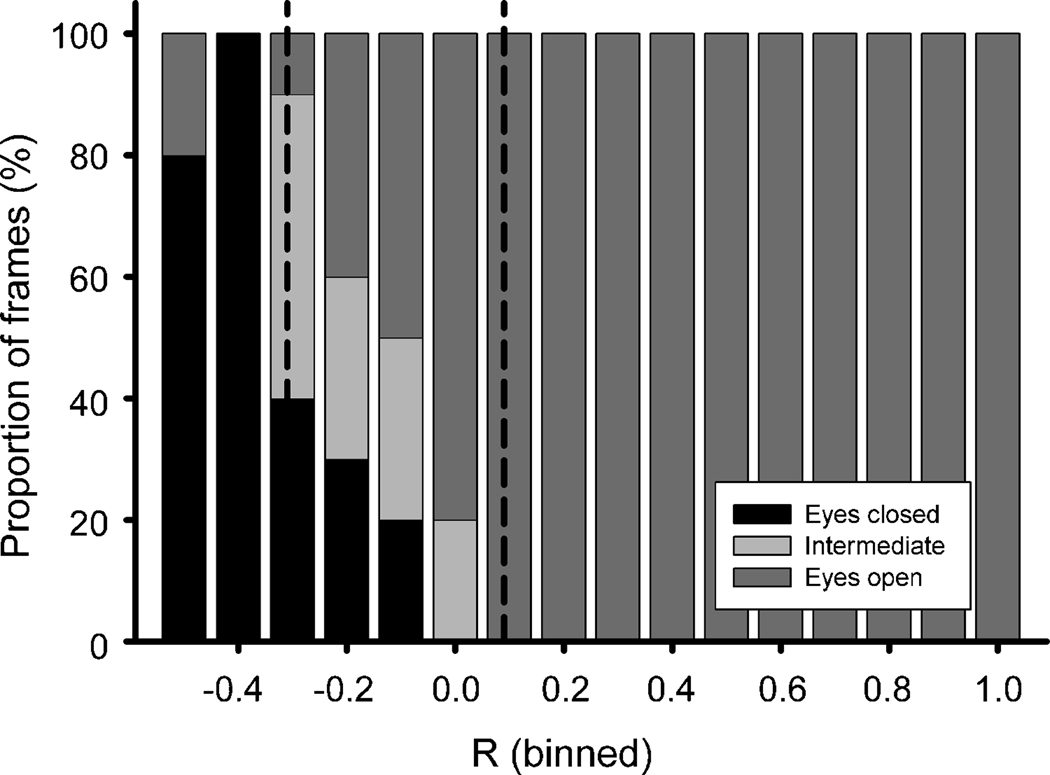
The overall relationship between R (binned in steps of 0.1) and the position of the eyelid is shown in figure 2. In this series of data, the T1 value was defined as −0.31, while the T2 value was determined as 0.09. The data shown in this figure were obtained by manually scoring each frame of the analysis as ‘eyes open’, ‘intermediate’, or ‘eyes closed’. This was done for validation purposes only. We found that the less labor-intensive method of binning the data into steps of 0.2, and examining 5 frames for each of bin is sufficient to determine T1 and T2 values in routine use. It should be noted that we did not encounter R values below −0.48 in this record. The figure shows that values below T1 are dominated by frames in which the animal had its eyes closed, while the animal had its eyes open in all frames with an R value above T2. The intermediate range of R values (between T1 and T2) was predominately found in frames in which the animal had its eyes partially open or closed, although some frames that were scored as ‘eyes open’ or ‘eyes closed’ also fell into this range of R-values (Fig. 2 and Fig. 3B), likely because of noise in the video signal due to the poor relatively low light conditions in the laboratory.
Figure 2.
Relationship between the coefficient of correlation (R) and the state of eyelid closure. This figure shows the distribution, in percent, of the number of frames with open eyes (dark grey), closed eyes (black) or intermediate states (light gray), as function of the corresponding R-values (binned in steps of 0.1). The two vertical lines show the manually set thresholds T1 and T2 (see text). For this segment of data, there were no frames with an R below −0.48.
Figure 3.
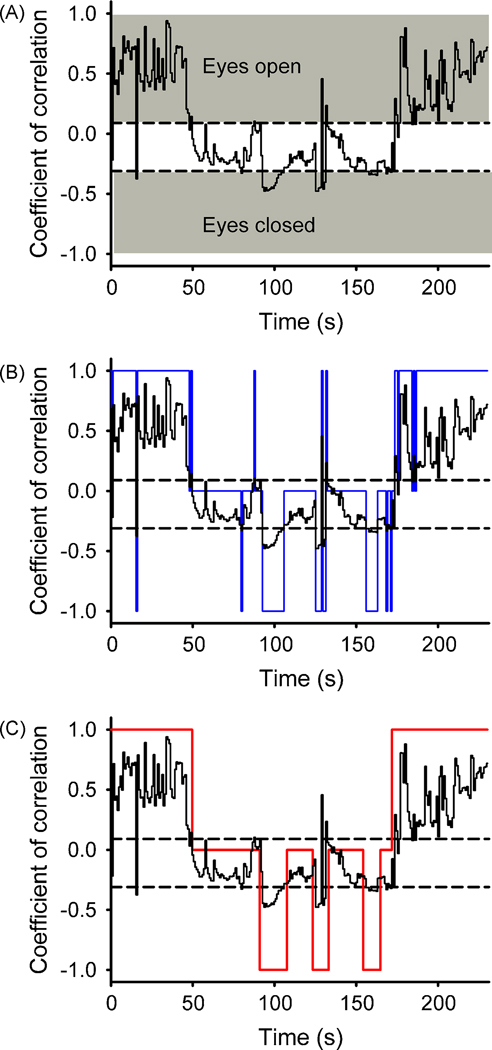
Analysis of coefficients of correlation (R), calculated between the two distributions of pixel brightness values for the stained and unstained eyelids. A. Raw coefficient of correlation values calculated from a 230-second segment of data. Two thresholds were defined by the user (dashed lines) to determine ranges of R-values that corresponded to open or closed eye lids (grey). B. Translation of R-values into state values (blue curve), i.e., 1 (eyes open), 0, (intermediate) or −1 (eyes closed). C. Smoothing of the series of state values (see Methods) to exclude episodes of transient eye closure or opening.
Figure 3 shows the transformation of the coefficient of correlation, shown as a black curve in Fig. 3 A–C, into state values. The first step of the algorithm (Fig. 3B) assigned the values −1, 0 or +1, based on the R value alone (in relation to T1, T2). Particularly in the middle portion of the record, this resulted in multiple brief steps between 0 and either −1 or +1, likely reflecting eye blinks or noise. These transients were eliminated in the second step of the analysis, aimed at smoothing the signal (Fig. 3C).
We found an obvious relationship between state changes assigned by the eyelid closure detection routine, and M1-EEG. In the example shown in figure 4A, the animal showed periods of high-frequency low-amplitude EEG at the beginning and the end of the record, corresponding to wakefulness, while periods of low-frequency high-amplitude EEG, indicative of somnolence, occurred in the middle of the record. Periods of the ‘−1’ state were often (but not always) associated with the occurrence of slow wave activity in the M1-EEG, while such synchronized slow-wave EEG activity was not observed during state ‘+1’. The statistical comparison in figure 4B shows that the spectral energy in the EEG signals in the 1–13 Hz range of frequencies was significantly higher in the ‘eyes closed’ (‘−1’) state than in the ‘eyes open’ (‘+1’) state (p < 0.001, Mann-Whitney test).
These observations and our general experience with this method suggest that the video analysis detects wakefulness more reliably than somnolence. This is intuitively understandable by the fact that the animal may close its eyes even during episodes of wakefulness, but is not likely to open its eyes while sleeping. This characteristic of the algorithm is acceptable for practical implementation because the primary interest in most recent experiments is the analysis of electrophysiological signals (e.g., coherence between subcortical and cortical structures) during natural states of wakefulness (e.g., Darbin and Wichmann, 2008).
Limitations
In its current form, the automated portion of the video analysis is relatively time consuming. Running on a dual-processor Pentium IV-class computer, approximately one second is required for the analysis of 40 frames (40 seconds). The processing speed would be substantially higher in faster multi-processor computers. As most of the processing time is used for video frame indexing in Matlab, the analysis method can likely be accelerated by more efficient methods of video access. Given the speed requirements, the analysis is currently implemented off-line. We have found it to be useful in order to select sections of brain recordings that reflect wakefulness. With improved processing speed it may be possible to determine episodes of wakefulness with much shorter delays (seconds), so that state-change specific experimental interventions could be initiated.
Acknowledgements
We thank Yuxian Ma and Xing Hu for expert technical assistance.
Grant support
This work was supported by National Institutes of Health Grants NS-054976 (TW), NS-042250 (TW), RR-000165 to the Yerkes National Primate Research Center and by IRACDA Grant 5K12 GM000680-07 (OS).
References
- Anonymous. Guide for the Care and Use of Laboratory Animals. Washington, D.C.: National Academy Press; 1996. [Google Scholar]
- Darbin O, Wichmann T. Effects of striatal GABA A-receptor blockade on striatal and cortical activity in monkeys. J Neurophysiol. 2008;99:1294–1305. doi: 10.1152/jn.01191.2007. [DOI] [PubMed] [Google Scholar]
- Gatev P, Wichmann T. Interactions between Cortical Rhythms and Spiking Activity of Single Basal Ganglia Neurons in the Normal and Parkinsonian State. Cereb Cortex. 2008 doi: 10.1093/cercor/bhn171. In press. [DOI] [PMC free article] [PubMed] [Google Scholar]
- Gatev PG, Wichmann T. Changes In Arousal Alter Neuronal Activity In Primate Basal Ganglia. Society for Neuroscience Abstracts. 2003;29 [Google Scholar]
- Gottesmann C, Kirkham PA, LaCoste G, Rodrigues L, Arnaud C. Automatic analysis of the sleep-waking cycle in the rat recorded by miniature telemetry. Brain Res. 1977;132:562–568. doi: 10.1016/0006-8993(77)90205-0. [DOI] [PubMed] [Google Scholar]
- Kaefer GPG, Weiss R. Wearable alertness monitoring for industrial applications. In: iswc, editor. Seventh IEEE International Symposium on Wearable Computers; 2003. pp. 254–255. [Google Scholar]
- Louis RP, Lee J, Stephenson R. Design and validation of a computer-based sleep-scoring algorithm. J Neurosci Methods. 2004;133:71–80. doi: 10.1016/j.jneumeth.2003.09.025. [DOI] [PubMed] [Google Scholar]
- Merica H, Fortune RD. State transitions between wake and sleep, and within the ultradian cycle, with focus on the link to neuronal activity. Sleep Med Rev. 2004;8:473–485. doi: 10.1016/j.smrv.2004.06.006. [DOI] [PubMed] [Google Scholar]


