Abstract
Hairpin nucleic acids are frequently used in physical studies due to their greater thermal stability compared to their equivalent duplex structures. They are also good models for more complex loop-containing structures such as quadruplexes, i-motifs, cruciforms, and molecular beacons. Although a connecting loop can increase stability, there is little information on how the loop influences the interactions of small molecules with attached base-paired nucleic acid regions. In this study, the effects of different hairpin loops on the interactions of A/T specific DNA minor groove binding agents with a common stem sequence have been investigated by spectroscopic and surface plasmon resonance (SPR) biosensor methods. The results indicate that the hairpin loop has little influence on the specific site interactions on the stem but significantly affects nonspecific binding. The use of a non-nucleotide loop (with a reduced negative charge) not only enhances the thermal stability of the hairpin but also reduces the non-specific binding at the loop without compromising the primary binding affinity on the stem.
Keywords: DNA hairpin loops, DNA – small molecule interactions, surface plasmon resonance biosensor, binding affinity
Introduction
Folded back loops are seen in many biological nucleic acid structures, including hairpins, cruciforms, triplexes, and quadruplexes. Extensive studies on the thermodynamics of nucleic acid loops have been conducted and the results have been applied to predict the thermal stability and folding energetics for both RNA and DNA.1-9 Most of the work done on nucleic acid loops has been primarily focused on RNA instead of DNA. Perhaps, this is due to many known RNA hairpin structures and their significant roles in biological systems. Another reason could be that while RNA loops can adopt rigid and ordered shapes, DNA loops tend to be less structured,10 and thus more difficult to study. Some work has been done on DNA loops to study their stability with various loops or stem sequences.1, 11-17 The influence of DNA loops on the interactions with small molecules, however, has received little attention. An appreciable number of cationic small molecules bind to nucleic acid oligomers with both specific-site binding and weaker non-specific bindings. For instance, DAPI, furamidine and related compounds can intercalate or stack in G/C rich DNA sequences besides their primary minor-groove binding mode in A/T rich sites.18,19
It is worth pointing out several potential applications from the studies of DNA loops. For example, the formation of G-rich structures with multiple loops at the telomere region into a quadruplex structure has recently drawn great interest.20,21 By controlling the quadruplex stability through groove binding, end stacking, or loop interaction by small molecules, potential control of gene expressions can be obtained. A similar approach is emerging by targeting the i-motif structure of the complementary C-rich strand. Other applications include designing nucleic acid aptamers or molecular beacon systems where the binding of small molecules to nucleic loops can play a critical role.22-24 There has been a recent increase in interest in small interfering nucleic acids (siRNA and siDNA), as well as riboswitches and DNA microarrays,25 and this highlights the need to study the interaction of nucleic acid loops with small molecules. Hairpin species are also particularly useful in surface methods, such as biosensors and microarrays, due to their added stability.
The goal of this work is to quantitatively investigate the effects of DNA and non-DNA loops on the interactions of DNA hairpin species with some small molecules. Results for well-known A/T specific DNA minor groove binders such as netropsin, DAPI, and berenil (Figure 1) are compared. All of the hairpin structures have the same primary binding site -GAATTC- but with different loops (Table 1). The extent of secondary interactions with different loops was monitored by biosensor studies.
Figure 1.
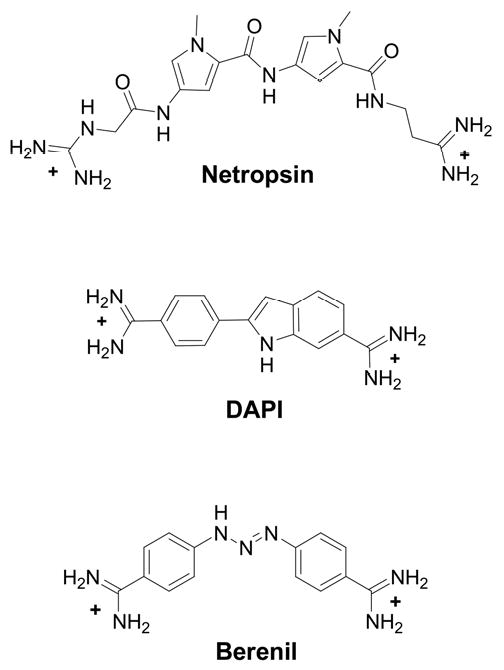
Chemical structures of three dicationic minor-groove binding compounds.
Table 1.
DNA hairpins with different loops used in SPR experiments.
| loop | Tm | |
|---|---|---|
| 5′-biotin-CGAATTCGTCTCCGAATTCG-3′ | TCTC | 66.0 |
| 5′-biotin-CGAATTCGTCTCTCCGAATTCG-3′ | TCTCTC | 64.2 |
| 5′-biotin-CGAATTCGPO3-(C2H4O)6CGAATTCG-3′ | 6-EG | 73.5 |
| 5′-biotin-CGAATTCG(PO3-C3H6O)3CGAATTCG-3′ | 3-P | 67.3 |
| 5′-biotin-CGAATTCG(PO3-C3H6O)4CGAATTCG-3′ | 4-P | 66.5 |
| 5′-biotin-CGAATTCG(PO3-C3H6O)5CGAATTCG-3′ | 5-P | 63.2 |
| 5′-biotin-CGAATTCG(PO3-C3H6O)6CGAATTCG-3′ | 6-P | 61.1 |
| 5′-biotin-CGAATTCG(PO3-C3H6O)7CGAATTCG-3′ | 7-P | 59.3 |
| 5′-biotin-GCGAATTCGCTCTCGCGAATTCGC-3′ | TCTC | 79.8 |
| 5′-biotin-GCGAATTCGCPO3-(C2H4O)6GCGAATTCGC-3′ | 6-EG | 83.6 |
Nucleotide and non-nucleotide loops are indicated in bold. At the same length (8 or 10 base pairs), the hairpin with a 6-EG loop has the highest melting temperature. The data were collected in MES buffer containing 92 mM NaCl. The thermal melting temperatures have an error of ±0.5 °C.
Experimental Methods
The compounds were purchased commercially and dissolved in water to approximately 1 mM concentration as determined with the following extinction coefficients: netropsin (ε296=23100 M-1 cm-1),26 DAPI (ε342=30600 M-1 cm-1), and berenil (ε370=34400 M-1 cm-1).27 The DNA hairpin concentrations were determined using the nearest neighbor model.28 The extinction coefficients (at 260 nm) for the singled-strand DNA oligomer at 25 °C are 153300 M-1cm-1 for 8-base-pair stem hairpins with a 6-EG, 3-P, 4-P, 5-P, 6-P, or 7-P loop (see Table 1 for hairpin sequences), 185700 M-1cm-1 for a TCTC and 201000 M-1cm-1 for a TCTCTC loop. For 10-base-pair stem hairpins, the values are 186300 M-1cm-1 and 216900 M-1cm-1 for the 6-EG and TCTC loops, respectively. All DNA oligomers were heated to 90 °C and rapidly chilled in an ice bath to increase hairpin formation and inhibit mismatched duplex formation. Thermal melting studies of DNA hairpins (1 μM hairpin) were conducted with a Cary 300 Bio spectrophotometer in MES buffer (92 mM NaCl, 10 mM 2-(N-Morpholino)ethanesulfonic acid (MES), 1 mM Na2EDTA, adjusted with a NaOH solution to pH 6.25). The absorbance at 260 nm was recorded at every 0.5 °C with a heat/cooling rate of 0.5 °C/min. Four ramps (heating/cooling alternating from 5 °C to 95 °C) were conducted and the thermal melting temperatures were reported from the averaged values of the first derivatives of the melting curves. These studies did not detect the presence of any duplex species. Circular dichroism spectra of the hairpins (averaged over 3 scans) were collected in the same buffer with a Jasco-810 spectrophotometer from 450 nm to 220 nm at a scan rate of 50 nm/min and a temperature of 25 °C. Because these DNA hairpins have different lengths/loops, the CD responses are normalized to molar ellipticity of hairpin concentration or base concentration.
Surface plasmon resonance: biosensor techniques have been widely used to study biomolecular interactions,29,30 including small molecule – nucleic acid interactions.31 A nucleic acid oligomer is immobilized on a sensor chip while a ligand of different concentrations is injected onto the chip. The 5′-biotin-labeled DNA hairpins with different loops were purchased from Integrated DNA Technologies (Coralville, IA) with IE HPLC purification. DNA immobilization on a streptavidin-derivatized gold chip (SA chip from BIAcore) was conducted by manual injection of 25 nM hairpin DNA solution with a flow rate of 1 μl/min until the response units reached about 450-500 RUs. Flow cell 1 was left blank while flow cells 2, 3, and 4 were immobilized with three different DNAs. The binding experiments were conducted with a Biacore instruments in degassed MES buffer with 0.0005% v/v surfactant P20 and 92 mM NaCl or 192 mM NaCl at 25 °C. The strong binding of netropsin and DAPI was conducted in 192 mM NaCl while berenil was conducted in 92 mM NaCl. The experiments were performed two to four times. The steady-state response at each concentration was converted to moles of ligand bound, r, by dividing the response by the predicted maximum-response per mole of bound ligand.32 The data was then fitted with a two-site or three-site model to obtain the observed binding constants: for two-site fits, K3 was set to be zero. While most of the data fit well with the two-site model, the three-site model offers an improved fit for some data:
| Eq. 1 |
For discussion purposes, some data was also fitted to obtain site binding constants K1* and K2* (assuming two classes of independent sites).
| Eq. 2 |
where L is the free ligand concentration in the flow solution. The stoichiometric or macroscopic binding constants (Ks) and site binding constants (K*s) are related by
| Eq. 3 |
| Eq. 4 |
When K1* ≫ K2*, K1 = K1* and K2 = K2*
Extensive discussions of binding models have been published,33-41 and a brief summary is included in the Appendix.
Results
On thermal stability and global conformation
Thermal melting studies indicate that the DNA hairpins have very different thermal stabilities. As shown in Table 1, although all 8-base pair stem hairpins have an identical stem sequence, the Tm values vary significantly (more than 10 °C) among the DNA hairpins. In general, the large loops (nucleotide loops or non-nucleotide loops) decrease the stability of the hairpin. A replacement of a TCTC loop with a TCTCTC loop reduces the thermal melting temperature by 2 °C. Similarly for non-nucleotide loops, the melting temperature decreases approximately 2 °C for every -PO3-C3H6O- group added from 4-P to 7-P (Table 1). The DNA hairpin with a hexa-ethylene glycol (6-EG) loop has the highest Tm value when compared to other DNA hairpins of the same length (Table 1). For two DNA hairpins with a 10-base pair stem, the same pattern was observed. The 6-EG loop hairpin has a higher Tm value than that of the hairpin with a TCTC loop (Table 1). Circular dichroism spectra of the 8-base pair hairpins appear to overlap almost completely suggesting that the loops have minimal effects on the stem structure and that stems retain their B-form conformation (Figure 2).
Figure 2.
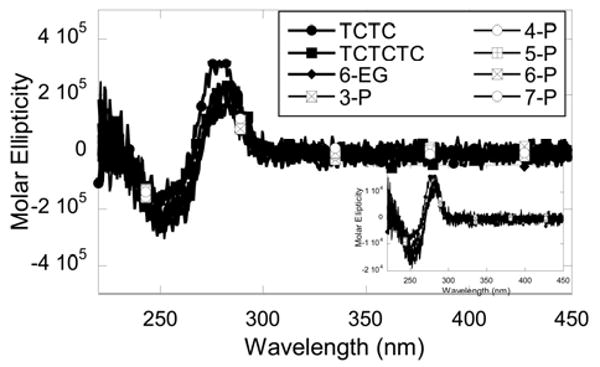
CD spectra of eight DNA hairpins with different loops normalized to hairpin concentrations. No significant difference in CD profiles was observed among different hairpins. The spectra were collected with 1 μM hairpin in MES buffer containing 92 mM NaCl at 25 °C. The inset the shows the same spectra with the molar ellipticity normalized to base concentrations.
Binding affinity by surface plasmon resonance
Crystal and solution structures for netropsin, berenil and DAPI complexes with the minor groove of a GAATTC site have been published,42-45 and the binding affinities for this sequence are strong, typically 107 - 108 M-1 for all three compounds.
Sensorgrams for the interaction of DAPI with a DNA hairpin containing a 6-nucleotide loop TCTCTC or a 4-nucleotide loop TCTC are shown in Figure 3. The SPR responses were normalized to the ligand/hairpin ratio for direct comparison of secondary binding at high concentrations. A higher steady-state response at high ligand concentrations (>1uM) was observed for a hairpin with a larger loop and a higher number of negative charges (TCTCTC versus TCTC). Similar trends were observed when nucleotide loops were replaced by non-nucleotide loops. Sensorgrams for the interaction of DAPI with the DNA hairpins containing non-nucleotide loops 3-P and 6-EG are shown in Figures 4A and 4B. The responses at high ligand concentrations are smallest for the 6-EG loop when compared to other loops and similar observations were obtained for berenil and netropsin.
Figure 3.
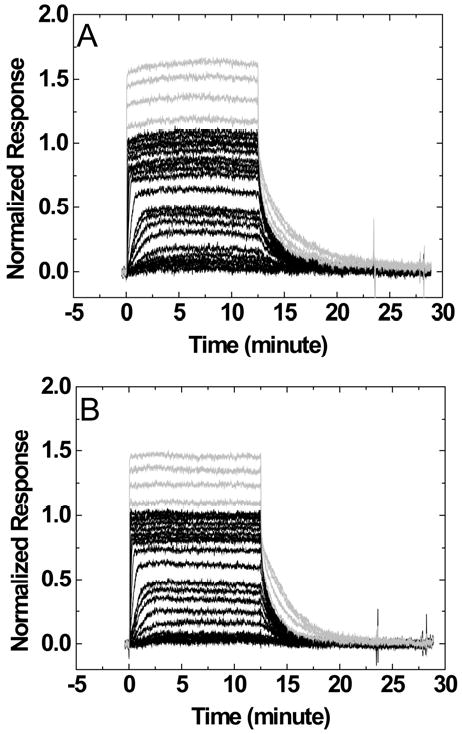
Sensorgrams for the interaction of DAPI with DNA hairpins containing a TCTCTC loop (A) or a TCTC loop (B). The ligand concentrations of the sensorgrams in black are from 0.1 nM to 1 uM while those in gray are 2, 4, 6, and 8 μM injections.
Figure 4.
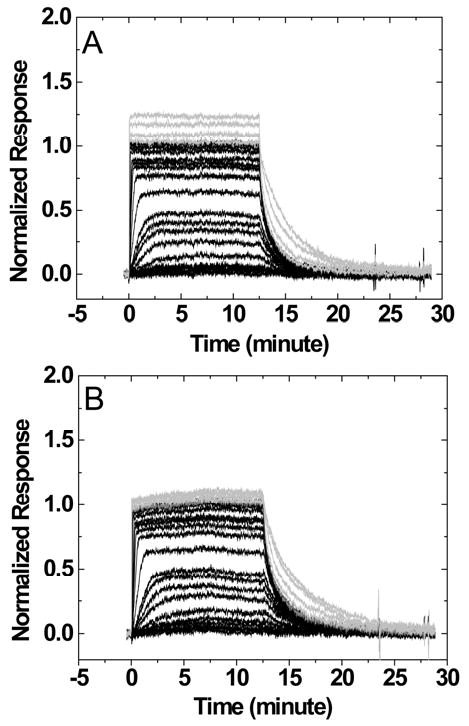
Sensorgrams for the interaction of DAPI with DNA hairpins containing a 3-P loop (A) or a 6-EG loop (B). The ligand concentrations of the sensorgrams are the same as those in Figure 3.
The binding plots of berenil to three DNAs with different loops were fitted without any assumption using Eq.1 (Figures 5A and 5B). The plots clearly indicate that the binding stoichiometry exceeds a 1:1 complex at higher ligand concentrations. A large nucleotide loop (TCTCTC versus TCTC) has a higher secondary response. Even for a DNA hairpin with a small loop (6-EG loop), the secondary binding was still detectable at high concentrations (Figure 5A). Similar trends were observed for the 5-P, 6-P and 7-P loops (Figure 5B). Figures 5C and D show the SPR results and the fits for DAPI with the same hairpins as those in Figures 5A and B. Again, higher responses were seen with higher numbers of negatively charged groups in the loops. Although the nonspecific binding was observed on all loops, the magnitude is significantly reduced for small non-nucleotide loops with the largest reduction for the 6-EG loop.
Figure 5.
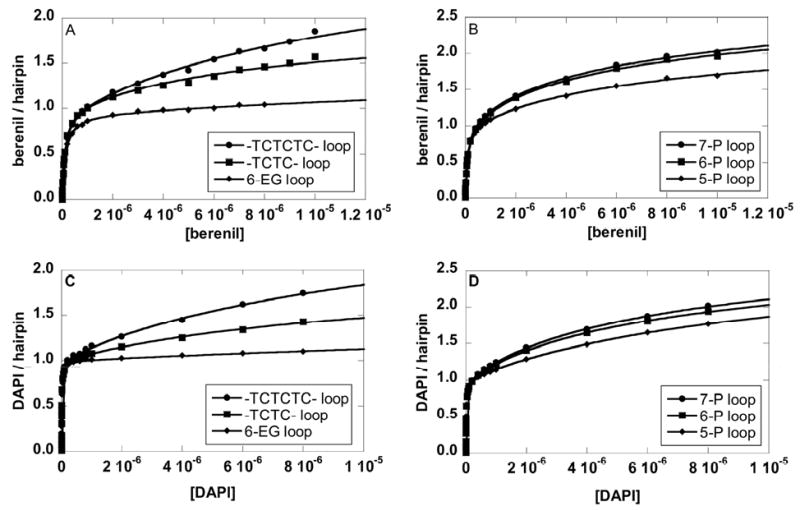
Binding isotherms of berenil to an 8-bp stem DNA hairpin with 6-EG, TCTC, or TCTCTC (A), with 5-P, 6-P or 7-P loops (B); and of DAPI (C and D) to the same hairpins. Salt concentrations were 92 mM NaCl and 192 mM NaCl for berenil and DAPI, respectively.
The primary and secondary binding constants of three ligands with different hairpin loop DNAs are shown in Table 2. In general, the primary binding constants are not affected by the different loops. They are essentially unchanged for DAPI and berenil. However, the effect on the longer ligand, netropsin, is small but noticeable. The binding constant of netropsin to the 8-base-pair stem hairpin containing the 6-EG loop is lower than that of the TCTC loop which in turn is lower than the larger loop TCTCTC. It appears that the binding affinity of a long DNA binder (such as netropsin) may be slightly sensitive to the loop charges. To investigate this effect, the primary binding of netropsin to a longer hairpin stem (10 base pairs – see Table 1) was measured. The extended stem should put the loop further away from the positively charged ends of netropsin. The binding profile of netropsin is shown in Figure 6, and the results are summarized in Table 2. The primary binding constants for netropsin to the 10 base-pair stem hairpins are the same for a TCTC loop and a 6-EG loop (Table 2). The results suggest that charged ends of a ligand can be electrostatically coupled with nearby base pairs (at least a three base pair length). Thus, when the hairpin stem length is sufficiently long, the loop charge has no effect on the primary binding.
Table 2.
The binding affinity of three ligands with DNA hairpins of different loops.
| Netropsina | DAPIa | Berenilb | ||||||
|---|---|---|---|---|---|---|---|---|
| K1 (×108) | K2 (×104) | K1 (×108) | K2 (×105) | K3 (×104) | K1 (×107) | K2 (×105) | K3 (×104) | |
| 6-EG | 3.0 | 0.72 | 0.87 | 0.19 | - | 1.1 | 0.46 | - |
| 3-P | 2.8 | 1.3 | 0.88 | 0.45 | - | 0.95 | 0.98 | - |
| 4-P | 3.1 | 0.79 | 1.1 | 0.78 | - | 0.96 | 0.73 | - |
| 5-P | 4.0 | 1.1 | 1.1 | 1.8 | 2.9 | 1.2 | 1.5 | 3.5 |
| 6-P | 3.3 | 1.7 | 1.0 | 3.0 | 4.2 | 0.89 | 1.3 | 8.8 |
| 7-P | 3.6 | 2.3 | 1.1 | 3.3 | 5.2 | 1.0 | 1.9 | 7.4 |
| TCTC | 3.6 | 1.1 | 1.0 | 1.3 | - | 1.1 | 1.2 | - |
| TCTCTC | 4.7 | 1.7 | 1.0 | 1.7 | 4.0 | 1.0 | 1.3 | 5.8 |
| 10bp stem | ||||||||
| TCTC | 5.0 | |||||||
| 6-EG | 4.7 | |||||||
The units are M-1. Equilibrium constants were determined in 10 mM MES, 1 mM EDTA, pH 6.25, 25 °C with 192 mM NaCl a or 92 mM NaCl.b The reported Ks are the average of 2 to 4 measurements; the errors of K1s are equal or less than 10% and greater for K2s and K3s (up to 60%).
Figure 6.
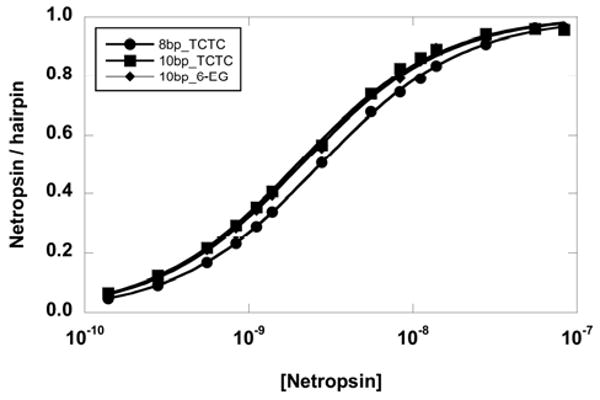
Binding isotherms of netropsin to three DNA hairpins. The primary binding affinity to a short 8-base-pair stem with a TCTC loop (5′CGAATTCGTCTCCGAATTCG-3′ or 8bp_TCTC) is lower than that of a 10-base-pair stem with the same loop (5′GCGAATTCGCTCTCGCGAATTCGC-3′ or 10bp_TCTC) or a 10-base-pair stem with a hexa-ethylene glycol loop (5′GCGAATTCGCPO3(C2H4O)6GCGAATTCGC-3′ or 10bp_6-EG).
Discussion
DNA hairpins that contain the same stem sequence but with different loops have been studied with three DNA minor groove binders. The connecting loops include both nucleotides and non-nucleotides. The Tm values in Table 1 are about ±2 °C from the predicted values for unfolding of hairpins using Mfold,7,46,47 DINAMelt,48 and UNAFold.49 In addition, at micromolar concentrations, a mismatched duplex (formed by hybridization of two single-stranded DNA oligomers) has a much lower Tm value (more than 20 °C lower) compared to that of a hairpin formed by one strand, and this duplex transition was not observed in the Tm curves. Thus, the DNA oligomers exist predominantly as hairpins. Stability results indicate that thermal melting temperatures vary widely with the different loops. The reduction in thermal stability of larger loops may arise from the entropic penalty of constraining the loop bases. Loops that are too short distort the stem base pairs and reduce stability. As the loop size increases, some optimum length is reached where the entropy loss due to restricted motion in the loop is smaller than the entropy gain from connecting the duplex strands. However, continued adding of groups to the loop causes a larger entropy loss due to additional restricted motion and this leads to a decrease in stability. This was observed for both nucleotide (TCTC and TCTCTC) and non-nucleotide (3-P to 7-P) loops.
The thermal melting results also indicated that a hairpin with a 6-EG loop has the highest thermal melting temperature. This non-nucleotide loop has a length that is considerably shorter than all others, equivalent to a length of 3 nucleotides. A NMR study comparing a three nucleotide loop (TTT) to a four nucleotide loop (TTTT) suggested that the TTT loop reduces the flexibility of the loop-closing base pair (loop-stem junction).15 In addition to the lack of bases, this 6-EG loop has only one negatively charged phosphate group as opposed to three or more in 3-P to 7-P loops. This reduced negative charge may help in reducing electrostatic repulsion at the ends, and thereby reducing distortion. The enhanced Tm value of the 6-EG loop was consistently observed for both 8-base pair and 10-base pair hairpin stems (Table 1). Thus, this loop can be used to substitute for nucleotide loops to enhance the hairpin DNA thermal stability while reduced stacking surface and negative charges. The hexa-ethylene glycol fragment has been previously employed with RNA.50,51 Insertion of this fragment at the 3′ end of a 7-nucleotide RNA loop decreases the thermal melting temperature when compared to an 8-nucleotide loop.50 In addition to the difference between DNA and RNA loops, as mentioned earlier, no mixed loops were investigated in this work, and thus no direct conclusion can be reached.
The binding studies between the hairpins and three DNA minor groove binders were conducted to investigate the effect of the loops on the interaction. In every case there was a strong, primary binding (K = 107 – 108 M-1) that is expected for these compounds at an AATT site. A much weaker, secondary binding was also observed with the compounds and most of the DNA hairpins. The results also indicate that although the hairpin loops have different sizes and charges, there is a minimal effect on the primary binding constants of the ligand and the hairpin stem. Secondary bindings are much smaller in magnitude and they are significantly influenced by different loops. The secondary bindings are greater with larger loops or higher negatively charged loops. It has been long suggested that weak nonspecific bindings of cationic small molecules to nucleic acid oligomers arise primarily from electrostatic interactions along the negatively charged phosphate backbone. The results presented above clearly confirm that the nonspecific binding has a major electrostatic component as well as compound interactions with bases in the loop. The secondary bindings are sensitive to the loop properties such as the number of negative charges and the loop size. The effects progressively increase with larger and more negatively charged loops. The results indicate that the loop can be a significant component of weak secondary interactions. Interestingly, it has also been found that the neutral intercalator, actinomycin D, can cause some single-stranded DNAs to fold into hairpins with the actinomycin peptide substituents interacting with the hairpin loops.52
Comparison of the primary binding constants of netropsin with four hairpins (an 8-base-pair TCTC loop (8bp_TCTC), an 8-base-pair 6-EG loop (8bp_6-EG), a 10-base-pair TCTC loop (10bp_TCTC), and a 10-base-pair 6-EG loop (10bp_6-EG)), allows two important points to be drawn. First, when the loop is relatively close to the binding site (for the 8bp_TCTC and 8bp_6-EG hairpins), the primary binding is influenced by the loop charge and weaker binding is observed with a lower charged 6-EG loop. Second, when longer hairpin stems are used (10bp_TCTC and 10bp_6-EG) and the binding site is moved away from the loop, the difference in primary binding affinity is negligible. Therefore, in the design of hairpin loops, the loop should be placed away from the positively charged ligand end and yet not so far away that other binding sites are undesirably introduced. An appropriate loop length with a low steric hindrance with the capping base pair, neutral, and a small stacking surface not only increases the thermal stability but also reduces non-specific bindings. Consequently, the reduction of non-specific bindings (K1*≫K2*) helps to obtain an accurate specific site binding constant (K1 = K1*). The results in Figure 6 and Table 2 also indicate that the binding constant of netropsin to the 10-base-pair-stem hairpin is significantly higher than that of the 8-base-pair-stem hairpin containing the same loop. This could be the result of Coulombic end effects discussed from the work of Record and collaborators.53-56 The binding free energy of oligocationic ligands to an oligoanion is favored at the middle of the oligoanion and increases with the oligoanion length to some extent. All of the compounds investigated contain a conjugated aromatic system and the weak binding in the loop region may involve stacking of the aromatic surface with the terminal base pair that connects the loop. The loop stacking and electrostatic interactions would stabilize such a complex as is frequently seen with planar aromatic compounds binding to DNA quadruplexes.57
The results in Figures 4 and 5 also indicate that there are two distinctive classes of sites: a strong primary site for 1:1 binding in the minor groove and lower affinity site(s) in the loop region. Assuming that these two classes of sites are essentially independent, the results were also fitted with Eq. 2 to obtain the site binding constants. An example of the two fits (by Eq. 1 and Eq. 2) is shown in Figure 7 for DAPI binding to a hairpin containing a TCTC loop. The two fits are overlapped, and the out-put binding constants are essentially the same. The results agree with the predicted relationship from Eq. 4 with K1 practically equal to K1*. Without fitting, the site binding constants K1* and K2* can also be calculated from Eq. 3 and Eq. 4. This illustrates that as long as the DNA contains one specific site with a high affinity (GAATTC, for example), Eq. 1 can be used to fit the data to obtain the macroscopic binding constant K1 that is practically the same as the binding affinity to that site (K1*), provided that secondary bindings are negligible and the sites are independent. Similar observations were seen with berenil and netropsin where K1 is much greater than K2 (Table 2). It should be noted also that with these compounds the smallest secondary binding was obtained with the 6-EG hairpin sample with eight base pairs, four base pairs in addition to the AATT site. This observation suggests that duplex secondary binding away from the AATT groove binding site is quite weak under these conditions. In longer duplexes or duplexes without a strong AT minor groove binding site, however, a weak secondary, intercalation binding mode has been observed with some heterocyclic cations such as DAPI58.
Figure 7.
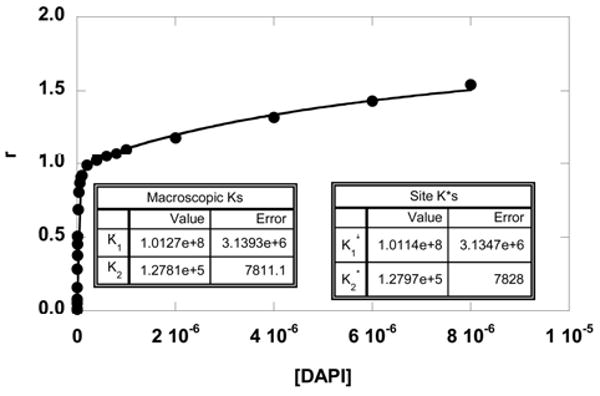
Fittings of the SPR binding results of DAPI with an 8-bp stem DNA hairpin containing a TCTC loop. The data were fitted with a two-site model using Eq. 1 or Eq. 2. The two fitting curves overlap on top of each other, and the fitted parameters illustrate the relationship: K1= (K1*+K2*) and K2 = (K1*×K2*)/(K1*+K2*). The macroscopic binding constants are practically the same as the site binding constants (K1=K1*). This is expected since K1* is much greater than K2*.
It is interesting that the dissociation phase on sensorgrams at high ligand concentrations appears to be slightly slower (Figures 3 and 4) than that at low ligand concentrations. A possible explanation for this behavior is that secondary ligand binding causes a change in duplex-ligand structure that gives a more favorable minor groove complex with a slower off rate. In other words, part of the secondary binding energetics induces a conformational change that affects the bound duplex minor groove complex.
Conclusions
Non-specific binding of small cationic molecules to DNA loops can be reduced by replacing a DNA loop with a non-DNA loop without disturbing the primary binding site. The thermal melting, circular dichroism, and biosensor surface plasmon resonance experiments indicate that the replacement of a nucleotide loop with a non-nucleotide loop such as a hexa-ethylene glycol or 3-P can significantly reduce secondary binding effects. The 6-EG loop enhances the stem thermal stability and significantly reduces secondary binding of cationic molecules. The results also indicate that the loop is a primary source of much weaker secondary interactions for cationic ligands. While the thermal stability of longer loops is reduced, the secondary interaction is enhanced due to the increased electrostatic interactions.
Acknowledgments
Financial support from the National Institutes of Health (Grant AI064200) is gratefully acknowledged. The Biacore instruments were funded in part by the Georgia Research Alliance.
Appendix
For a system of a ligand (L) binding to two sites on a macromolecule (M), the ratio r of bound ligand to total macromolecule concentration can be expressed in terms of free ligand concentration [L] and the macroscopic binding constants K or site binding constants K*.33-40
Macroscopic step-wise binding constants
| Eq. A1 |
Site binding constants
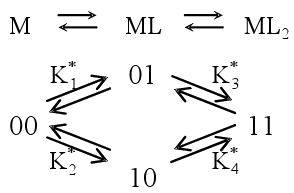
|
Eq. A2 |
Interaction factor
Relationship between macroscopic and site binding constants
If the two sites are independent (ω = 1),
Substitute into Eq. A1
Similar results if ω= 1 is substituted into Eq. A2
If the two sites are identical ,
(ω can be evaluated from the ratio of Ks)
Eq. A2 becomes
References
- 1.SantaLucia J, Jr, Hicks D. Annu Rev Biophys Biomol Struct. 2004;33:415. doi: 10.1146/annurev.biophys.32.110601.141800. [DOI] [PubMed] [Google Scholar]
- 2.Zuker M. Science. 1989;244:48. doi: 10.1126/science.2468181. [DOI] [PubMed] [Google Scholar]
- 3.Jaeger JA, Turner DH, Zuker M. Proc Natl Acad Sci U S A. 1989;86:7706. doi: 10.1073/pnas.86.20.7706. [DOI] [PMC free article] [PubMed] [Google Scholar]
- 4.Zuker M, Jaeger JA, Turner DH. Nucleic Acids Res. 1991;19:2707. doi: 10.1093/nar/19.10.2707. [DOI] [PMC free article] [PubMed] [Google Scholar]
- 5.SantaLucia J, Jr, Turner DH. Biopolymers. 1997;44:309. doi: 10.1002/(SICI)1097-0282(1997)44:3<309::AID-BIP8>3.0.CO;2-Z. [DOI] [PubMed] [Google Scholar]
- 6.Xia T, SantaLucia J, Jr, Burkard ME, Kierzek R, Schroeder SJ, Jiao X, Cox C, Turner DH. Biochemistry. 1998;37:14719. doi: 10.1021/bi9809425. [DOI] [PubMed] [Google Scholar]
- 7.Mathews DH, Sabina J, Zuker M, Turner DH. J Mol Biol. 1999;288:911. doi: 10.1006/jmbi.1999.2700. [DOI] [PubMed] [Google Scholar]
- 8.Yildirim I, Turner DH. Biochemistry. 2005;44:13225. doi: 10.1021/bi051236o. [DOI] [PMC free article] [PubMed] [Google Scholar]
- 9.Mathews DH, Turner DH. Curr Opin Struct Biol. 2006;16:270. doi: 10.1016/j.sbi.2006.05.010. [DOI] [PubMed] [Google Scholar]
- 10.James JK, Tinoco I., Jr Nucleic Acids Res. 1993;21:3287. doi: 10.1093/nar/21.14.3287. [DOI] [PMC free article] [PubMed] [Google Scholar]
- 11.Riccelli PV, Mandell KE, Benight AS. Nucleic Acids Res. 2002;30:4088. doi: 10.1093/nar/gkf514. [DOI] [PMC free article] [PubMed] [Google Scholar]
- 12.Paner TM, Amaratunga M, Doktycz MJ, Benight AS. Biopolymers. 1990;29:1715. doi: 10.1002/bip.360291405. [DOI] [PubMed] [Google Scholar]
- 13.Amaratunga M, Snowden-Ifft E, Wemmer DE, Benight AS. Biopolymers. 1992;32:865. doi: 10.1002/bip.360320713. [DOI] [PubMed] [Google Scholar]
- 14.Paner TM, Amaratunga M, Benight AS. Biopolymers. 1992;32:881. doi: 10.1002/bip.360320714. [DOI] [PubMed] [Google Scholar]
- 15.Baxter SM, Greizerstein MB, Kushlan DM, Ashley GW. Biochemistry. 1993;32:8702. doi: 10.1021/bi00084a042. [DOI] [PubMed] [Google Scholar]
- 16.Paner TM, Riccelli PV, Owczarzy R, Benight AS. Biopolymers. 1996;39:779. doi: 10.1002/(SICI)1097-0282(199612)39:6%3C779::AID-BIP5%3E3.0.CO;2-S. [DOI] [PubMed] [Google Scholar]
- 17.Vallone PM, Paner TM, Hilario J, Lane MJ, Faldasz BD, Benight AS. Biopolymers. 1999;50:425. doi: 10.1002/(SICI)1097-0282(19991005)50:4<425::AID-BIP8>3.0.CO;2-B. [DOI] [PubMed] [Google Scholar]
- 18.Laughton CA, Tanious F, Nunn CM, Boykin DW, Wilson WD, Neidle S. Biochemistry. 1996;35:5655. doi: 10.1021/bi952162r. [DOI] [PubMed] [Google Scholar]
- 19.Wilson WD, Tanious FA, Barton HJ, Jones RL, Fox K, Wydra RL, Strekowski L. Biochemistry. 1990;29:8452. doi: 10.1021/bi00488a036. [DOI] [PubMed] [Google Scholar]
- 20.Neidle S, Parkinson G. Nat Rev Drug Discov. 2002;1:383. doi: 10.1038/nrd793. [DOI] [PubMed] [Google Scholar]
- 21.Rezler EM, Bearss DJ, Hurley LH. Curr Opin Pharmacol. 2002;2:415. doi: 10.1016/s1471-4892(02)00182-0. [DOI] [PubMed] [Google Scholar]
- 22.Hermann T, Patel DJ. Science. 2000;287:820. doi: 10.1126/science.287.5454.820. [DOI] [PubMed] [Google Scholar]
- 23.Tan W, Wang K, Drake TJ. Curr Opin Chem Biol. 2004;8:547. doi: 10.1016/j.cbpa.2004.08.010. [DOI] [PubMed] [Google Scholar]
- 24.Mairal T, Cengiz Ozalp V, Lozano Sanchez P, Mir M, Katakis I, O'Sullivan CK. Anal Bioanal Chem. 2008;390:989. doi: 10.1007/s00216-007-1346-4. [DOI] [PubMed] [Google Scholar]
- 25.Tse WC, Boger DL. Acc Chem Res. 2004;37:61. doi: 10.1021/ar030113y. [DOI] [PubMed] [Google Scholar]
- 26.Nguyen B, Tanious FA, Wilson WD. Methods. 2007;42:150. doi: 10.1016/j.ymeth.2006.09.009. [DOI] [PubMed] [Google Scholar]
- 27.Rosu F, Gabelica V, Houssier C, De Pauw E. Nucleic Acids Res. 2002;30:e82. doi: 10.1093/nar/gnf081. [DOI] [PMC free article] [PubMed] [Google Scholar]
- 28.Handbook of Biochemistry and Molecular Biology: Nucleic Acids. 3rd. Vol. 1 CRC Press; Cleveland: 1975. [Google Scholar]
- 29.Schuck P. Annu Rev Biophys Biomol Struct. 1997;26:541. doi: 10.1146/annurev.biophys.26.1.541. [DOI] [PubMed] [Google Scholar]
- 30.Day YS, Baird CL, Rich RL, Myszka DG. Protein Sci. 2002;11:1017. doi: 10.1110/ps.4330102. [DOI] [PMC free article] [PubMed] [Google Scholar]
- 31.Tanious FA, Nguyen B, Wilson WD. Methods Cell Biol. 2008;84:53. doi: 10.1016/S0091-679X(07)84003-9. [DOI] [PubMed] [Google Scholar]
- 32.Davis TM, Wilson WD. Anal Biochem. 2000;284:348. doi: 10.1006/abio.2000.4726. [DOI] [PubMed] [Google Scholar]
- 33.Adair GS, Bock AV, Field H., Jr J Biol Chem. 1925;63:529. [Google Scholar]
- 34.Weber G. The Binding of Small Molecules to Proteins. In: Pullman B, Weissbluth M, editors. Molecular Biophysics. Academic Press; New York, NY: 1964. p. 369. [Google Scholar]
- 35.Weber G. Protein Interactions. Chapman and Hall; New York, NY USA: 1992. [Google Scholar]
- 36.Connors KA. Binding Constants: The Measurement of Molecular Complex Stability. Wiley-Interscience; New York, NY USA: 1987. [Google Scholar]
- 37.Wyman J, Gill SJ. Binding and Linkage: Functional Chemistry of Biological Macromolecules. University Science Books; Mill Valley, CA USA: 1990. [Google Scholar]
- 38.Winzor DJ, Sawyer WH. Quantitative Characterization of Ligand Binding. Wiley-Liss; New York, NY USA: 1995. [Google Scholar]
- 39.Klotz IM. Ligand-Receptor Energetics: A Guide for the Perplexed. John Wiley & Sons, Inc; New York: 1997. [Google Scholar]
- 40.Di Cera E. Thermodynamic Theory of Site-Specific Binding Processes in Biological Macromolecules. Cambridge University Press; New York, NY USA: 2005. [Google Scholar]
- 41.Chaires JB. Methods Enzymol. 2001;340:3. doi: 10.1016/s0076-6879(01)40415-0. [DOI] [PubMed] [Google Scholar]
- 42.Patel DJ. Proc Natl Acad Sci U S A. 1982;79:6424. doi: 10.1073/pnas.79.21.6424. [DOI] [PMC free article] [PubMed] [Google Scholar]
- 43.Kopka ML, Yoon C, Goodsell D, Pjura P, Dickerson RE. J Mol Biol. 1985;183:553. doi: 10.1016/0022-2836(85)90171-8. [DOI] [PubMed] [Google Scholar]
- 44.Kopka ML, Yoon C, Goodsell D, Pjura P, Dickerson RE. Proc Natl Acad Sci U S A. 1985;82:1376. doi: 10.1073/pnas.82.5.1376. [DOI] [PMC free article] [PubMed] [Google Scholar]
- 45.Brown DG, Sanderson MR, Skelly JV, Jenkins TC, Brown T, Garman E, Stuart DI, Neidle S. Embo J. 1990;9:1329. doi: 10.1002/j.1460-2075.1990.tb08242.x. [DOI] [PMC free article] [PubMed] [Google Scholar]
- 46.Zuker M. Nucleic Acids Res. 2003;31:3406. doi: 10.1093/nar/gkg595. [DOI] [PMC free article] [PubMed] [Google Scholar]
- 47.SantaLucia J., Jr Proc Natl Acad Sci U S A. 1998;95:1460. doi: 10.1073/pnas.95.4.1460. [DOI] [PMC free article] [PubMed] [Google Scholar]
- 48.Markham NR, Zuker M. Nucleic Acids Res. 2005;33:W577. doi: 10.1093/nar/gki591. [DOI] [PMC free article] [PubMed] [Google Scholar]
- 49.Markham NR, Zuker M. Methods Mol Biol. 2008;453:3. doi: 10.1007/978-1-60327-429-6_1. [DOI] [PubMed] [Google Scholar]
- 50.Williams DJ, Hall KB. Biochemistry. 1996;35:14665. doi: 10.1021/bi961654g. [DOI] [PubMed] [Google Scholar]
- 51.Williams DJ, Hall KB. J Mol Biol. 1996;257:265. doi: 10.1006/jmbi.1996.0161. [DOI] [PubMed] [Google Scholar]
- 52.Wadkins RM, Tung CS, Vallone PM, Benight AS. Arch Biochem Biophys. 2000;384:199. doi: 10.1006/abbi.2000.2113. [DOI] [PubMed] [Google Scholar]
- 53.Zhang W, Bond JP, Anderson CF, Lohman TM, Record MT., Jr Proc Natl Acad Sci U S A. 1996;93:2511. doi: 10.1073/pnas.93.6.2511. [DOI] [PMC free article] [PubMed] [Google Scholar]
- 54.Zhang W, Ni H, Capp MW, Anderson CF, Lohman TM, Record MT., Jr Biophys J. 1999;76:1008. doi: 10.1016/S0006-3495(99)77265-6. [DOI] [PMC free article] [PubMed] [Google Scholar]
- 55.Ballin JD, Shkel IA, Record MT., Jr Nucleic Acids Res. 2004;32:3271. doi: 10.1093/nar/gkh646. [DOI] [PMC free article] [PubMed] [Google Scholar]
- 56.Shkel IA, Ballin JD, Record MT., Jr Biochemistry. 2006;45:8411. doi: 10.1021/bi0520434. [DOI] [PubMed] [Google Scholar]
- 57.White EW, Tanious F, Ismail MA, Reszka AP, Neidle S, Boykin DW, Wilson WD. Biophys Chem. 2007;126:140. doi: 10.1016/j.bpc.2006.06.006. [DOI] [PubMed] [Google Scholar]
- 58.Wilson WD, Tanious FA, Ding D, Kumar A, Boykin DW, Colson P, Houssier C, Bailly C. J Am Chem Soc. 1998;120:10310. [Google Scholar]


