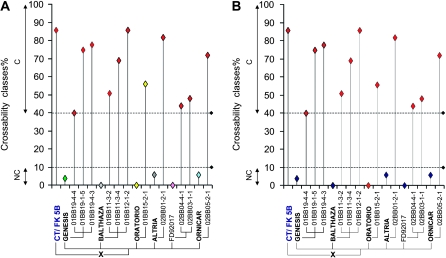
Figure 6.—
Graphical representation of the phenotypes and genotypes for all parents and progenies of the different crosses with Ct(FK 5B). (A) Genotyping with the cfb306 marker. (B) Genotyping with the cfb341 marker. The crossability ratio (in %) is represented on the Y-axis, whereas the parental lines and the crossable BC2 progenies identified from each cross are indicated on the X-axis. The colored dots represent the different alleles for a given marker.

