Abstract
Variation of gene length imposes a challenge on genes requiring coexpression. Using a large human protein complex data set, we show that genes encoding subunits of the same protein complex tend to have similar length. The length uniformity is greater for complexes with stronger coexpression. We also show that the rate of gene length evolution is associated with gene coexpression level within a complex. These results suggest a new angle in understanding the evolution of protein complexes as well as the regulation of gene coexpression.
PROTEINS interact with each other in complexes that serve as functional units. One of the most striking examples of this is the ribosome, composed of hundreds of proteins. To achieve economic and efficient assembly of a protein complex, expression of its different subunits should be coupled (Warner 1999). Furthermore, the dosage imbalance caused by uncoordinated expression of subunits of a complex can be toxic to cells in a variety of ways (Abruzzi et al. 2002; Gehlert et al. 2007; Veitia et al. 2008). Therefore, evolution is expected to have shaped the regulation of genes to ensure coexpression of protein subunits. Indeed, genes encoding subunits of many protein complexes are coordinately expressed both spatially and temporally (Walhout et al. 2002; Liu et al. 2009; van Waveren and Moraes 2008).
Attempts to understand the molecular basis of gene coexpression have focused mainly on shared sequences in their regulatory regions (Ihmels et al. 2005; Brown et al. 2007; Chawade et al. 2007; Etchberger et al. 2007); many overrepresented motifs with important functional implications have been computationally identified, and some were experimentally confirmed to be causal motifs driving gene coexpression (Ihmels et al. 2005). In addition, human genes encoding interacted proteins tend to share micro-RNA target sites (Liang and Li 2007), suggesting coregulation of the stability of their mRNA. Furthermore, expression levels can be modified by varying gene copy number through either gene duplication or gene deletion, and genes belonging to the same protein complex tend to duplicate together, revealing another strategy of maintaining gene coexpression (Papp et al. 2003; Qian and Zhang 2008).
Eukaryotic genes can be hundreds of kilobase pairs in length. With a transcription rate of ∼20 nucleotides per second (Ucker and Yamamoto 1984; Izban and Luse 1992), the time of completion of transcription can be significant. In the human genome, the distribution of gene length is heterogeneous: the average length difference between two random human genes is 54 ± 1 kb, which means that the time it takes to transcribe them can differ by ∼45 min. This may impose a great challenge for genes requiring coexpression. We hypothesize that natural selection has acted to reduce the length variation of human genes encoding subunits of the same protein complex to achieve their coregulation.
RESULTS
Genes encoding subunits of a protein complex have similar length:
Data on protein complexes in humans were downloaded from MIPS (Mewes et al. 2008). Proteins present in more than one complex were considered only in the largest complex. Small complexes (<10 subunits) were not considered because previous studies found that the coexpression pattern (Liu et al. 2009) and the requirement for dosage balance (Yang et al. 2003) are most important for large protein complexes. In addition, we excluded all young duplicates (dS < 1) that are present in the same complexes because young duplicates tend to interact with each other (Wagner 2001; He and Zhang 2005) and have similar gene length (our main results remain largely the same when all detectable duplicates were excluded; see supporting information, Figure S1). There are 26 large protein complexes encoded by 729 genes that were analyzed. We calculated the combined normalized length variation (CNLV) for the 26 complexes, using the formula
 |
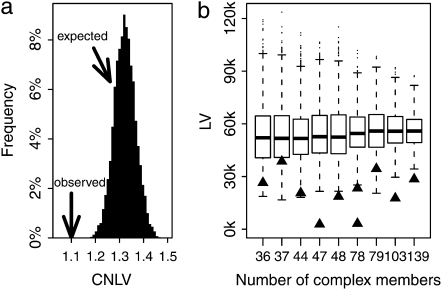
where Leni is a vector storing the length of all genes encoding complex i. The standard deviation of Len [or length variation (LV) of a complex] was normalized by dividing the mean of the vector to make the LVs of different complexes comparable. We then randomly assigned the 729 genes to a complex while keeping the size of each complex unchanged to estimate the CNLV expected by chance. This simulation was conducted 10,000 times, and the observed CNLV is significantly (P < 0.0001) smaller than expectations (Figure 1a). The same is true when small complexes (<10 subunits) were included in the analysis (data not shown). The signal is not contributed by only a small proportion of complexes; it is a general feature for a human protein complex in which the genes involved tend to have similar length. Figure 1b shows the observed and expected LV for the 10 largest complexes. In all 10 cases, the observed LV is smaller than the mean of expected LVs; 6 of 10 show a significant difference between the observed and expected LVs (P < 0.0001).
Figure 1.—
Genes encoding subunits of a protein complex tend to have similar length. (a) The observed combined normalized length variation (CNLV) of the 26 human protein complexes is significantly (P < 0.0001) smaller than expected by chance. (b) Box-and-whiskers plot shows the expected length variation (LV) of the 10 largest protein complexes, respectively. For each complex, 10,000 simulations were carried out to estimate the expected LV. The central thick line shows the median of the 10,000 LVs; the box contains the 50% of data points that are closest to the median, and the region between two horizontal lines contains the 90% of data points that are closest to the median. The observed LV of each complex is marked by a solid triangle.
Complexes with smaller LV have stronger coexpression:
We obtained 16 human gene expression data sets from GEO (http://www.ncbi.nlm.nih.gov/projects/geo/), from which 59 time-course expression profiles, each with 3–17 time points, were extracted for further analyses (details of the 59 expression profiles are in Table S1). We examined the level of coexpression of a protein complex by calculating its mean expression similarity (MES). Specifically, Pearson correlation coefficients (Pcc) of all gene pairs of a complex were computed using each of the 59 expression profiles. The mean of 59 average per-gene pair Pcc was taken as the MES of the complex, as illustrated in the formula
 |
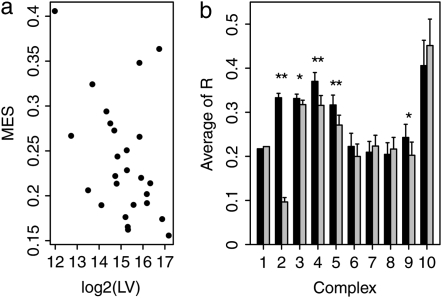
where Rhok(i, j) denotes the Pcc between gene i and gene j in expression profile k, and n is the total number of genes in the complex. Consistent with previous observations (Liu et al. 2009), the average MES of the 26 protein complexes is 0.24, which is significantly (P < 0.0001) higher than expected (0.15 ± 0.01, determined by randomly reshuffling complex membership of the 729 genes). We discovered a significant negative correlation between the MES of a complex and its LV (Rho = −0.42, P < 0.05, n = 26, Spearman's rank correlation; Figure 2a), highlighting the potential role of LV in explaining the variation of coexpression levels between complexes. To examine the effect of gene length on gene coexpression within a complex, we separated gene pairs within each protein complex equally into two groups according to their length differences and compared coexpression levels of the two groups. Among the 10 largest complexes, there are 5 in which the group with smaller length difference shows significantly stronger coexpression (P < 0.05, Mann–Whitney U-test). This result further supports our hypothesis that gene length influences gene coexpression of protein complexes.
Figure 2.—
Effects of gene length on gene coexpression. (a) The MES of a protein complex is negatively correlated with its LV (Rho = −0.42, P < 0.05, n = 26; Spearman's rank correlation). (b) The relationship of coexpression and length difference was examined for gene pairs within a protein complex (results of the 10 largest complexes are shown). For each protein complex, all gene pairs were equally grouped into two bins according to their length differences; the bin for gene pairs with smaller length differences is solid, and the bin grouping the others is shaded. The Pearson correlation coefficient (R) was used to measure the level of coexpression of a gene pair, and R values of two bins were compared using the Mann–Whitney U-test. * and ** indicate that the difference between two bins is significant at the levels of P < 0.05 and P < 0.005, respectively.
Gene coexpression and the evolution of gene length:
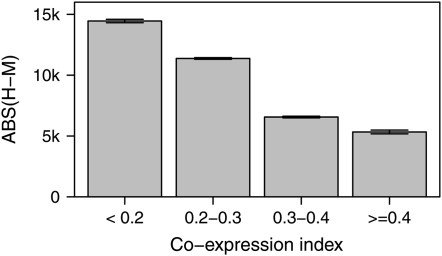
Orthologous genes can vary significantly in length. Different genes have different rates of length divergence, presumably due to different mutation and/or selection pressures. We speculated that the requirement of gene coexpression imposes constraints on the evolution of gene length, so that genes showing a high degree of coexpression with other complex members have a relatively slow rate of evolution of their length. To test this, we computed the coexpression index for each individual gene by averaging its levels of coexpression, measured by Pearson correlation, with all other members of the same protein complex. We examined only genes encoding the 26 large protein complexes to reduce the potential confounding effects caused by other types of functional constraints, and coexpression with genes encoding proteins not in the same complex was not considered because it is less likely to be functional. Consistent with our hypothesis, genes with a higher coexpression index generally have smaller length divergence between human and mouse (Rho = −0.15, P = 5.3 × 10⁻⁵, n = 687, Spearman's rank correlation; Figure 3). This observation could also be explained by the possibility that great length change of a gene can drive the breakdown of its coexpression with other members. Separation of these two possibilities requires knowledge of the ancestral status of both gene length and gene expression, which, however, is difficult as the mode of gene length and gene expression evolution is not well understood.
Figure 3.—
Evolutionary rate of gene length is negatively correlated with gene coexpression index (Rho = −0.15, P = 5.3 × 10⁻⁵, n = 687; Spearman's rank correlation). Pearson correlation coefficients were calculated for a gene with all other members of the same protein complex, respectively, and the mean of these correlation coefficients was taken as the coexpression index of this gene.
DISCUSSION
It is not surprising that introns explain the major effect of the gene length/expression correlation we described, as the total intron length of a typical human gene is ∼20 times its total exon length. A previous study showed that genes with quick response to perturbations have a small number of introns (Jeffares et al. 2008); our results strengthen the idea that intron length affects gene expression tempo. It is worth exploring the contribution of gene length to other types of expression regulation, such as expression level (Castillo-Davis et al. 2002; Ren et al. 2006) or timing mechanisms during development (Swinburne and Silver 2008). Also worthy of investigation are other processes that affect mRNA levels, including mRNA maturation, transport, degradation, translation initiation elongation, and protein degradation. Indeed, we have observed that proteins of the same complex tend to be similar in size (data not shown), suggesting coordinated regulation in translation elongation. Our results highlight the importance of gene length in gene expression regulation and inform the evolution of protein complexes.
Acknowledgments
We thank Jianzhi Zhang, Wenfeng Qian, and Zhi Wang at the University of Michigan and Peng Shi at the Kunming Institute of Zoology for discussions and critical reading of an earlier version of this manuscript. We also appreciate the help from editors regarding the writing of the manuscript. This work was supported by the National Natural Science Foundation of China (90717115 and 30871371).
Supporting information is available online at http://www.genetics.org/cgi/content/full/genetics.109.105361/DC1.
References
- Abruzzi, K. C., A. Smith, W. Chen and F. Solomon, 2002. Protection from free beta-tubulin by the beta-tubulin binding protein Rbl2p. Mol. Cell. Biol. 22: 138–147. [DOI] [PMC free article] [PubMed] [Google Scholar]
- Brown, C. D., D. S. Johnson and A. Sidow, 2007. Functional architecture and evolution of transcriptional elements that drive gene coexpression. Science 317: 1557–1560. [DOI] [PubMed] [Google Scholar]
- Castillo-Davis, C. I., S. L. Mekhedov, D. L. Hartl, E. V. Koonin and F. A. Kondrashov, 2002. Selection for short introns in highly expressed genes. Nat. Genet. 31: 415–418. [DOI] [PubMed] [Google Scholar]
- Chawade, A., M. Brautigam, A. Lindlof, O. Olsson and B. Olsson, 2007. Putative cold acclimation pathways in Arabidopsis thaliana identified by a combined analysis of mRNA co-expression patterns, promoter motifs and transcription factors. BMC Genomics 8: 304. [DOI] [PMC free article] [PubMed] [Google Scholar]
- Etchberger, J. F., A. Lorch, M. C. Sleumer, R. Zapf, S. J. Jones et al., 2007. The molecular signature and cis-regulatory architecture of a C. elegans gustatory neuron. Genes Dev. 21: 1653–1674. [DOI] [PMC free article] [PubMed] [Google Scholar]
- Gehlert, D. R., D. A. Schober, M. Morin and M. M. Berglund, 2007. Co-expression of neuropeptide Y Y1 and Y5 receptors results in heterodimerization and altered functional properties. Biochem. Pharmacol. 74: 1652–1664. [DOI] [PubMed] [Google Scholar]
- He, X., and J. Zhang, 2005. Rapid subfunctionalization accompanied by prolonged and substantial neofunctionalization in duplicate gene evolution. Genetics 169: 1157–1164. [DOI] [PMC free article] [PubMed] [Google Scholar]
- Ihmels, J., S. Bergmann, M. Gerami-Nejad, I. Yanai, M. McClellan et al., 2005. Rewiring of the yeast transcriptional network through the evolution of motif usage. Science 309: 938–940. [DOI] [PubMed] [Google Scholar]
- Izban, M. G., and D. S. Luse, 1992. Factor-stimulated RNA polymerase II transcribes at physiological elongation rates on naked DNA but very poorly on chromatin templates. J. Biol. Chem. 267: 13647–13655. [PubMed] [Google Scholar]
- Jeffares, D. C., C. J. Penkett and J. Bahler, 2008. Rapidly regulated genes are intron poor. Trends Genet. 24: 375–378. [DOI] [PubMed] [Google Scholar]
- Liang, H., and W. H. Li, 2007. MicroRNA regulation of human protein protein interaction network. RNA 13: 1402–1408. [DOI] [PMC free article] [PubMed] [Google Scholar]
- Liu, C. T., S. Yuan and K. C. Li, 2009. Patterns of co-expression for protein complexes by size in Saccharomyces cerevisiae. Nucleic Acids Res. 37: 526–532. [DOI] [PMC free article] [PubMed] [Google Scholar]
- Mewes, H. W., S. Dietmann, D. Frishman, R. Gregory, G. Mannhaupt et al., 2008. MIPS: analysis and annotation of genome information in 2007. Nucleic Acids Res. 36: D196–D201. [DOI] [PMC free article] [PubMed] [Google Scholar]
- Papp, B., C. Pal and L. D. Hurst, 2003. Dosage sensitivity and the evolution of gene families in yeast. Nature 424: 194–197. [DOI] [PubMed] [Google Scholar]
- Qian, W., and J. Zhang, 2008. Gene dosage and gene duplicability. Genetics 179: 2319–2324. [DOI] [PMC free article] [PubMed] [Google Scholar]
- Ren, X. Y., O. Vorst, M. W. Fiers, W. J. Stiekema and J. P. Nap, 2006. In plants, highly expressed genes are the least compact. Trends Genet. 22: 528–532. [DOI] [PubMed] [Google Scholar]
- Swinburne, I. A., and P. A. Silver, 2008. Intron delays and transcriptional timing during development. Dev. Cell 14: 324–330. [DOI] [PMC free article] [PubMed] [Google Scholar]
- Ucker, D. S., and K. R. Yamamoto, 1984. Early events in the stimulation of mammary tumor virus RNA synthesis by glucocorticoids. Novel assays of transcription rates. J. Biol. Chem. 259: 7416–7420. [PubMed] [Google Scholar]
- van Waveren, C., and C. T. Moraes, 2008. Transcriptional co-expression and co-regulation of genes coding for components of the oxidative phosphorylation system. BMC Genomics 9: 18. [DOI] [PMC free article] [PubMed] [Google Scholar]
- Veitia, R. A., S. Bottani and J. A. Birchler, 2008. Cellular reactions to gene dosage imbalance: genomic, transcriptomic and proteomic effects. Trends Genet. 24: 390–397. [DOI] [PubMed] [Google Scholar]
- Wagner, A., 2001. The yeast protein interaction network evolves rapidly and contains few redundant duplicate genes. Mol. Biol. Evol. 18: 1283–1292. [DOI] [PubMed] [Google Scholar]
- Walhout, A. J., J. Reboul, O. Shtanko, N. Bertin, P. Vaglio et al., 2002. Integrating interactome, phenome, and transcriptome mapping data for the C. elegans germline. Curr. Biol. 12: 1952–1958. [DOI] [PubMed] [Google Scholar]
- Warner, J. R., 1999. The economics of ribosome biosynthesis in yeast. Trends Biochem. Sci. 24: 437–440. [DOI] [PubMed] [Google Scholar]
- Yang, J., R. Lusk and W. H. Li, 2003. Organismal complexity, protein complexity, and gene duplicability. Proc. Natl. Acad. Sci. USA 100: 15661–15665. [DOI] [PMC free article] [PubMed] [Google Scholar]


