Abstract
Ultrafast laser spectroscopy techniques are used to measure the low-frequency vibrational coherence spectra and nitric oxide rebinding kinetics of Caldariomyces fumago chloroperoxidase (CPO). Comparisons of the CPO coherence spectra with those of other heme species are made to gauge the protein-specific nature of the low-frequency spectra. The coherence spectrum of native CPO is dominated by a mode that appears near 32-33 cm-1 at all excitation wavelengths, with a phase that is consistent with a ground-state Raman-excited vibrational wavepacket. On the basis of a normal coordinate structural decomposition (NSD) analysis, we assign this feature to the thiolate-bound heme doming mode. Spectral resolution of the probe pulse (“detuned” detection) reveals a mode at 349 cm-1, which has been previously assigned using Raman spectroscopy to the Fe-S stretching mode of native CPO. The ferrous species displays a larger degree of spectral inhomogeneity than the ferric species, as reflected by multiple shoulders in the optical absorption spectra. The inhomogeneities are revealed by changes in the coherence spectra at different excitation wavelengths. The appearance of a mode close to 220 cm-1 in the coherence spectrum of reduced CPO excited at 440 nm suggests that a subpopulation of five coordinated histidine-ligated hemes is present in the ferrous state at a physiologically relevant pH. A significant increase in the amplitude of the coherence signal is observed for the resonance with the 440 nm subpopulation. Kinetics measurements reveal that nitric oxide binding to ferric and ferrous CPO can be described as a single-exponential process, with rebinding time constants of 29.4 ± 1 and 9.3 ± 1 ps, respectively. This is very similar to results previously reported for nitric oxide binding to horseradish peroxidase.
Chloroperoxidase (CPO)1 extracted from the fungus Caldariomyces fumago is a thiolate-ligated heme protein with promiscuous enzymatic activity (1). For example, it can act as a halogenation enzyme, a classical peroxidase, a dehaloperoxidase, a catalase, or a monooxygenase (2-5). Because of this, CPO is considered to be a very promising protein for biotechnology applications that require a broad range of enzymatic actions (6). Although its active site structure resembles that of the P450 and nitric oxide synthase class of enzymes (i.e., a heme chromophore covalently bound to the protein backbone by a cysteine residue), its wider range of catalytic abilities makes chloroperoxidase one of the most versatile members of the family of thiolate-ligated heme proteins (7, 8).
CPO is an extracellular enzyme with a molecular mass of approximately 42 kDa, extensively glycosylated, with both N- and O-linked glycosyl chains. It is active in an acidic environment, mainly between pH 2.5 and 5. Its catalytic cycle has been resolved (2), and only a few amino acids are thought to play an important role in catalysis (9). CPO consists of two (mainly) α-helical domains with the heme squeezed between them. The proximal helix is almost perpendicular to the heme plane. The fifth (proximal) heme iron ligand is provided by Cys29, which is located at the N-terminus of the proximal helix. The distal helix contains Glu183 which is positioned next to the peroxide binding site (10). The catalytic role of Glu183 is thought to be similar to that played by the distal histidine in peroxidases [i.e., it facilitates the formation of compound I (11)]. The distal pocket also has a Phe186 residue that probably assists in positioning the substrate at some stage in the chemical reaction. Aside from these key amino acids, the active site of CPO also contains an octahedrally coordinated Mn2+ atom (ligated by one of the heme propionates, three amino acids, and two water molecules), but its role has not been clearly assigned (9). Figure 1 shows the active site of native CPO, including the heme, the functionally important amino acids (Cys29, Phe186, and Glu183), and the Mn2+ ion. Two other histidine (His105 and His107) residues are present on the distal side of the heme as displayed in Figure 1.
Figure 1.
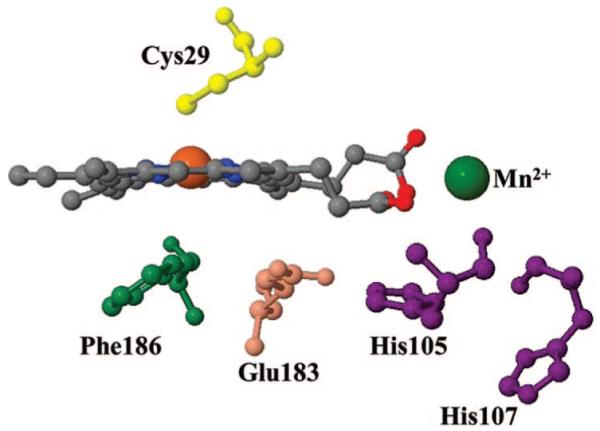
Spatial view of the active site of chloroperoxidase, including the Mn2+ ion and its binding site (10) (Protein Data Bank entry 1CPO). Cys29 is the proximal ligand. The distal pocket features Phe186 and Glu183 as residues that affect the catalytic cycle. Mn2+ is coordinated by one of the heme propionates, three amino acids (Glu104, His105, and Ser108), and two water molecules (not shown). Two histidine residues (His105 and His107) that are positioned close to the distal pocket are also shown.
There has been an intensive effort focused on understanding the relationship between the structure of CPO and its function (3). The prior work has consisted of both biochemical measurements and spectroscopic investigations. Diverse spectroscopic efforts (2, 12-17) involving electronic absorption, resonance Raman, Mössbauer, MCD, X-ray, EXAFS, EPR, and NMR have helped to reveal many important features of CPO, including its structure, coordination state, axial ligands, and catalytic cycle.
The work presented here provides additional information that is focused on the low-frequency (<200 cm-1) vibrational modes of native and reduced CPO. We employ an ultrafast spectroscopic technique [femtosecond coherence spectroscopy (FCS)] that prepares and probes the low-frequency vibrational coherences of the protein-bound heme group, which are essentially undetectable in aqueous phase using other spectroscopic techniques. Such low-frequency modes are likely to play an important biological role because they are easily activated by thermal fluctuations and therefore are expected to be involved as reaction coordinates in the catalytic cycle of the enzyme (18). In this work, spectral comparisons are made between CPO and other histidine- and thiolate-ligated heme proteins to assess the protein-specific nature of the low-frequency spectra.
In the absence of photochemistry, coherent oscillations are generated by an impulsive stimulated coherent Raman process that utilizes the large bandwidth associated with short laser pulses (a typical 60 fs pulse has a bandwidth of 250 cm-1). The pump pulse creates coherences, while the probe pulse monitors them in real time. For heme systems, the excited-state electronic lifetimes are so short that only the coherences in the ground electronic state are detected. The theoretical and experimental details of this nonlinear optical technique can be found elsewhere (19-24). One of its main advantages is the capability to probe low-frequency vibrational oscillations below a kBT of ~200 cm-1, with both frequency and phase sensitivity. This allows unique information about the low-frequency spectrum to be extracted, as well as the ultrafast photophysical phenomena that are initiated by the pump pulse. Coherence spectroscopy is one of the few spectroscopic approaches that can disentangle the low-frequency, delocalized, normal modes of the heme chromophore and reveal how they are affected by the protein and its allosteric or solvent interactions.
Low-frequency modes are difficult to detect by conventional frequency domain Raman techniques, due to the proximity of very strong peaks that originate from quasielastic scattering phenomena. In particular, normal modes below 100 cm-1 are often obscured by a background that is several orders of magnitude larger than the signal of interest. Coherence spectroscopy has a key advantage over traditional methods at low frequencies because the time domain signals of low-frequency modes have long periods of oscillation and their recurrences take place with longer time delays, where background interference has been minimized. Moreover, by spectrally dispersing the probe laser pulse to eliminate the zero-frequency (dc) interference, we can expand the range of frequencies detected out to ~400 cm-1 and compare the time domain data directly with measurements performed using Raman spectroscopy. Very short pulses (~10 fs) with extended bandwidth can also be used to probe higher-frequency modes (25-28), but the experiments reported here are designed to optimize the enhancement of the lower-frequency, thermally accessible, modes (21).
MATERIALS AND METHODS
Sample Preparation
Ferric chloroperoxidase (CPO) from Caldariomyces fumago was prepared as discussed previously (1). The ferric samples used for the coherence measurements were diluted from a higher-concentration stock sample in a 50% glycerol (v/v) potassium phosphate buffer (pH 5, 0.1 M) to an absorbance of 1.0 OD/mm. To prepare the reduced sample, the ferric protein was degassed under an Ar atmosphere for approximately 20 min and then transferred to a glovebox. The reduced species was obtained by adding 7 μL of 1 M sodium dithionite to 250 μL of buffered sample. The thermophilic P450 (CYP119) was prepared as previously reported (29, 30), and the ferric sample was generated by diluting the stock protein in potassium phosphate buffer (pH 7.2, 0.1 M) to the required concentration. The ferrous sample of CYP119 was prepared in the glovebox following the procedure outlined for the reduced CPO sample. The P450CAM sample (CYP101) was also prepared with the camphor substrate as discussed previously (31, 32). The ferric sample was prepared by dissolving the stock protein in phosphate buffer (pH 7, 0.1 M), while the reduced sample was prepared under anaerobic conditions, in the glovebox, as described previously. Horse heart myoglobin (Mb) and horseradish peroxidase isoenzyme C (HRP) were purchased as salt free lyophilized powder from Sigma Co. (St. Louis, MO) and used without further purification. The ferric samples were obtained by dissolving the protein powder in potassium phosphate buffer (pH 7, 0.1 M) and adjusting the concentration by successive dilution steps until the absorbance of the sample was approximately 1 OD unit (at the pump wavelength) in a 1 mm path length cell. The reduced heme samples of Mb and HRP were prepared following the same procedural steps employed for all other reduced samples. For all samples, the absorption spectra were recorded (Hitachi U-3410) after the preparation procedure to confirm that heme iron reduction was achieved and that it was complete. Absorption spectra were also taken after the experimental runs were concluded to ensure that the integrity of the sample was preserved during experiments.
Laser System
The coherence measurements were carried out in a classical pump probe setup. The laser system consists of a tunable (750-960 nm) oscillator [MIRA 900F, Coherent Inc. (Santa Clara, CA)] with the active gain medium (crystal of Ti:Al2O3) pumped by a 10 W diode laser (Verdi 10, Coherent Inc.). The oscillator is able to generate 50-100 fs pulses at a repetition rate of 76 MHz with an energy of ~10 nJ/pulse. To resonantly excite the samples in the Soret band, the IR output of the laser is frequency-doubled in a 250 μm BBO crystal and then chirp compensated by a pair of SF10 prisms to within 10% of the transform time-bandwidth limit. Subsequently, the laser light is split into a pump arm and a probe arm, with a power ratio of 2:1 between the two. The pump beam is modulated using an acousto-optic modulator (AOM) [Neos Technologies (Melbourne, FL)] driven by a lock-in amplifier (LIA) (Stanford SR844) at 1.5 MHz. Before reaching the sample, the pump and probe beam polarizations are adjusted to be perpendicular to help reject the pump beam by polarization filtering, prior to the detection step. The time delay between the pump and probe pulses is controlled by a Newport Klinger (Irvine, CA) translation stage in steps of 1 μm (6.66 fs steps in the time domain). Both beams are focused into the spinning sample cell using a 3 in. achromatic lens in a near-parallel geometry. After the sample, the beams are recollimated and the pump light is spatially blocked (using a pinhole) and extinguished by a polarization analyzer that allows only the probe light to pass. The coherence signal is detected along the probe beam direction in a standard self-heterodyned configuration.
The detection step of the experimental procedure allows us to focus on different frequency ranges of the coherent signal. In an “open band” detection scheme, we employ a Si photodiode to measure the entire spectral bandwidth of the probe pulse. This scheme results in better fidelity for the detection of low-frequency modes. The detuned or dispersed detection method, on the other hand, allows us to selectively enhance higher-frequency regions of the coherent signal. In this latter case, a photomultiplier tube (PMT) coupled to a monochromator is employed for detection, resulting in increased amplitude and superior detection of the higher-frequency components of the coherent signal.
Data Analysis
The experimental coherence spectra have two components that result from different mechanisms, population transfer and vibrational coherence. The population transfer components are dominant and undergo a nonoscillatory (dc) decay. Although these components carry important information regarding various dynamic processes (e.g., ligand rebinding, vibrational cooling, and spectral diffusion of the line shape) they must be removed to reveal the underlying coherence signal. Because of the large amplitude of the electronic population signals (generally 2 orders of magnitude larger than the coherence signal), special precautions have to be taken during both the digitization and recording of the signal and the fitting procedure. The digitization of the experimental signal is performed by the LIA on a 24 bit scale so that it allows for a sufficient dynamic range even for low-amplitude coherence signals. The data analysis follows a sequential approach. We first employ a maximum entropy method (MEM) algorithm to fit the dc response and retrieve the oscillatory signal because this method removes assumptions regarding the number of exponential decay processes that might be present. The oscillatory coherence signal comes from the superposition of vibrational states coupled to the resonant electronic transition. This coherent superposition is lost after a few picoseconds following the excitation because of homogeneous and inhomogeneous decoherence processes that cause the oscillatory signal to damp as a function of time. To quantify the coherent signals, they are fit to a sum of damped cosine functions ΣiAie-γit cos(ωit + φi), using a linear predictive single-value decomposition (LPSVD) algorithm.
EXPERIMENTAL RESULTS
Coherence spectroscopy probes the low-frequency vibrational modes that are coupled to the resonant optical excitation of the heme chromophore. The vibrational coherence modulates the third-order polarization of the sample, which leads to a variation in the forward scattering and/or optical transmission of the probe pulse. The excitation wavelength can be chosen to optimize the amplitude of the coherence signal, which normally takes place for excitation on either side of the resonant absorption maximum (21). In Figure 2, we display the equilibrium absorption spectra of the ferric and ferrous species of CPO measured in phosphate buffer at pH 5. As for all heme proteins, the chloroperoxidase species have strong Soret absorption bands in the 400 nm spectral region that arise from π-π* electronic transitions. The CPO Soret bands tend to be broader than usual, and the reduced species exhibits two shoulders, at approximately 425 and 440 nm, even at pH values consistent with its physiological function (pH < 5). The absorption spectra of the oxidized and reduced species of P450CAM (CYP101), another thiolate-ligated heme protein, are also displayed for comparison.
Figure 2.
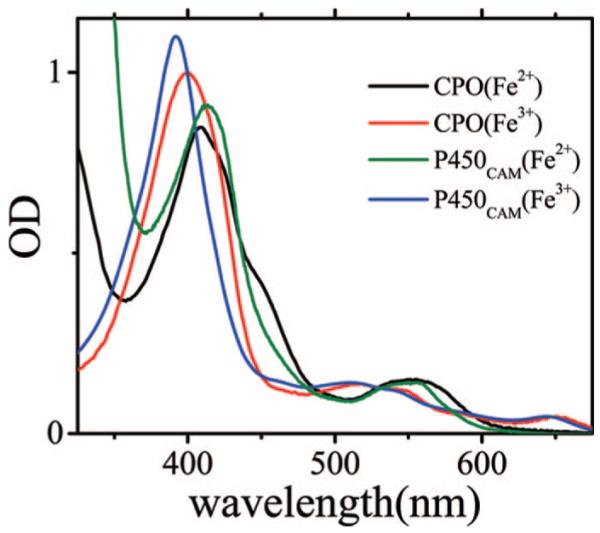
Electronic absorption spectra of native ferric CPO (red), reduced CPO (black), ferric P450CAM (blue), and reduced P450CAM (green). The CPO spectra were recorded at pH 5 in 0.1 M phosphate buffer, and the maximum of the Soret peak is 399 nm for the ferric species and 409 nm for the reduced species. The camphor-bound P450CAM spectra were measured at pH 7 in 0.1 M phosphate buffer, and the maximum of the Soret peak is 392 nm for the ferric species and 414 nm for the reduced species. The spectra have been normalized using published extinction coefficients.
Figure 3 presents the coherence and Raman spectra of ferric CPO, illustrating how the different detection techniques allow us to correlate the time and frequency domain results. The Raman spectrum is presented at the top of the figure, where it can be compared with the detuned and open band coherence spectra below. The detuned data are obtained by probing 5 nm from the 425 nm carrier frequency, which selectively enhances the higher-frequency modes and optimizes the comparisons with the resonance Raman results. The insets show the detuned and open band coherence data and the LPSVD fits used to generate the frequency domain spectra. We detect vibrations at 349, 305, and 268 cm-1 in the detuned coherence measurements that match peaks seen in the Raman data at 350, 310, and 265 cm-1, respectively. The feature seen in the Raman data, close to 265 cm-1, appears to involve several unresolved modes and is also broadened in the detuned coherence measurement, with an additional feature at ~245 cm-1. The low-frequency region in the detuned power spectrum agrees reasonably well with the open band spectrum showing peaks at 92, 106, and 144 cm-1 (detuned) and 86, 102, and 145 cm-1 (open band), respectively. However, the relative intensity patterns are changed due to resonant enhancement and laser pulse bandwidth effects.
Figure 3.
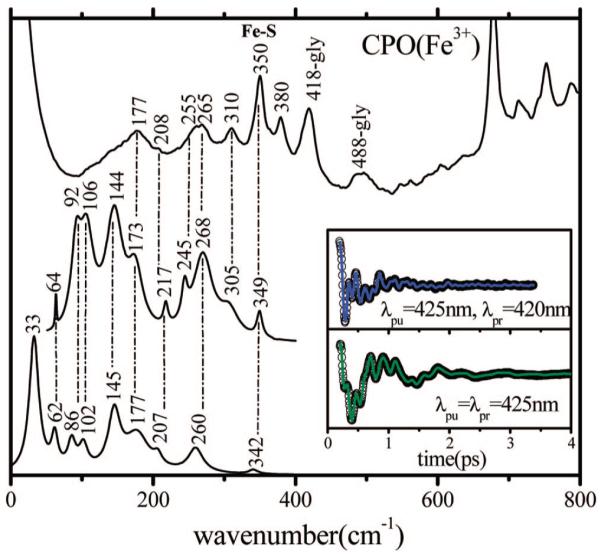
Correlations between the resonance Raman and coherence spectra of native (ferric) CPO. The top trace is the Raman spectrum measured with an excitation wavelength of 413.1 nm. The middle trace is the detuned coherence spectrum (the inset shows the coherent oscillations and LPSVD fit). The bottom trace is the open band coherence spectrum, and the inset again shows the coherent oscillations and LPSVD fit under this condition. The coherence spectra were measured using excitation at 425 nm. The dispersed data were measured with a 0.5 nm spectral window, detuned 5 nm to the blue of the carrier frequency maximum (i.e., λpr = 420 nm).
The open band coherence spectrum at 425 nm is dominated by a very strong mode at 33 cm-1 with a phase near zero (φi ~ 0). The mode can easily be observed in the oscillatory data of Figure 4, where we measure the open band coherence signal and the corresponding LPSVD power spectra as the excitation (carrier) wavelength is red-shifted from the ferric CPO Soret peak near 400 nm. As expected, the main features in the power spectra do not change dramatically as a function of wavelength. The small changes that appear in the weaker modes are probably a reflection of error in the measurement. Table 1 lists the frequencies observed, and the last row of the table shows averages of the open band experiments using the different excitation wavelengths.
FIGURE 4.

Open band coherence measurements of native ferric CPO at pH 5. The left panels show the oscillatory signal (○) and their LPSVD fits (—). Right panels show the corresponding LPSVD-generated power spectra. Experiments were carried out with ~60 fs pulses at 410, 415, 420, and 425 nm.
Table 1.
Low-Frequency Modes of Ferric CPOa
| λex | γa | γb | γc | γd | γe | γf | γg |
|---|---|---|---|---|---|---|---|
| 410 | 32(s) | 63(w) | 90(w) | 108(w) | 154(m) | 191(w) | |
| 415 | 32(s) | 54(w) | 89(w) | 111(w) | 146(m) | 204(w) | 261(w) |
| 420 | 33(s) | 62(w) | 86(w) | 107(w) | 151(m) | 259(w) | |
| 425 | 33(s) | 62(w) | 86(w) | 102(w) | 145(m) | 207(w) | 260(w) |
| 33 ± 1 | 60 ± 4 | 88 ± 2 | 107 ± 4 | 149 ± 4 | 201 ± 8 | 260 ± 1 |
Excitation wavelengths are in nanometers. Mode frequencies are in inverse centimeters. s, m, and w denote strong, medium, and weak intensity, respectively, in the extracted power spectrum.
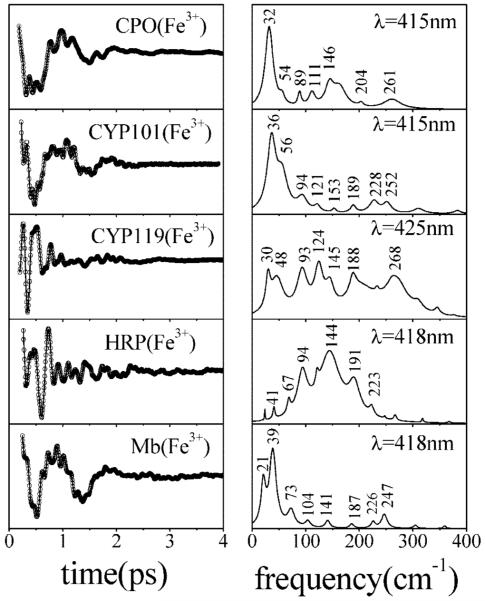
Earlier coherence spectra (33) have shown that the frequencies of the reduced heme depend upon the proximal ligand to the iron atom. This is likely to hold for the oxidized species as well. In Figure 5, we present data from three cysteine-bound heme proteins (CPO, CYP101, and CYP119) and two histidine-bound heme proteins (HRP and metMb). These data support previous assessments (33) that document systematic changes in the low-frequency heme modes as a function of ligation state. The cysteine-bound samples display a strong mode near 30-36 cm-1, along with a weaker mode near 50 cm-1. On the other hand, many histidine-bound proteins have a strong mode near 40 cm-1 and occasionally a weaker mode near 20 cm-1 appears. However, this latter mode may result from a slight over or underfitting of the large nonoscillatory decay, so we refrain from assigning it at this time. The weak low-frequency activity observed in HRP is very unusual, and it has been discussed elsewhere (34). There are also differences between the cysteine-bound heme protein samples. For example, CPO and CYP101 (plus camphor) are high-spin ferric systems, sharing similar electronic absorption properties. Their low-frequency coherence spectra are also similar, with strong oscillations near 30-36 cm-1. On the other hand, the thermophyllic CYP119 shows a weaker relative intensity in this region. This is probably related to the presence of a water molecule as an axial ligand in CYP119, which affects the spin state, heme geometry, and redox potential.
Figure 5.
Comparison of low-frequency coherence spectra of three different cysteine-ligated ferric heme proteins [CPO, P450CAM (CYP101) with camphor bound, and thermophyllic P450 (CYP119)] and two histidine-ligated ferric heme proteins (HRP and metmyoglobin). The left panels present the oscillatory signal and the LPSVD fit. The right panels show the corresponding LPSVD power spectra. The open band experiments were carried out at wavelengths specified in the right panels using ~60 fs pulses.
Although the catalytic cycle of CPO does not normally access the ferrous state, we investigate the coherence spectra of the reduced species to facilitate comparisons with P450 proteins and to document how the change in oxidation state affects the low-frequency spectrum. In Figure 6, we display the open band (420 nm) and detuned measurements and compare them with the Raman spectrum. Again, there is very good correlation between the time and frequency domain data, especially for modes in the 200-300 cm-1 range, where Raman features that appear at 247, 272, and 303 cm-1 have corresponding peaks at 246, 276, and 301 cm-1, respectively, in the coherence spectrum. The Raman spectrum also shows a very rich mode structure between 300 and 400 cm-1, with four modes at 340, 352, 363, and 379 cm-1. The coherence spectrum does not resolve that part of the spectrum, and the analysis of the experimental coherence data finds only one weak peak at 350 cm-1. This could be related to the destructive interference and rapid damping that can occur when closely spaced vibrational modes are present. In addition, the limited bandwidth of the pulses employed in these experiments probably reduces the strength of these signals.
Figure 6.
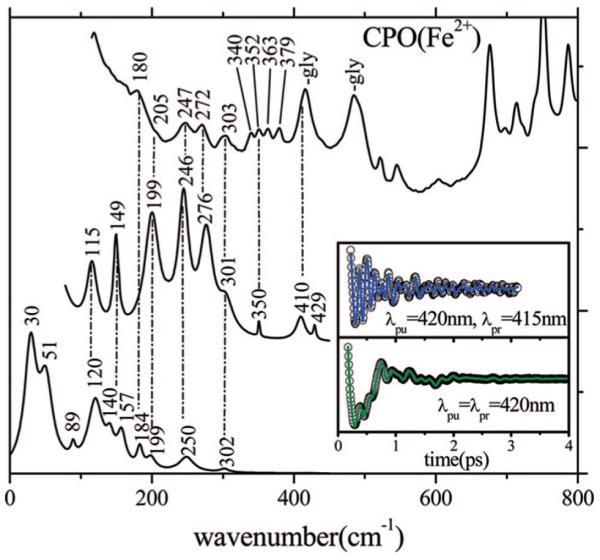
Correlations between the resonance Raman and coherence spectra of ferrous CPO. The top trace is the Raman spectrum measured with a 413.1 nm excitation wavelength. The middle trace is the detuned coherence spectrum (the inset shows the coherent oscillations and LPSVD fit). The bottom trace is the open band coherence spectrum, and the inset again shows the coherent oscillations and LPSVD fit under this condition. The coherence spectra were measured using 420 nm excitation. The dispersed data were measured with a 0.5 nm spectral window, detuned 5 nm to the blue of the carrier frequency maximum (i.e., λpr = 415 nm).
The open band coherence signal of reduced CPO is similar to the ferric case in that it is dominated by a very strong mode near 30 cm-1 (with a sideband near 50 cm-1) that can be seen directly in the time domain data. In Figure 7, we present the wavelength dependence of the coherence spectra of ferrous CPO. Data measured at 420 and 425 nm are very similar and result in good correlation of the frequencies in the LPSVD-generated power spectra [the intensities change because of the excitation wavelength dependence of the various modes (21)]. On the other hand, the coherence spectrum at 440 nm is very different. The optical absorption spectrum for ferrous CPO is shown in Figure 2, and the appearance of the shoulder near 440 nm suggests that at least two heme species are present. The coherence spectrum at 440 nm evidently interrogates a second subspecies because the signal is now dominated by two very strong modes that appear at 88 and 130 cm-1, while the modes near 30 and 50 cm-1 exhibit a much lower intensity. In addition to the change in the oscillatory pattern, it should be noted that the intensity of the coherent signals associated with the 88 and 130 cm-1 modes is significantly larger (by a factor of ~5) than other heme coherences we have observed previously. Figure 8 presents the raw pump probe data on a log scale (top panel), along with the oscillatory signal, after the population decay has been removed using MEM (bottom panel). The coherences can be observed without difficulty in the raw data, and the two dominant oscillations are shown displaced in the bottom panels.
Figure 7.
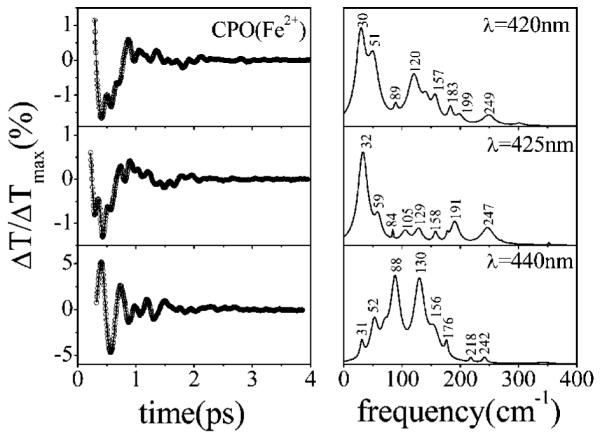
Open band measurements of reduced CPO at pH 5. The left panels show the oscillatory signal (○) and their LPSVD fits (—). The right panels present the corresponding LPSVD-generated power spectra. Experiments were carried out with ~60 fs pulses at 420, 425, and 440 nm. The increase in the relative amplitude of the oscillatory signal as well as changes in the pattern of frequencies should be noted as the excitation wavelength is tuned to 440 nm.
Figure 8.
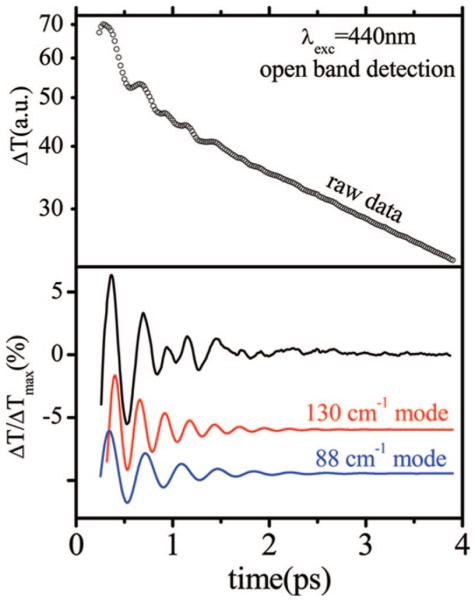
Transient pump probe signal of reduced CPO at 440 nm. Note the strong vibrational coherence signal. The full transmission change is shown in the top panel on a logarithmic scale. The quantity ΔTmax is defined by the maximal probe transmission change, which usually occurs near the 60-80 fs time delay. The bottom panel shows the oscillatory component of the signal (top curve) obtained after removal of the exponentially decaying component from the raw data. The LPSVD-extracted oscillations of the two strongest modes (88 and 130 cm-1) are also displaced below for easier visualization.
In Figure 9, we compare the coherence and Raman spectra of reduced CPO taken with similar excitation wavelengths (440 and 442 nm), in resonance with the Soret band shoulder near 440 nm (Figure 1). The Raman spectrum turns out to be very congested between 150 and 300 cm-1 and does not allow for an easy identification of the constituent modes, which presumably arise from the mixture of CPO species that are present.
Figure 9.
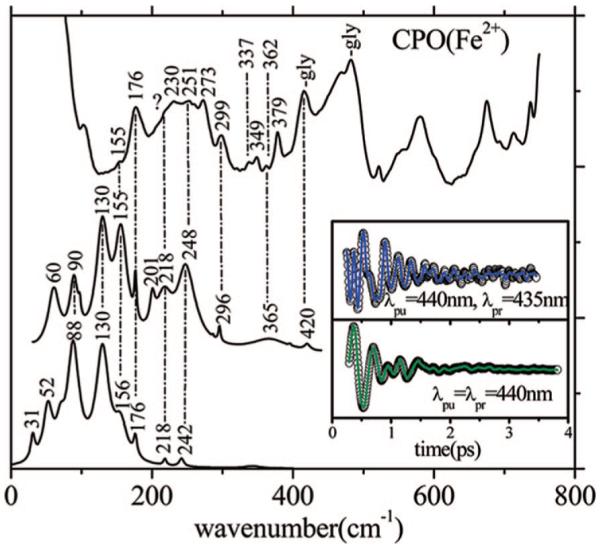
Correlations between the resonance Raman and coherence spectra of ferrous CPO. The top trace is the Raman spectrum measured with an excitation wavelength of 442.1 nm. The middle trace is the detuned coherence spectrum (the inset shows the coherent oscillations and LPSVD fit). The bottom trace is the open band coherence spectrum, and the inset again shows the coherent oscillations and LPSVD fit under this condition. The coherence spectra were measured using 440 nm excitation. The dispersed data were measured with a 0.5 nm spectral window, detuned 5 nm to the blue of the carrier frequency maximum (i.e., λpr = 435 nm).
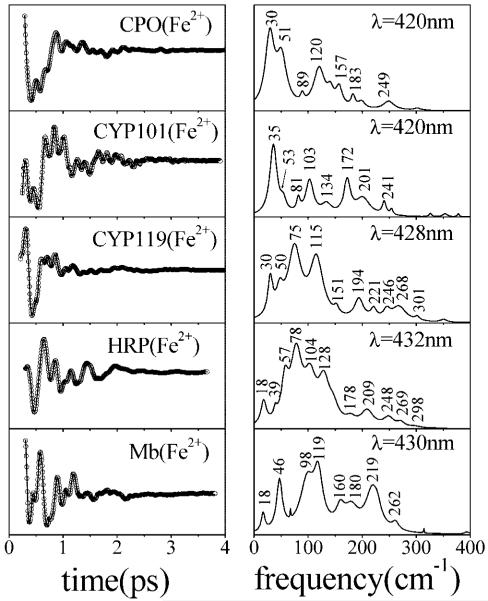
In Figure 10, we present a comparison of the coherence spectra of cysteine- and histidine-bound ferrous species. The different patterns in the coherence spectra are thought to be the result of distortions in heme geometry (34, 35), and the strength of the axial ligand evidently influences the magnitude of these distortions. The thiol-ligated ferrous hemes again have relatively strong modes at 30 and 50 cm-1, while the histidine-ligated myoglobin and HRP have a mode near 40 cm-1. We also note that the ferrous forms of P450[CYP119] and HRP have reduced amplitudes in the 30-50 cm-1 range and much stronger modes appear between 75 and 150 cm-1.
Figure 10.
Comparison of the low-frequency coherence spectra of three different cysteine-ligated ferrous heme proteins [CPO, P450CAM (CYP101) with camphor bound, and thermophyllic P450 (CYP119)] and two histidine-ligated ferrous heme proteins (reduced HRP and deoxymyoglobin). The left panels present the oscillatory signal and the LPSVD fit. The right panels show the corresponding coherence spectra. Experiments were carried out at wavelengths specified in the right panels using ~60 fs pulses.
As shown in Figure 11, the kinetics of NO binding to CPO is exponential for both the ferric and ferrous NO adducts (see Table 2). Because the rebinding kinetics are fast and well-behaved, we also attempted to monitor the coherence spectra of the NO derivatives of CPO. However, because of a slower than expected reset to equilibrium (probably due to a reduced NO bimolecular rebinding rate), the coherence spectra could not be obtained with a superior signal-to-noise ratio at the high laser repetition rate utilized here. Additional studies at lower repetition rates, which investigate photolysis and the associated coherence spectra of thiolate-ligated heme compounds, will be presented elsewhere.
Figure 11.
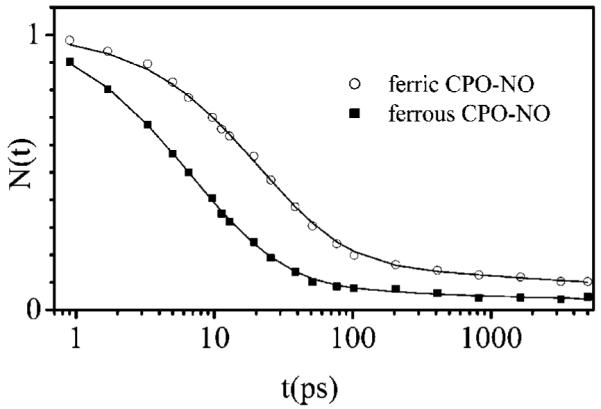
NO rebinding kinetics for the ferric and ferrous forms of CPO. The data are fit with a single-exponential function with a constant background. The fitting parameters and fundamental geminate rebinding (kBA) and escape (kout) rates are listed in Table 2.
Table 2.
Kinetics of NO Rebindinga to Ferric and Ferrous Species of Chloroperoxidase and Horseradish Peroxidase at 293 K
| NO-bound sample | λprobe (nm) | kg (×1010 s-1) | Ig (%) | kBA (×1010 s-1) | kout (×1010 s-1) |
|---|---|---|---|---|---|
| ferric CPO | 437 | 3.4 ± 0.2 | 89 ± 1 | 3.0 ± 0.2 | 0.4 ± 0.1 |
| ferrous CPO | 440 | 10.8 ± 0.2 | 95 ± 1 | 10.3 ± 0.2 | 0.5 ± 0.2 |
| ferric HRP | 420 | 4.3 ± 0.1 | 76 ± 1 | 3.3 ± 0.1 | 1.0 ± 0.06 |
| ferric HRP/BHA | 420 | 6.1 ± 0.1 | 98.5 ± 0.3 | 6.0 ± 0.1 | 0.1 ± 0.02 |
| ferrous HRP | 440 | 16 ± 0.2 | 95 ± 1 | 15.2 ± 0.3 | 0.8 ± 0.2 |
kBA = Igkg; kout = kg - kBA.
DISCUSSION
The work presented here is primarily focused on investigations of the low-frequency coherences of thiolate-ligated heme proteins (without complications from ligand photolysis). However, Figure 11 and Table 2 present the NO rebinding kinetics for CPO and demonstrate a single-exponential response for both the ferric and ferrous states. The NO rebinding and escape rates for CPO are very similar to those determined for HRP (36), and additional coherence spectroscopy studies should reveal the low-frequency modes that are activated when NO is photolyzed (34). The NO rebinding kinetics of a variety of other heme proteins have been systematically investigated by Vos et al. (37, 38), and most display behavior that is very similar to that of CPO and HRP. An interesting exception is the case of NO synthase (37), which structurally resembles CPO (i.e., it has a cysteine axial ligand) but displays a much slower, multiexponential, kinetic response for NO binding.
We focus below on the photostable ferric and ferrous states of CPO and examine them with the goal of understanding the differences in the low-frequency spectrum when the oxidation state and proximal ligand are changed. Modes below ~200 cm-1 fall in the region where thermal excitations can be significant (kBT ~ 200 cm-1 at room temperature), and this is where most reaction coordinates are likely to be found. The methodology presented here is unique in its ability to probe this portion of the vibrational spectrum in the aqueous phase.
In the native form of CPO, the iron atom is in the ferric oxidation state (Fe3+), and during its normal catalytic cycle, it explores even higher oxidation states (Fe4+). The reduced (Fe2+) form of the enzyme is not accessed during the normal chlorination reaction. However, several of the non-native reactions that CPO can catalyze do involve the ferrous state (e.g., monooxygenase reactions). As a result, we analyze the low-frequency vibrational properties of both the ferric and ferrous states and compare the coherence spectra with those of other histidine- and thiolate-ligated heme species. As expected, the coherence spectrum of ferric CPO, obtained under detuned conditions, is similar to its Raman spectrum. Figure 3 presents both the time and frequency domain data. The coherence spectrum obtained using detuning conditions allows us to resolve the Fe-S stretching mode in CPO at 349 cm-1, which has been previously assigned using isotope labeling and Raman spectroscopy (12). This mode is not well-resolved in the open band data, but it is relatively strong in the detuned measurement and quite well defined.
Due to the combination of elastic scattering and the cancelation of the resonance Raman amplitudes of the incoming and outgoing resonant photons, which occurs when the period of the vibrational mode is longer than the electronic dephasing time (39), the resonance Raman spectrum in Figure 3 does not reveal vibrational activity below 200 cm-1 (with the exception of a broad peak near 177 cm-1). In contrast, the coherence spectrum demonstrates that there is considerable activity in this spectral region. The open band data allow recovery of the lowest-frequency components of the vibrational spectrum with optimum fidelity, and we observe a mode at 33 cm-1 as the dominant oscillation.
We carried out coherence measurements on ferric CPO at different wavelengths to look for excitation wavelength dependence in the low-frequency spectrum (Figure 4). If there is an inhomogeneous distribution of heme geometries that is correlated with the optical spectrum, this can sometimes lead to the observation of “drifts” in the frequency as the excitation wavelength is tuned across the Soret band (40). As one can see in Figure 4, there are no major wavelength-dependent changes in the low-frequency spectral pattern. The main frequencies observed in the coherence spectra are displayed in Table 1. Definitive assignments of the frequencies that appear with weaker intensity are difficult to make because of significant mode mixing, and the relatively small isotopic shifts associated with low-frequency modes. However, an assignment of the dominant oscillation appearing near 32-33 cm-1 can be made.
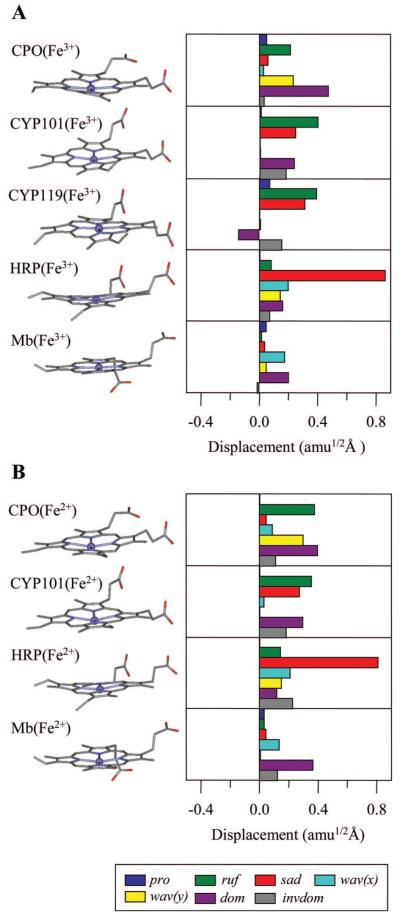
This assignment is based on the results of a normal-coordinate structural decomposition (NSD) analysis using the X-ray structure of native CPO. This type of computational approach typically uses the six lowest-frequency out-of-plane (OOP) normal coordinates of porphine to simulate the distorted structure of heme in the protein interior as determined from the X-ray analysis (35, 41, 42). We also include a seventh mode, “inverse doming”, which involves anticorrelated motion between the iron and the porphine nitrogens. This allows us to specify the heme OOP displacements with improved precision. The overall iron displacement is roughly the sum of the doming and inverse doming distortions. In Figure 12, we present a summary NSD analysis of some of the proteins examined in this work. In general, the protein-induced distortions lower the symmetry of the heme and result in normally forbidden transitions, involving the OOP modes, to become Raman allowed. The coherence intensity of these modes is found to depend quadratically on the magnitude of these distortions away from the planar equilibrium structure (M. Kubo et al., unpublished results).
Figure 12.
NSD analysis in the mass-weighted coordinate space for (A) ferric and (B) ferrous heme proteins (CPO, CYP101, CYP119, HRP, and Mb). The displacement in amu1/2 Å is the square root of the sum of squares of the mass-weighted displacements from planarity for Fe and the 24 porphyrin (4 N and 20 C) atoms. The key out-of-plane modes are denoted as follows: pro, propellering (blue); ruf, ruffling (green); sad, saddling (red); wav(x), wavingx (light blue); wav(y), wavingy (yellow); dom, doming (purple); and invdom, inverse doming (gray). A negative displacement is defined only for doming and inverse doming to indicate the direction of the Fe displacement (+, proximal; -, distal). The PDB entries used to determine the structures are 1CPO, 1DZ4, 1IO9, 1ATJ, 1BZ6, 2J19, 1DZ6, 1H58, and 1BZP for CPO(Fe3+), CYP101(Fe3+), CYP119(Fe3+), HRP(Fe3+), Mb(Fe3+), CPO(Fe2+), CYP101(Fe2+), HRP(Fe2+), and Mb(Fe2+), respectively. The crystal structure for CYP119(Fe2+) is not available.
For ferric CPO, the dominant heme distortion in Figure 12A is found to be doming, and we therefore assign the intense oscillation at 32-33 cm-1 (Table 1) to the doming mode of native CPO. This frequency differs substantially (by ~20%) from the doming frequencies near 39-41 cm-1 observed in histidine-ligated ferric heme species. From Figure 5, we find that CYP101 has a spectrum similar to that of CPO, but with its dominant low-frequency mode upshifted to 36 cm-1. The spectrum of histidine-ligated metMb is also presented in Figure 5, where the major oscillation is upshifted still further to 39 cm-1. HRP and CYP119, on the other hand, have much weaker activity below 50 cm-1. We suggest that the differences in the coherence intensities are due to the different structural distortions imposed on the heme by the surrounding protein matrix. These distortions activate the normally forbidden “soft” OOP heme modes and lead to Raman Franck-Condon coupling that depends on the magnitude of the distortion. The very different spectral content observed in Figure 5 (and Figure 10) is consistent with the different degrees of heme distortion documented in Figure 12.
The NSD analysis of HRP and CYP119 in Figure 12 shows that out-of-plane distortions other than doming, such as saddling and ruffling, are the major contributions needed to reproduce the X-ray structure. For CYP101 and CYP119, the inverse doming mode is also active. This mode involves the motion of the iron out of the heme plane toward the proximal ligand, but with concomitant motion of the pyrrole nitrogens in the opposite direction. In the context of the NSD analysis shown in Figure 12A, the relatively strong activity of the mode at 36 cm-1 in CYP101 (see Figure 5) is somewhat surprising. On the basis of other coherence studies, and in analogy with CPO, we expect this mode also reflects heme doming motion. However, the doming distortion is not the dominant component of the CYP101 NSD analysis shown in Figure 12A. One possible explanation for this has to do with the fact that, along with the protein-induced heme distortion, the relative difference between the force constants in the ground and the resonant excited electronic states also determines the relative intensity of the low-frequency OOP modes (M. Kubo et al., manuscript to be published). Thus, the force constant difference for the doming mode of CYP101 may be relatively larger than for the other low-frequency OOP modes.
Another possibility is suggested by the anomalous (52°) phase of the 36 cm-1 doming mode. Anomalous phase behavior can arise due to ultrafast nonradiative decay through the heme iron d-orbitals. Usually, the excited states of iron porphyrins are very short-lived so that, in the absence of photochemistry, only ground-state coherences are detected. Coherences driven directly by the laser pulse electric fields (Raman processes) are expected to generate displaced vibrational wavepackets with a phase near zero (21, 43). On the other hand, ultrafast nonradiative decay can lead to impulsive forces that are applied selectively to the doming coordinate, resulting in momentum transfer to the ground-state doming mode. These nonradiative forces can alter the phase and enhance the intensity of the doming coherence with respect to other field-driven modes (44).
Turning to the ferrous state, we note that Figure 2 reveals a Soret absorption band for reduced CPO that has several components (located at 409, ~425, and ~440 nm), indicating the coexistence of multiple heme species. For the ferric protein, it is well-established that the central iron atom is bound to a thiolate ligand (12), which has been assigned to Cys29 by biochemical (45) and X-ray crystallography studies (10). However, for the reduced form, the appearance of a Soret band shoulder at approximately 440 nm suggests the possibility of a ligand switching equilibrium, where histidine may also bind to the heme iron atom. The histidine ligation is suggested because the reduced forms of five-coordinate histidine-ligated heme proteins typically absorb near 435-440 nm (46). The addition of an electron to the heme iron, upon reduction of CPO, neutralizes the positive charge of the ferric heme core, and this could conceivably trigger thiolate protonation and/or subsequent rearrangements that lead to a ligand switching equilibrium. Histidine residues are natural axial ligands of the ferrous heme (46), so histidine binding could be responsible for the 440 nm shoulder seen in the Soret region of reduced CPO. There are nine histidine residues in CPO, and three of them are positioned in, or close to, the distal pocket (His101, His105, and His107). Six other histidine residues are placed on the proximal side of the heme but appear to be rather far from the active site. Investigations of ferric chloroperoxidase in alkaline environments (47) have concluded that, as the pH is increased above 7.5, there is a transition to a six-coordinate low-spin species, potentially involving thiolate and imidazole coordination. For the ferrous CPO species in an alkaline solution, data from the same work (47) suggested a bis-imidazole (histidine) coordination structure is responsible for the peak at 425 nm, which becomes dominant as the pH is increased toward 9.5.
The reduced form of CPO displays very strong oscillations in the open band spectrum (Figures 6 and 7), with a dominant mode appearing at 30 cm-1 for 420-425 nm excitation. In contrast, when the excitation wavelength is tuned to the Soret band shoulder at 440 nm, the coherence spectrum changes dramatically and strong modes at 88 and 130 cm-1 are revealed. When the spectra of reduced CPO in Figure 6 (420 nm) and Figure 9 (440 nm) are compared, a mode at 218 cm-1 in the 440 nm spectrum can be discerned that is not present for excitation at 420 nm. The 218 cm-1 frequency is often associated with the Fe-H is stretching mode (46, 48, 49), and this observation supports the hypothesis that two different heme ligands (cysteine and histidine) are involved in a ligand switching equilibrium in the reduced CPO sample. A direct comparison of the coherence and Raman spectra in Figure 9 is difficult because of spectral congestion. Since the solvent contains 50% glycerol, which has significant Raman activity between 200 and 1600 cm-1 and strong modes at 417 and 488 cm-1 (50), the Raman spectrum in Figure 9 is especially hard to interpret. There is less congestion in the open band coherence measurements because the birefringent response of a transparent solvent, such as glycerol, vanishes under open band detection conditions (43, 51). Generally, the presence of the mode near 218 cm-1 that is resonantly coupled to the Soret band shoulder near 440 nm supports the suggestion that a subpopulation of histidine-ligated heme is present in the ferrous state, even at pH 5. (Recall that histidine-ligated ferrous hemes usually have a Soret band near 435-440 cm-1.)
A separate argument for histidine ligation can be made by a close examination of the CO-bound species of CPO. The CO adducts of thiolate-ligated systems show a well-known absorption band near 450 nm, while for histidine-ligated systems, that band is blue-shifted to 420 nm. For CPO-CO, the main absorption band appears, as expected, at 446 nm, but there is also a visible shoulder close to 420 nm (52, 53) that is consistent with the absorption band of histidine-ligated systems. It is clear that reduced CPO has significant structural inhomogeneity, and the most likely explanation is that configurations with two different axial ligands (histidine and cysteine) coexist. Earlier work has explored the formation of the P420 analogue in CPO (denoted as C420), and detailed titration studies at alkaline pH have revealed the presence of complex heme-ligand equilibria (47). We suggest that, even at pH < 5, there is significant conformational inhomogeneity present in the reduced state of CPO, and it likely involves a ligand switching equilibrium between cysteine 29 and one of the (probably distal) histidine residues of the protein. The presence of such an equilibirium in CPO might help to explain the wide variety of chemical reactions that it is capable of catalyzing. Relatively large scale structural changes might be expected, given that CPO is a glycoprotein, and the flexibility and dynamics of this class of proteins frequently play a key role in their biological activity and lead to a wide range of conformations (54).
Another noteworthy observation is the fact that the amplitude of the coherent signal is unusually large when reduced CPO is excited near 440 nm. If we normalize the coherence signal to the sharp coherence coupling “spike” that appears with a zero time delay, the amplitude of the oscillatory signal at 440 nm is 5%. This is significantly larger than the amplitudes of the coherence signals normally observed for heme proteins (typically the signals are ~1% of the coherence coupling feature). Since there is no X-ray structure available for the CPO subspecies absorbing near 440 nm, we are unable to perform a NSD analysis and assign the modes at 88 and 130 cm-1. However, the large intensities suggest that the histidine ligand exchange leaves the heme in a significantly distorted configuration, probably because the histidine is not properly positioned for optimal binding. Moreover, it is conceivable that the modes at 88 and 130 cm-1 are analogous to the two relatively strong modes seen in deoxy-Mb at 98 and 119 cm-1, respectively.
An alternative explanation for the increase in the coherence signal amplitude at 440 nm is that a photolysis reaction is involved. Photolysis is known to occur in bis-histidine heme species (55-57), and the Soret band shoulder at 425 nm has been assigned to a bis-histidine complex (47). The dissociation of one of the two axially ligated histidines would result in a transient deoxy-Mb-like species, absorbing near 440 nm, with a strongly enhanced coherence spectrum that includes the doming mode (40, 58-60), often found near 40 cm-1. Since a strong doming mode is not observed in Figures 8 and 9, we consider this to be a possible, but less likely, scenario than the distorted heme hypothesis discussed above.
To identify possible correlations between axial ligation and the low-frequency spectra in the reduced and oxidized states, we compared the coherence measurements of the cysteine-ligated (CPO, CYP101, and CYP119) and histidine-ligated (Mb and HRP) heme species. The analysis of the results presented in Figures 5 and 10 indicates that there is an axial ligand influence on the low-frequency mode activity. For example, all cysteine-bound heme species we have measured so far display a pair of modes near 30 and 50 cm-1, while the histidine-bound systems usually show strong modes near 40 cm-1. One notable exception from this empirical observation involves the Campylobacter jejuni globin (Cgb), which has a proximal histidine ligand yet displays a pair of modes near 30 and 50 cm-1 analogous to those of the thiolate-bound hemes. However, there is a strong network of hydrogen bonds to the proximal histidine in Cgb (61) that gives it imidazolate character, potentially leading to an electronic effects that mimic the thiolate-bound heme.
The NSD analysis and the significant differences observed in the relative amplitudes of the low-frequency oscillatory components, even under conditions of identical axial ligation and spin state (44), suggest that protein-induced distortions of the heme are primarily responsible for the low-frequency Raman activity and relative intensities. On the other hand, the strength of the axial ligand can also affect the magnitude of the induced distortions by “softening” the heme out-of-plane mode frequencies as previously documented for model complexes (33). For example, compared to water ligation, a histidine axial ligand distorts the heme further along the doming coordinate and weakens the bonds between the iron and the porphyrin nitrogens, leading to a systematic lowering of the heme out-of-plane mode frequencies (33). The thiolate ligand, which presumably forms a stronger bond than histidine, appears to follow the same trend, downshifting the doming mode to ~30 cm-1 from the value of ~40 cm-1 that is typical for histidine. We conclude that the strengthening of the axial ligand leads to softening of the heme out-of-plane force constants and to increased heme distortions that are sensitive to the various protein-induced forces applied to the heme group.
In summary, we have presented a detailed study of the coherence spectra of the native and reduced forms of chloroperoxidase. Both species exhibit significant activity in the low-frequency domain, displaying especially strong vibrational modes near 30 cm-1. On the basis of NSD analysis, we assign this mode to the doming motion of the thiolate-ligated heme. The ferrous CPO sample displays significant spectral inhomogeneity, and we have presented data to support the hypothesis that some fraction of the sample undergoes a ligand switch, from cysteine to histidine, upon reduction. Comparison of the coherence spectra of cysteine- and histidine-bound heme proteins suggests that the axial ligands play a significant role in determining the low-frequency heme vibrational spectrum. This is consistent with previous studies of model heme complexes (33). The differences in the relative amplitudes of various vibrational components are likely related to the size of the heme group distortions induced by the different proteins. The heme force constants that determine its flexibility, and susceptibility to distortion, are evidently affected by the strength of the axial ligand. The classification and assignment of the low-frequency modes of the heme group is an ongoing effort that will be treated further in subsequent work. A better understanding of the mixing between the low-frequency modes of the iron-porphyrin core and its peripheral substituents, as well as with the low-frequency modes of the surrounding protein, will be needed to fully understand the function and dynamics of heme proteins.
Footnotes
This work is supported by grants from the NIH (DK35090) and the NSF (0211816) to P.M.C., the NIH (GM26730) to J.D., the NIH (GM31756) to S.G.S., the NIH (GM57042) to J.T., and the NIH (GM32688) to T.L.P. M.K. is supported by a JSPS postdoctoral fellowship for research abroad.
- CPO
- chloroperoxidase
- NSD
- normal coordinate structural decomposition
- FCS
- femtosecond coherence spectroscopy
- CYP
- cytochrome P450
- HRP
- horseradish peroxidase
- AOM
- acoustooptic modulator
- LIA
- lock-in amplifier
- MEM
- maximum entropy method
- LPSVD
- linear predictive singular-value decomposition
- OOP
- out-of-plane
REFERENCES
- 1.Hollenberg PF, Hager LP. Purification of chloroperoxidase from Caldariomyces fumago. Methods Enzymol. 1978;52:521–529. doi: 10.1016/s0076-6879(78)52057-0. [DOI] [PubMed] [Google Scholar]
- 2.Andersson LA, Dawson JH. EXAFS spectroscopy of heme-containing oxygenases and peroxidases. Struct. Bonding. 1991;64:1–40. [Google Scholar]
- 3.Dawson JH. Probing structure-function relations in heme-containing oxygenases and peroxidases. Science. 1988;240:433–439. doi: 10.1126/science.3358128. [DOI] [PubMed] [Google Scholar]
- 4.Griffin BW. Chloroperoxidase: A Review. CRC Press; Boca Raton, FL: 1991. [Google Scholar]
- 5.Morrison M, Schonbaum GR. Peroxidase-catalyzed halogenation. Annu. Rev. Biochem. 1976;45:861–888. doi: 10.1146/annurev.bi.45.070176.004241. [DOI] [PubMed] [Google Scholar]
- 6.Colonna S, Gaggero N, Richelmi C, Pasta P. Recent biotechnological developments in the use of peroxidases. Trends Biotechnol. 1999;17:163–168. doi: 10.1016/s0167-7799(98)01288-8. [DOI] [PubMed] [Google Scholar]
- 7.Hager LP, Morris DR, Brown FS, Eberwein H. Chloroperoxidase. II. Utilization of halogen anions. J. Biol. Chem. 1966;241:1769–1777. [PubMed] [Google Scholar]
- 8.Morris DR, Hager LP. Chloroperoxidase. I. Isolation and properties of the crystalline glycoprotein. J. Biol. Chem. 1966;241:1763–1768. [PubMed] [Google Scholar]
- 9.Sundaramoorthy M, Terner J, Poulos TL. Stereochemistry of the chloroperoxidase active site: Crystallographic and molecular-modeling studies. Chem. Biol. 1998;5:461–473. doi: 10.1016/s1074-5521(98)90003-5. [DOI] [PubMed] [Google Scholar]
- 10.Sundaramoorthy M, Terner J, Poulos TL. The crystal structure of chloroperoxidase: A heme peroxidase-cytochrome P450 functional hybrid. Structure. 1995;3:1367–1377. doi: 10.1016/s0969-2126(01)00274-x. [DOI] [PubMed] [Google Scholar]
- 11.Yi X, Conesa A, Punt PJ, Hager LP. Examining the role of glutamic acid 183 in chloroperoxidase catalysis. J. Biol. Chem. 2003;278:13855–13859. doi: 10.1074/jbc.M210906200. [DOI] [PubMed] [Google Scholar]
- 12.Bangcharoenpaurpong O, Champion PM, Hall KS, Hager LP. Resonance Raman studies of isotopically labeled chloroperoxidase. Biochemistry. 1986;25:2374–2378. doi: 10.1021/bi00357a011. [DOI] [PubMed] [Google Scholar]
- 13.Champion PM, Munck E, Debrunner PG, Hollenberg PF, Hager LP. Mossbauer investigations of chloroperoxidase and its halide complexes. Biochemistry. 1973;12:426–435. doi: 10.1021/bi00727a011. [DOI] [PubMed] [Google Scholar]
- 14.Dawson JH, Trudell JR, Barth G, Linder RE, Bunnenberg E, Djerassi C, Chiang R, Hager LP. Magnetic circular dichroism studies. 44. Chloroperoxidase. Evidence for P-450 type heme environment from magnetic circular dichroism spectroscopy. J. Am. Chem. Soc. 1976;98:3709–3710. doi: 10.1021/ja00428a055. [DOI] [PubMed] [Google Scholar]
- 15.Lukat GS, Goff HM. Proton and nitrogen-15 NMR spectroscopic studies of hydrogen ion-dependent pseudo-halide ion binding to chloroperoxidase. J. Biol. Chem. 1986;261:16528–16534. [PubMed] [Google Scholar]
- 16.Rutter R, Hager LP, Dhonau H, Hendrich M, Valentine M, Debrunner P. Chloroperoxidase compound I: Electron paramagnetic resonance and Mossbauer studies. Biochemistry. 1984;23:6809–6816. doi: 10.1021/bi00321a082. [DOI] [PubMed] [Google Scholar]
- 17.Stone KL, Behan RK, Green MT. Resonance Raman spectroscopy of chloroperoxidase compound II provides direct evidence for the existence of an iron(IV)-hydroxide. Proc. Natl. Acad. Sci. U.S.A. 2006;103:12307–12310. doi: 10.1073/pnas.0603159103. [DOI] [PMC free article] [PubMed] [Google Scholar]
- 18.Ye X, Ionascu D, Gruia F, Yu A, Benabbas A, Champion P. Temperature dependent dynamics of protoheme: Non-exponential CO rebinding and relaxation in the absence of protein conformational substates. Proc. Natl. Acad. Sci. U.S.A. 2007;104:14682–14687. doi: 10.1073/pnas.0702622104. [DOI] [PMC free article] [PubMed] [Google Scholar]
- 19.Fleming GR, Joo T, Cho M, Zewail AH, Letokhov VS, Marcus RA, Pollak E, Tannor DJ, Mukamel S. Femtosecond chemical dynamics in condensed phases. Adv. Chem. Phys. 1997;101:141–183. [Google Scholar]
- 20.Jonas DM, Bradforth SE, Passino SA, Fleming GR. Femtosecond wavepacket spectroscopy: Influence of temperature, wavelength, and pulse duration. J. Phys. Chem. 1995;99:2594–2608. [Google Scholar]
- 21.Kumar ATN, Rosca F, Widom A, Champion PM. Investigations of Amplitude and Phase Excitation Profiles in Femtosecond Coherence Spectroscopy. J. Chem. Phys. 2001;114:701–724. [Google Scholar]
- 22.Martin JL, Vos MH. Femtosecond biology. Annu. Rev. Biophys. Biomol. Struct. 1992;21:199–222. doi: 10.1146/annurev.bb.21.060192.001215. [DOI] [PubMed] [Google Scholar]
- 23.Mukamel S. Femtosecond optical spectroscopy: A direct look at elementary chemical events. Annu. Rev. Phys. Chem. 1990;41:647–681. [Google Scholar]
- 24.Pollard WT, Dexheimer SL, Wang Q, Peteanu LA, Shank CV, Mathies RA. Theory of dynamic absorption-spectroscopy of nonstationary states. 4. Application to 12-fs resonant impulsive raman-spectroscopy of bacteriorhodopsin. J. Phys. Chem. 1992;96:6147–6158. [Google Scholar]
- 25.Carson EA, Diffey WM, Shelly KR, Lampa-Pastirk S, Dillman KL, Schleicher JM, Beck WF. Dynamic absorption spectral contours: Vibrational phase-dependent resolution of low frequency coherent wave packet motion of IR144 on the ground state and Excited state surfaces. J. Phys. Chem. 2004;108:1489–1500. [Google Scholar]
- 26.Cerullo G, Manzoni C, Luer L, Polli D. Time-resolved methods in biophysics. 4. Broadband pump-probe spectroscopy system with sub-20 fs temporal resolution for the study of energy transfer processes in photosynthesis. Photochem. Photobiol. Sci. 2007;6:135–144. doi: 10.1039/b606949e. [DOI] [PubMed] [Google Scholar]
- 27.Delfino I, Manzoni C, Sato K, Dennison C, Cerullo G, Cannistraro S. Ultrafast pump-probe study of excited-state charge-transfer dynamics in umecyanin from horseradish root. J. Phys. Chem. B. 2006;110:17252–17259. doi: 10.1021/jp062904y. [DOI] [PubMed] [Google Scholar]
- 28.Wang Q, Schoenlein RW, Peteanu LA, Mathies RA, Shank CV. Vibrationally coherent photochemistry is the femtosecond primary event of vision. Science. 1994;266:422–424. doi: 10.1126/science.7939680. [DOI] [PubMed] [Google Scholar]
- 29.Denisov IG, Hung SC, Weiss KE, McLean MA, Shiro Y, Park SY, Champion PM, Sligar SG. Characterization of the oxygenated intermediate of the thermophilic cytochrome P450 CYP119. J. Inorg. Biochem. 2001;87:215–226. doi: 10.1016/s0162-0134(01)00328-2. [DOI] [PubMed] [Google Scholar]
- 30.Maves SA, Sligar SG. Understanding thermostability in cytochrome P450 by combinatorial mutagenesis. Protein Sci. 2001;10:161–168. doi: 10.1110/ps.17601. [DOI] [PMC free article] [PubMed] [Google Scholar]
- 31.Nagano S, Tosha T, Ishimori K, Morishima I, Poulos TL. Crystal structure of the cytochrome p450cam mutant that exhibits the same spectral perturbations induced by putidaredoxin binding. J. Biol. Chem. 2004;279:42844–42849. doi: 10.1074/jbc.M404217200. [DOI] [PubMed] [Google Scholar]
- 32.Schlichting I, Berendzen J, Chu K, Stock AM, Maves SA, Benson DE, Sweet RM, Ringe D, Petsko GA, Sligar SG. The catalytic pathway of cytochrome p450cam at atomic resolution. Science. 2000;287:1615–1622. doi: 10.1126/science.287.5458.1615. [DOI] [PubMed] [Google Scholar]
- 33.Gruia F, Ye X, Ionascu D, Kubo M, Champion P. Low frequency spectral density of ferrous heme: Perturbations induced by axial ligation and protein insertion. Biophys. J. 2007;93:4404–4413. doi: 10.1529/biophysj.107.114736. [DOI] [PMC free article] [PubMed] [Google Scholar]
- 34.Gruia F, Kubo M, Ye X, Ionascu D, Lu C, Poole RK, Yeh SR, Champion P. Coherence Spectroscopy Investigations of the Low-Frequency Vibrations of Heme: Effects of Protein-Specific Perturbations. J. Am. Chem. Soc. 2008;130:5231–5244. doi: 10.1021/ja7104027. [DOI] [PMC free article] [PubMed] [Google Scholar]
- 35.Jentzen W, Ma JG, Shelnutt JA. Conservation of the conformation of the porphyrin macrocycle in hemoproteins. Biophys. J. 1998;74:753–763. doi: 10.1016/S0006-3495(98)74000-7. [DOI] [PMC free article] [PubMed] [Google Scholar]
- 36.Ye X, Yu A, Champion PM. Dynamics of nitric oxide rebinding and escape in horseradish peroxidase. J. Am. Chem. Soc. 2006;128:1444–1445. doi: 10.1021/ja057172m. [DOI] [PMC free article] [PubMed] [Google Scholar]
- 37.Negrerie M, Berka V, Vos MH, Liebl U, Lambry JC, Tsai AL, Martin JL. Geminate recombination of nitric oxide to endothelial nitric-oxide synthase and mechanistic implications. J. Biol. Chem. 1999;274:24694–24702. doi: 10.1074/jbc.274.35.24694. [DOI] [PubMed] [Google Scholar]
- 38.Vos MH. Ultrafast dynamics of ligands within heme proteins. Biochim. Biophys. Acta. 2008;1777:15–31. doi: 10.1016/j.bbabio.2007.10.004. [DOI] [PubMed] [Google Scholar]
- 39.Schomacker KT, Bangcharoenpaurpong O, Champion PM. Investigations of the Stokes and anti-Stokes resonance raman-scattering of cytochrome-c. J. Chem. Phys. 1984;80:4701–4717. [Google Scholar]
- 40.Rosca F, Kumar ATN, Ionascu D, Ye X, Demidov AA, Sjodin T, Wharton D, Barrick D, Sligar SG, Yonetani T, Champion PM. Investigations of Anharmonic Low-Frequency Oscillations in Heme Proteins. J. Phys. Chem. A. 2002;106:3540–3552. [Google Scholar]
- 41.Shelnutt JA. Normal-coordinate structural decomposition and the vibronic spectra of porphyrins. J. Porphyrins Phthalocyanines. 2001:300–311. [Google Scholar]
- 42.Song Y, Haddad RE, Jia SL, Hok S, Olmstead MM, Nurco DJ, Schore NE, Zhang J, Ma JG, Smith KM, Gazeau S, Pecaut J, Marchon JC, Medforth CJ, Shelnutt JA. Energetics and structural consequences of axial ligand coordination in nonplanar nickel porphyrins. J. Am. Chem. Soc. 2005;127:1179–1192. doi: 10.1021/ja045309n. [DOI] [PubMed] [Google Scholar]
- 43.Kumar ATN, Rosca F, Widom A, Champion PM. Investigations of ultrafast nuclear response induced by resonant and nonresonant laser pulses. J. Chem. Phys. 2001;114:6795–6815. [Google Scholar]
- 44.Gruia F, Kubo M, Ye X, Champion P. Investigations of vibrational coherence in the low frequency region of ferric heme proteins. Biophys. J. 2007;94:2252–2268. doi: 10.1529/biophysj.107.122119. [DOI] [PMC free article] [PubMed] [Google Scholar]
- 45.Blanke SR, Hager LP. Identification of the fifth axial heme ligand of chloroperoxidase. J. Biol. Chem. 1988;263:18739–18743. [PubMed] [Google Scholar]
- 46.Kitagawa T. In: Biological Applications of Raman Spectroscopy. Spiro TG, editor. Wiley-Interscience Publications; New York: 1988. pp. 97–131. [Google Scholar]
- 47.Blanke SR, Martinis SA, Sligar SG, Hager LP, Rux JJ, Dawson JH. Probing the heme iron coordination structure of alkaline chloroperoxidase. Biochemistry. 1996;35:14537–14543. doi: 10.1021/bi961512m. [DOI] [PubMed] [Google Scholar]
- 48.Uchida T, Ishikawa H, Ishimori K, Morishima I, Nakajima H, Aono S, Mizutani Y, Kitagawa T. Identification of histidine 77 as the axial heme ligand of carbonmonoxy CooA by picosecond time-resolved resonance Raman spectroscopy. Biochemistry. 2000;39:12747–12752. doi: 10.1021/bi0011476. [DOI] [PubMed] [Google Scholar]
- 49.Wang W, Ye X, Demidov AA, Rosca F, Sjodin T, Cao W, Sheeran M, Champion PM. Femtosecond Multi-Color Pump-Probe Spectroscopy of Ferrous Cytochrome c. J. Phys. Chem. B. 2000;104:10789–10801. [Google Scholar]
- 50.Mendelovici E, Frost RL, Kloprogge T. Cryogenic Raman spectroscopy of glycerol. J. Raman Spectrosc. 2000;31:1121–1126. [Google Scholar]
- 51.Ziegler LD, Fan R, Desrosiers AE, Scherer NF. Femtosecond polarization spectroscopy: A density-matrix description. J. Chem. Phys. 1994;100:1823–1839. [Google Scholar]
- 52.Hollenberg PF, Hager LP. The P-450 nature of the carbon monoxide complex of ferrous chloroperoxidase. J. Biol. Chem. 1973;248:2630–2633. [PubMed] [Google Scholar]
- 53.Yi X, Mroczko M, Manoj KM, Wang X, Hager LP. Replacement of the proximal heme thiolate ligand in chloroperoxidase with a histidine residue. Proc. Natl. Acad. Sci. U.S.A. 1999;96:12412–12417. doi: 10.1073/pnas.96.22.12412. [DOI] [PMC free article] [PubMed] [Google Scholar]
- 54.Allen Bush C, Martin-Pastor M. Structure and conformation of complex carbohydrates of glycoproteins, glycolipids and bacterial polysaccharides. Annu. Rev. Biophys. Biomol. Struct. 1999;28:269–293. doi: 10.1146/annurev.biophys.28.1.269. [DOI] [PubMed] [Google Scholar]
- 55.Jongeward KA, Magde D, Taube DJ, Traylor TG. Picosecond kinetics of cytochromes b5 and c. J. Biol. Chem. 1988;263:6027–6030. [PubMed] [Google Scholar]
- 56.Kriegl JM, Bhattacharyya AJ, Nienhaus K, Deng P, Minkow O, Nienhaus GU. Ligand binding and protein dynamics in neuroglobin. Proc. Natl. Acad. Sci. U.S.A. 2002;99:7992–7997. doi: 10.1073/pnas.082244399. [DOI] [PMC free article] [PubMed] [Google Scholar]
- 57.Yamashita T, Bouzhir-Sima L, Lambry JC, Liebl U, Vos MH. Ligand Dynamics and Early Signaling Events in the Heme Domain of the Sensor Protein Dos from Escherichia coli. J. Biol. Chem. 2008;283:2344–2352. doi: 10.1074/jbc.M708123200. [DOI] [PubMed] [Google Scholar]
- 58.Rosca F, Kumar ATN, Ye X, Sjodin T, Demidov AA, Champion PM. Investigations of coherent vibrational oscillations in myoglobin. J. Phys. Chem. 2000;104:4280–4290. [Google Scholar]
- 59.Liebl U, Lipowski G, Negrerie M, Lambry JC, Martin JL, Vos MH. Coherent reaction dynamics in a bacterial cytochrome c oxidase. Nature. 1999;401:181–184. doi: 10.1038/43699. [DOI] [PubMed] [Google Scholar]
- 60.Zhu LY, Sage JT, Champion PM. Observation of Coherent Reaction Dynamics in Heme-Proteins. Science. 1994;266:629–632. doi: 10.1126/science.7939716. [DOI] [PubMed] [Google Scholar]
- 61.Lu C, Mukai M, Lin Y, Wu G, Poole RK, Yeh SR. Structural and functional properties of a single-domain hemoglobin from the food-borne pathogen campylobacter jejuni. J. Biol. Chem. 2007;282:25917–25928. doi: 10.1074/jbc.M704415200. [DOI] [PubMed] [Google Scholar]


