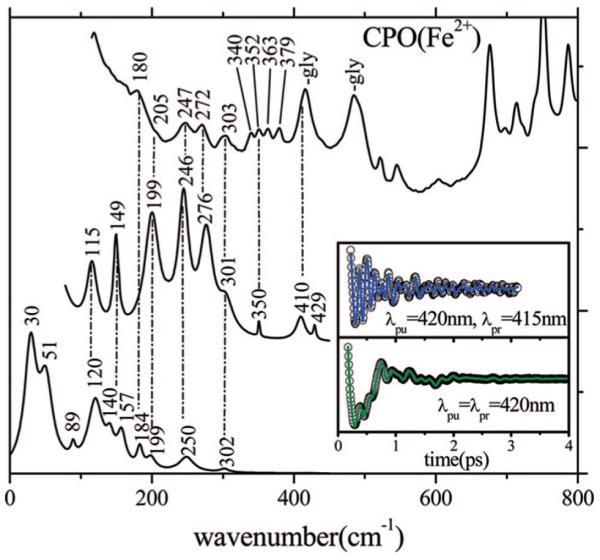
Figure 6.

Correlations between the resonance Raman and coherence spectra of ferrous CPO. The top trace is the Raman spectrum measured with a 413.1 nm excitation wavelength. The middle trace is the detuned coherence spectrum (the inset shows the coherent oscillations and LPSVD fit). The bottom trace is the open band coherence spectrum, and the inset again shows the coherent oscillations and LPSVD fit under this condition. The coherence spectra were measured using 420 nm excitation. The dispersed data were measured with a 0.5 nm spectral window, detuned 5 nm to the blue of the carrier frequency maximum (i.e., λpr = 415 nm).
