Abstract
AIMS
To model the basic pharmacokinetic (PK) characteristics of maraviroc to construct an integrated semi-mechanistic PK model for use in later population PK analyses.
METHODS
Three analyses were performed utilizing intravenous, oral and radiolabel data. Firstly, a PK disposition model was developed from data from 20 healthy males who received 3, 10 or 30 mg of intravenous maraviroc. Secondly, a sigmoid Emaxvs dose model of dose-normalized non-compartmental AUC from oral dosing in 134 healthy young males and females across five phase 1 studies was constructed. This described absorption dose non-linearities and tested for the influence of food, formulation and dose frequency on model parameters. The third analysis developed a mass balance model for both absorption and disposition of maraviroc with 300 mg solution and predicted the mass balance after administration of 100 mg tablet formulation.
RESULTS
A four-compartment PK model best described the intravenous data and no influence of dose was found on clearance. Total clearance was 48 l h−1 (2.2% SE). The main covariate effect in the non-compartmental analysis reproduced the dose-dependency of food through a five-fold increase in the ED50 of the sigmoid Emax model. The mass balance models calculated that 33.3% and 22.9% of 300 mg solution and 100 mg tablet doses, respectively, are systemically available, and first-pass metabolism extracts 62% of an absorbed dose, estimating a hepatic blood flow of 101 l h−1.
CONCLUSIONS
The analysis demonstrates a novel integration approach to build a maraviroc semi-mechanistic population PK model for further use in volunteers and patients.
Keywords: maraviroc, NONMEM, semi-mechanistic pharmacokinetic model
WHAT IS ALREADY KNOWN ABOUT THIS SUBJECT
The non-compartmental pharmacokinetics of maraviroc have been published for a number of phase 1 studies (including mass balance) but there has been no previous attempt to integrate the results into a model that is of utility beyond phase 1.
WHAT THIS STUDY ADDS
This study provides a novel approach for pooling phase 1 non-compartmental data (normalized AUC) and assessing the influence of key covariates for drugs with non-linear/complex absorption patterns. We show a detailed example of how data may be integrated from a number of studies/sources in early drug development to construct semi-mechanistic pharmacokinetic models (partitioning absorption and extraction components) for later phase applications (population pharmacokinetics and pharmacokinetics/pharmacodynamics).
Introduction
Maraviroc is a potent reversible and selective antagonist of the human chemokine CCR5 receptor [1]. It reduces viral load in individuals positive for CCR5-tropic HIV-1, after monotherapy [2] and in combination therapy in treatment-experienced patients [3].
A common challenge faced in the development of new antiretroviral agents is the issue of characterizing not only the pharmacokinetics (PK) of a new compound but also predicting the consequences of complex drug–drug interactions necessitated by combination therapy used in HIV treatment [4, 5]. In this setting descriptive, and also predictive, PK models may be useful. Thus, the development of an integrated semi-mechanistic PK model for maraviroc was driven by the following early observations of its PK behaviour. In dose escalation studies, supraproportional increases in area under the plasma profile curve (AUC) were seen with oral doses (geometric mean normalized AUC, NAUC, 0.7–9.5 ng ml−1 mg−1 h over 3–1200 mg solution) [6] but not after intravenous (iv) administration [7], indicating non-linearity in absorption. Maraviroc is a substrate for CYP3A4 enzymes [8, 9] and the membrane transporter P-glycoprotein (Pgp) [9] which is thought to limit the absorption of many compounds [10]. Many antiretroviral drugs would therefore be expected to affect the absorption of maraviroc by induction/inhibition of Pgp (and other transporters) and/or CYP3A4, leading to changes in non-renal clearance that affect both first-pass and subsequent metabolism. In addition, administration of oral maraviroc with a high-fat meal caused a dose-related reduction in both maximum concentration (Cmax) and AUC, with greater reduction seen with low doses (43% at 100 mg and 25% at 600 mg tablet) [11].
The PK and PK/pharmacodynamic (PD) modelling strategy for maraviroc was therefore planned in a systematic manner in order to build and learn from early analyses. Figure 1 shows the overall modelling scheme for the whole programme. This paper describes the detailed processes used to integrate the iv data (Box 1) and non-compartmental (NCA) solution and tablet data (Box 2) with the mass balance solution data (Box 3). Together with the maraviroc blood : plasma partition ratio (rB), this provided the basis for the semi-physiological first-pass partition model parameterized to separate out absorption and clearance components on bioavailability used in the pooled population PK analysis of the phase 1/2a tablet data (Box 4) previously reported [11] and subsequently used for modelling of the sparse data from phase 2b/3 studies (Boxes 6 and 7) [12, 13] for PK and PK/PD purposes (Boxes 8 and 9) [14–16].
Figure 1.

Schematic representation of the interdependencies of maraviroc PK and PK/PD modelling
This paper therefore presents the methodology used in the first three model-based analyses (Boxes 1–3, Figure 1). The first analysis is a compartmental analysis of iv data only; the second analysis describes the absorption non-linearities with respect to dose and the interplay with food and formulation on the NCA-derived AUC; the third analysis develops a mass balance model that relies on the results from the first two analyses and completes the generation of the semi-physiological parameters for further use.
For a list of abbreviations and definitions of terms used in this paper, see Table A1.
Methods
Studies
Approval from local ethics committees was obtained for all studies and informed consent was obtained from all subjects. Details of studies are shown in Table 1.
Table 1.
Overview of maraviroc studies included in the current analyses
| Analysis | Studies | Design | Doses | Single/ Multiple Dosing | Solution/ Tablet | Fed/ Fasted | n* | Age (years) | Weight (kg) | Reference |
|---|---|---|---|---|---|---|---|---|---|---|
| Population iv only | A4001009 | Open, ascending iv solution; absolute oral bioavailability of tablet 100 mg vs iv 30 mg | 3, 10 and 30 mg iv over 1 h; 100 mg oral | Single | Solution iv Tablet oral | Fasted | 20 | 22–42 | 65–93 | [7] |
| Non-compartmental NAUC | A4001001 | Double-blind, placebo controlled, four-way crossover, dose escalation, fasted, solution. 100 mg solution with food in a non-randomized fifth period | Cohort A 1, 10, 100, 900 mg fasted and 100 mg fed. Cohort B 3, 30, 300, 1200 mg fasted | Single | Solution | Fasted and Fed Fasted | 24 | 21–45 | 61–93 | [6] |
| A4001003 | Open, randomized, five-way crossover, | 50, 100, 600 mg 600 mg 100 mg | Single | Tablet Tablet Solution | Fasted Fed Fasted | 15 | 20–44 | 63–99 | [11] | |
| A4001004 | Randomized, single dose, fed and fasted, incomplete block, five-way crossover to investigate the effects of timing of food intake; data from only fasted and when food was administered simultaneously with dose | 100 mg | Single | Solution | Fasted and fed | 15 | 20–45 | 71–100 | [11] | |
| A4001002 | Double-blind, placebo-controlled, single and multiple escalating dose study in six parallel cohorts | 3, 10, 25, 100, 300 mg twice daily solution; 600 mg once daily tablet | Single/ Multiple | Solution twice daily Tablet once daily | Fasted | 55 | 18–41 | 59–93 | [6] | |
| A4001019 | Double-blind, placebo-controlled, multiple dose tablet escalation in three parallel cohorts | 300 mg twice daily then 600 mg twice daily; 600 mg twice daily then 900 mg twice daily; 900 mg once daily then 1200 mg once daily; | Multiple | Tablet | Fasted | 27 | 18–44 | 61–89 Males 50–86 Females | [6] | |
| Mass balance | A4001010 | Metabolism and excretion following administration of oral 300 mg solution of [14C]-maraviroc | 300 mg | Single | Solution | Fasted | 3 | 45–53 | 82–85 | [7] |
n is the number of subjects with contributing data.
Maraviroc concentrations were measured using solid phase extraction chromatography followed by liquid chromatography with tandem mass spectrometric detection (LC-MS-MS) in all studies. The lower limit of quantification was 0.5 ng ml−1. The radiometric analysis of the mass balance study has been previously reported [7].
Key assumption
A key assumption in this paper is that at low intestinal concentrations of maraviroc, Pgp (and possibly other transporters) mediate efflux of maraviroc back into the lumen of the small intestine, thereby limiting maraviroc absorption, resulting in reduced bioavailability and exposure. As the dose of maraviroc increases and concentrations in the gut lumen increase, Pgp/transporter efflux may become saturated and reduce the ability to limit bioavailability. A similar mechanism has been suggested for other compounds exhibiting non-proportional PK [10]. This mechanism would also account for the dose-dependent food effect where food may extend dissolution and thus dilute maraviroc, making it more susceptible to back efflux. A semi-mechanistic view of the non-linear absorption process is shown in Appendix A.
Data analysis
Iv plasma concentration vs time data were logarithmically transformed prior to analysis using non-linear mixed-effects modelling with NONMEM software, version V level 1.1 [17]. The FOCE method with INTERACTION was used.
The dose-normalized NCA-derived parameters were also logarithmically transformed prior to analysis with NONMEM; again the FOCE method with INTERACTION was used.
The development of the mass balance model used equations implemented in S-PLUS®[18].
Model development for intravenous data
The iv data analysis used 473 observations from 20 male subjects. Two-, three- and four-compartment models were fitted to the data using the general linear compartmental NONMEM subroutine ADVAN7. Intersubject variability in all the PK parameters was modelled in exponential form; proportional residual variability was modelled using additive form on log transformed data.
After selection of the best compartmental model, dose linearity was checked by evaluating the effect of dose as two categorical covariates. Model evaluation was performed by conducting a predictive check. One-hundred datasets were simulated using the final iv model data structure including intersubject and residual variability. Plots of median and 95% confidence intervals of simulated concentrations vs time by dose together with the original concentrations were generated to check that the distribution of data was reasonably contained within the confidence intervals. Further, bootstrap estimates for the parameters were generated from 1000 runs. The bootstrap distributions were compared with the NONMEM population parameters and standard errors.
Model development for non-compartmental data
The analysis was carried out on individual NCA AUC results from 134 healthy young male and female individuals across five single-centre phase 1 studies.
A sigmoid Emax model was fitted to the individual dose-normalized AUC (NAUC; AUC/dose where AUC is the area to infinity for a single dose and over the dosing interval for steady state multiple dosing) data in order to derive a parametric model that described the effects of dose, food, formulation (solution and immediate-release tablet) and QD or BID steady state on the NCA PK parameters of maraviroc. The sigmoid Emax model was chosen a priori because of obvious non-linearity with dose after oral administration seen during exploratory graphical analysis (Figure 2). The form of the model is shown below.
Figure 2.
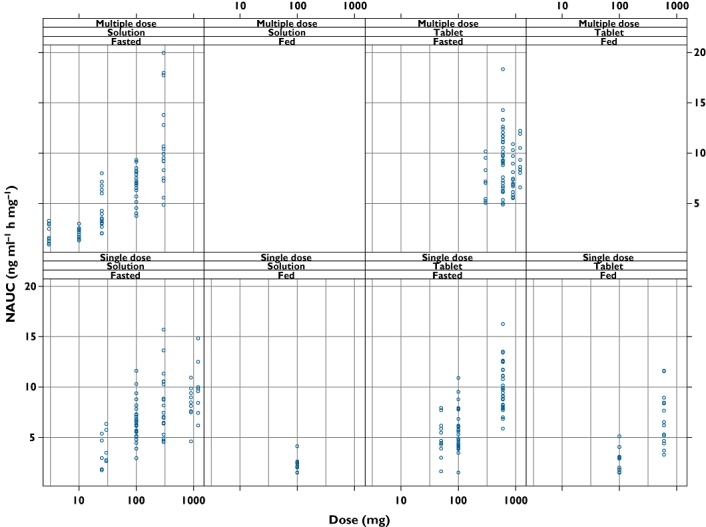
Individual NAUC data values used in the non-compartmental analysis plotted by covariates food, formulation, single and multiple (once daily and twice daily combined) dosing
 |
(1) |
NAUC0 is the NAUC at approach to zero dose, NAUCmax the NAUC at infinite dose, ED50 the dose giving half-maximal change in NAUC and γ the Hill coefficient defining the steepness of the dose–NAUC relationship. Intersubject variability was included exponentially on the NAUCmax parameter alone. Residual variability was modelled as combined additive and proportional on log transformed NAUC.
The reference model for covariate evaluation was single dose, solution, given under fasted conditions. Constraints were placed on the covariate effects to comply with the model assumptions that tablet NAUC could never be greater than solution NAUC and that fed NAUC could never be greater than fasted NAUC. A model of the absorption process indicating the reasoning for the assumptions is shown in Appendix A.
Model development for mass balance data
The aim was to develop a model that described the mass balance of maraviroc after oral administration of 300 mg as a solution formulation and to predict the balance at other (tablet) doses. The primary experimental mass balance data of total maraviroc and radioactivity recovered in urine and faeces have been reported [7] and are shown in Table 2. The reported values were scaled by 100/96 to account for the total recovery of 96%. The disposition of maraviroc and metabolites after absorption was assumed to be linear, including first-pass metabolism/clearance; the CL was 48.0 l h−1 (taken from the iv analysis presented herein) and renal clearance (CLR) was assumed to be 12 l h−1, exactly one-quarter of the CL, approximating the fraction obtained from the report of the iv study [7]. Also, the absorption of maraviroc at 300 mg solution was obtained from the NAUC analysis presented herein. Finally, the blood : plasma partition ratio (rB) of 0.59 for maraviroc obtained from in vitro partitioning, consistent with early radioactivity rB observations in the mass balance study [7], was used to derive a liver blood flow (QH,B) necessary for later PK analyses (Figure 1, Boxes 4–9).
Table 2.
Mass balance data from three males dosed with 300 mg solution (% dose)
| Reported [7] (%) | Scaled to 100%* | |
|---|---|---|
| Radioactivity in urine | 19.6 | |
| Maraviroc in urine | 8.0 | 8.33 |
| Metabolites in urine (calculated by difference) | (11.6) | 12.08 |
| Radioactivity in faeces | 76.4 | |
| Maraviroc in faeces | 25.3 | 26.4 |
| Metabolites in faeces (calculated by difference) | (51.1) | 53.2 |
| Total radioactivity | 96.0 | 100 |
Reported or calculated difference values multiplied by 100/96 to account for average radioactive recovery of 96%.
Given the above data, mass balance equations were used to apportion the relative fractions of parent maraviroc and (combined) metabolites to various pathways, including first-pass extraction (E), renal (rR), metabolic (rM) and other (rS). The application of assumptions, equations and calculations are described in detail in Appendix B1 for a 300 mg oral solution of maraviroc. The results are shown in Figure 3.
Figure 3.
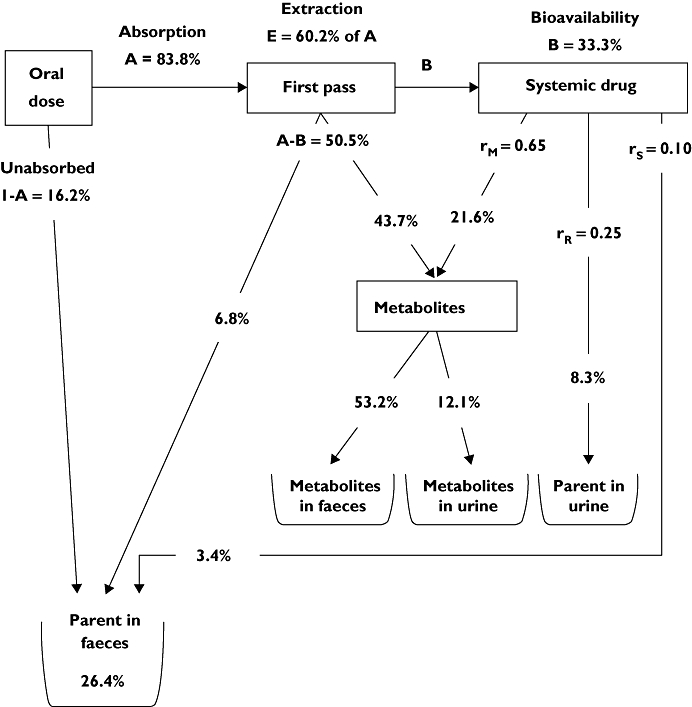
The mass balance model for maraviroc after administration of 300 mg in solution
Predictions
The mass balance model fractions were then used to calculate the mass balance for administration of a 100 mg tablet of maraviroc, by using a predicted absorption value of 57.45% (A) for a 100 mg tablet from the NCA analysis described herein. The reverse calculation is shown in Appendix B2.
The extraction value E (0.602) was further used, together with the rB of 0.59 (indicating maraviroc is essentially confined to plasma), to place the extraction in a semi-physiological context using standard equations below, where CLH,B is hepatic blood clearance, CLH, hepatic plasma clearance, QH,B hepatic blood flow and QH hepatic plasma flow.
 |
(2) |
 |
(3) |
Sensitivity checks
The sensitivity of the mass balance model results was tested by recalculation of all parameters after varying CL, CLR and the assumed absorption of 300 mg solution.
Results
Intravenous data model
A four-compartment disposition model was found to best describe the data and was 106 points lower in objective function value than the three-compartment model. This in turn was 724 points lower in objective function value than the two-compartment model. Parameter estimates are presented in Table 3. Goodness-of-fit plots for the final model showed that the model was a good description of the data (Figure 4).
Table 3.
Maraviroc population PK parameter estimates and bootstrap values after iv administration of 3, 10 and 30 mg as a 1 h infusion
| Parameter | Estimate | % SE | Bootstrap mean | Bootstrap % CV |
|---|---|---|---|---|
| CL (l h−1) | 48.0 | 2.2 | 48.2 | 2.2 |
| V1 (l) | 13.5 | 14.4 | 12.2 | 21.3 |
| Q2 (l h−1) | 35.4 | 15.3 | 39.6 | 22.2 |
| V2 (l) | 16.1 | 10.5 | 16.5 | 13.0 |
| Q3 (l h−1) | 9.13 | 4.8 | 9.3 | 4.9 |
| V3 (l) | 140 | 5.8 | 142.7 | 6.7 |
| Q4 (l h−1) | 16.8 | 8.9 | 17.7 | 8.6 |
| V4 (l) | 36.4 | 4.0 | 36.8 | 4.5 |
| η CL (%) | 10.8 | 11.2 | 10.5 | 12.7 |
| ηV1 (%) | 25.6 | 22.5 | 30.3 | 35.1 |
| ηV2 (%) | 18.0 | 37.8 | 18.1 | 47.5 |
| η Q3 (%) | 18.8 | 19.5 | 18.5 | 21.0 |
| ηV3 (%) | 16.9 | 23.7 | 14.3 | 34.9 |
| Residual (%) | 10.9 | 7.1 | 10.1 | 6.9 |
Figure 4.
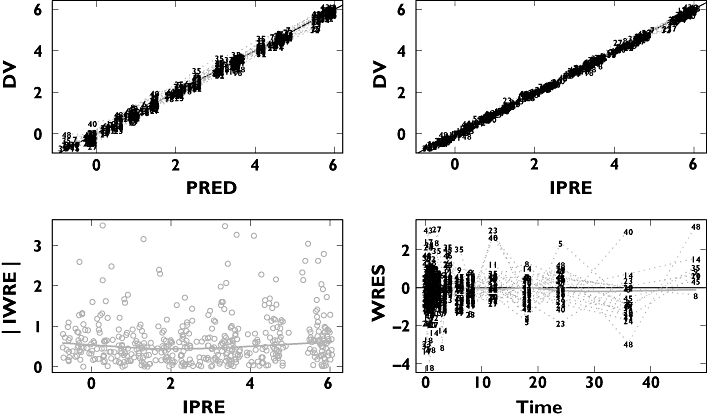
Basic goodness-of-fit plots for the four-compartment model
No influence of dose on CL was found over the 3–30 mg range when administered intravenously. The mean half-lives associated with the four phases of elimination (calculated from empirical Bayesian estimates of individual parameter values) were 0.08, 0.49, 2.03 and 12.9 h. The percentages of the area under each of the above phases were 36%, 23%, 23% and 18%, respectively. Although the 5 min distribution phase accounted for the largest percentage, the 18% terminal phase accounted for the majority of accumulation on multiple dosing.
The predictive check shown in Figure 5 (30 mg iv dose only) and bootstrap parameter values (Table 3) both showed that the model was a good description of the data.
Figure 5.
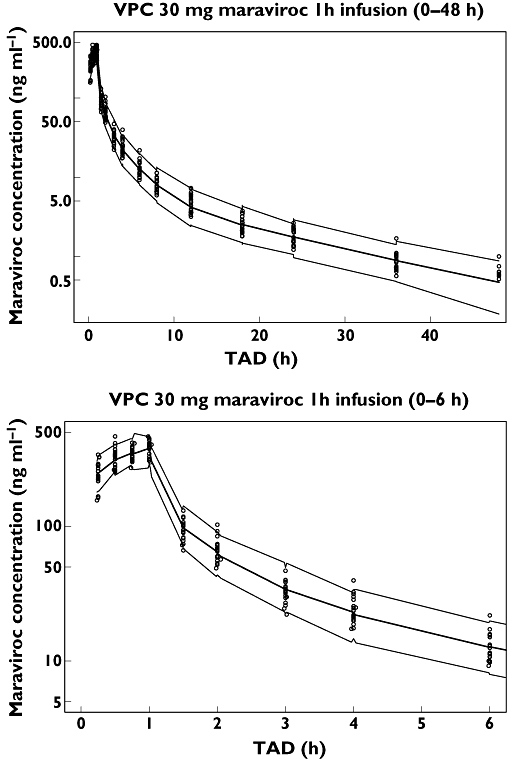
Predictive check for the 30 mg iv dose. Median and 95% CI simulation (n = 100) (—); Data (○)
Non-compartmental data model
Goodness-of-fit plots for the NAUC model are shown in Figure 6, illustrating that the model gave an adequate fit. Maraviroc predicted single dose NAUC vs dose for all treatments is shown in Figure 7. The non-linearity appeared to be less severe at doses of 300 mg and greater. Tablet bioavailability appeared to be close to solution with the dose effect of food (high-fat meal taken simultaneously with dose) apparent and the abolition of the tablet/solution differences under fed conditions was observed. Multiple dosing gave a very similar sequence of plots and the model allowed prediction of food effects, for example, under multiple dosing at doses not included in the studies.
Figure 6.
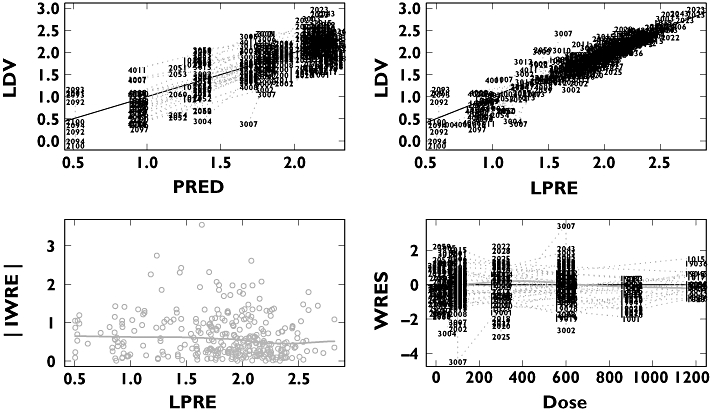
Basic goodness-of-fit plots for the NAUC
Figure 7.
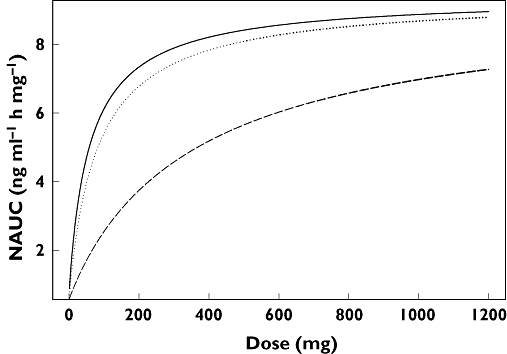
Maraviroc predicted single dose NAUC vs dose for solution and tablet, fasted and fed. Solution fasted (—); Tablet fasted ( ); Solution and tablet fed (- - -)
Under the key further assumption that the Emax of the NAUC model represents 100% absorption (with first-pass effects assumed to be independent of dose), the ratio of predicted NAUC at any dose to Emax represents the absolute absorption fraction. For further use in the mass balance analysis in particular, for 300 mg fasted solution the predicted absorption is 83.8% and for 100 mg fasted tablet the predicted absorption is 57.45%. Allowing a pragmatic possibility that the single dose absorption may be only 90% complete, predicted absorption of 300 mg solution would be 75.4% and 100 mg tablet would be 51.7%.
Mass balance data model
The calculated/predicted mass balance after administration of a 100 mg tablet of maraviroc is shown in Figure 8. Using the predicted mass balance model, the absolute bioavailability of a 100 mg tablet is calculated to be 22.9%, in good agreement with the actual value of 23.1% (95% CI 19.2, 27.8) observed in the absolute bioavailability iv/oral crossover cohort of Study A1001009, comparing 30 mg iv with 100 mg oral tablet [7].
Figure 8.
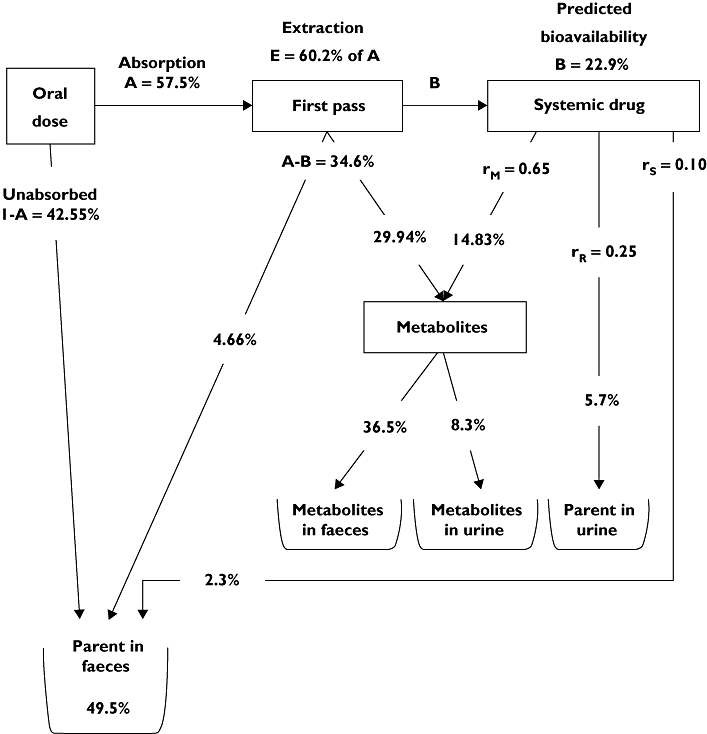
The predicted mass balance model for maraviroc after administration of a 100 mg tablet
Using CLR values of 11, 12 and 13 l h−1 with an unchanged CL of 48 l h−1 or changed to 44 l h−1, to explore the sensitivity of the assumptions, led to corresponding changes in the clearance ratios, E, bioavailability and QH,B. A further exploration of the sensitivity was made by assuming that the maximum possible absorption (at infinite dose) from the NAUC analysis results was only 90% rather than 100%. This was processed using the main values of CLR 12 l h−1 and CL of 48 l h−1 (termed ‘reference values’). Table 4 shows the more important results, with the reference values in the second row.
Table 4.
Sensitivity of the mass balance values to changes in assumed clearances and absorption
| A300* (%) | A100* (%) | CL (l h−1) | CLR (l h−1) | rR† (%) | rH† (%) | rM† (%) | rS† (%) | E (%) | Bio300‡ (%) | Bio100‡ (%) | QH,B§ (l h−1) |
|---|---|---|---|---|---|---|---|---|---|---|---|
| 83.8 | 57.45 | 48 | 13 | 27.1 | 72.9 | 63.1 | 9.8 | 63.3 | 30.8 | 21.1 | 94 |
| 83.8¶ | 57.45 | 48 | 12 | 25.0 | 75.0 | 64.9 | 10.1 | 60.2 | 33.3 | 22.9 | 101 |
| 83.8 | 57.45 | 48 | 11 | 22.9 | 77.1 | 66.7 | 10.4 | 56.6 | 36.4 | 24.9 | 111 |
| 83.8 | 57.45 | 44 | 11 | 25.0 | 75.0 | 64.9 | 10.1 | 60.2 | 33.3 | 22.9 | 93 |
| 75.4 | 51.7 | 48 | 12 | 25.0 | 75.0 | 73.0 | 2.0 | 55.8 | 33.3 | 22.9 | 109 |
A300 and A100 are percentages absorbed of 300 mg solution and 100 mg tablet, respectively.
rR is renal fraction, rH is total hepatic fraction, rM is metabolic fraction and rS is residual hepatic fraction, of total clearance.
Bio300 and Bio100 are absolute bioavailabilities of 300 mg solution and 100 mg tablet, respectively.
QH,B is liver blood flow calculated from blood : plasma ratio of 0.59, E, CL and CLR (see Appendix B1 and equations 2 and 3 of the text).
Row 2 values are the original parameters.
Relative to the reference values, the bioavailability at 300 mg (BIO300) and 100 mg (BIO100) change by about 10%, in rough proportion to the sensitivity changes made. All the estimates of the absolute bioavailability of the 100 mg tablet are well within the 95% CI of 19.2, 27.8 for the observed value of absolute bioavailability [7]. Estimates of first-pass extraction, E, range from 56% to 63% with the lower assumed fraction of CLR to CL leading to a lower extraction, as expected.
The use of reported NCA values for CL and CLR (44 and 11 l h−1, respectively, [7, Table 2]), shown in the fourth row of Table 4, with the same clearance ratio of 0.25 as the reference row, produces identical parameters except for QH,B, which is reduced by about 10%.
The use of 90% absorption values, last row of Table 4, compared with the reference row, gave identical F300 and F100 values. Most parameters changed by approximately 10%, with the exception of rS, the fraction secreted directly, which was reduced to only 2.0% from its original 10.1%. Further reduction in absorption would make this an impossible negative value. This is the major sensitivity in the analysis that alters the relative amounts of hepatic clearance that proceed by the metabolic route and the directly excreted route.
Discussion
Maraviroc, a CCR5 entry inhibitor, has been approved for use in antiretroviral treatment-experienced patients infected with CCR5-tropic HIV-1. The work presented in this paper describes three analyses which built on each other and subsequently informed basic assumptions used in a semi-mechanistic population PK model for maraviroc in healthy subjects [11]. This basic structural model was subsequently used for the population PK analyses of sparse PK samples from phase 2b/3 both in treatment-naïve patients (MERIT study) with minimal drug interactions [12] and in treatment-experienced patients (MOTIVATE 1 and 2 studies) with many interacting drugs [13].
The compartmental analysis of iv data only, confirmed the lack of dose dependency on disposition (post-absorption) of maraviroc over the 3–30 mg range as previously concluded using different methodology [7] and provided a population value for CL. This determination was crucial to support the assumption of linear disposition of maraviroc when developing the mass balance models.
The second analysis describes the absorption dose non-linearity and the interplay with food and formulation on the NCA-derived AUC. This was expected from the knowledge that maraviroc is a substrate for Pgp and other membrane transporters [9, 10]. This implication led to the simplified construction shown in Appendix A where the consequences of absorption non-linearity and effect of formulation and food were addressed using an empirical sigmoid Emax function. This was applied to normalized NCA AUC from five phase 1 studies covering an extensive range of doses but with limited crossover data for the covariates tested. Although the model is over-parameterized (from high standard errors of estimates of covariate effects and bootstrap comparisons (bootstrap distributions reported in detail elsewhere [19]), it is consistent with the formal effects of NCA comparisons reported in individual studies. The model allows interpolation between doses and treatments not used in the reported studies. For example, the main covariate was a dose dependent food effect, giving an increase in the ED50 from 59.7 mg to 365 mg. In combination with minor effects on NAUC0 and on formulation, the model showed that relative fed/fasted bioavailability with single dose solution at 100 mg and 300 mg was 42% and 58%, respectively; for multiple once daily or twice daily dosing with tablets at these doses, the effect of food was reduced (fed : fasted ratios of 50% and 63%).
More importantly, the predicted absolute absorption of 300 mg solution and 100 mg tablet was essential to the progress of the mass balance analysis where non-linearity in absorption is present. Incorporation of NAUC analysis results to allow these predictions is, to our knowledge, a novel approach.
The third analysis developed a mass balance model that relied on the results from the first two analyses (prior values of CL and CLR); this was then used to predict the PK of maraviroc for conditions not studied in the building of the mass balance model and completed the absorption and first-pass structure required for the formal PK of phase 1/2a studies (Box 4, Figure 1; previously reported [11]). The sensitivity analysis also shows that the methodology was fairly robust to the absorption assumption except for the fraction directly secreted by the liver.
One limitation of the modelling is the assignment of all metabolism/secretion to the liver (or assumed combination of intestine and liver); this is unlikely given the CYP3A4 metabolism of maraviroc. As there was no experimental information in the studies to resolve the issue, the most parsimonious model was utilized. Because of the assumption of linearity of disposition, the results are unaffected if intestinal metabolism is considered separately except for the calculation and interpretation of E (which would be a serial combination of intestinal and true hepatic extraction) and calculation of QH,B. Furthermore, no allowances for intestinal distributions of Pgp or CYP3A4 could be made with this simple model.
The back-calculation of the balance, had the study been performed with 100 mg immediate-release tablet, gave an absolute bioavailability in agreement with the formal iv/oral crossover result, indicating the adequacy and internal consistency of the mass balance, the iv and the NAUC analyses. The structure of the absorption non-linearity and the semi-mechanistic partition structure and value for QH,B were therefore carried forward to the more formal comprehensive PK population modelling of phase 1 studies [20], where drug interactions were expected to affect both the extraction E via CYP3A4 inhibition/induction and the absorption via Pgp inhibition/induction.
For population PK modelling, therefore, overall absolute bioavailability (F) was given by the product of the fraction absorbed (FABS) and the fraction that escapes first-pass metabolism (FHEP):
| (4) |
FABS was derived from the sigmoid Emax model from the NAUC analysis (Equation 1) by setting the term at low dose to zero and re-estimating the Hill coefficient and the ED50, using tablet data for 100 mg and above from pooled phase 1/2a studies [11].
 |
(5) |
 , the maximum possible absorption, was set to 1. FHEP was given by the standard definitions:
 |
(6) |
where EH, CLH and QH are hepatic plasma extraction, clearance and flow, respectively.
As maraviroc is confined to plasma, QH was fixed to 59.59 l h−1, the value derived from QH,B, the hepatic blood flow from the above mass balance analysis (Equation 3), of 101 l h−1 multiplied by the rB of 0.59. CL was the sum of CLH and CLR; CLR was fixed to 12 l h−1 in accord with the above analyses. For population modeling from oral data, the absorption phase masks the four-compartment model iv disposition phases and a two-compartment model was adequate for the purpose with the recognized 12 h terminal phase and the collapse of the other three disposition phases into one.
For maraviroc in the presence of other antiretrovirals, the effects of inducers/inhibitors of Pgp and other absorption transporters would only have their effect on FABS through modification of ED50 (Equation 5). The effects of inducers/inhibitors of CYP3A4 metabolism would only have their effect on EH (Equation 6), modifying both the first-pass extraction and overall disposition CL. According to this partition model, for example, boosted protease inhibitors that are very strong inhibitors of both Pgp and CYP3A4, in the limit, could decrease the FABS ED50 to a very small value, abolishing the dose non-linearity and giving 100% absorption, even in the presence of food. They could also, in the limit, reduce the hepatic extraction EH to zero, allowing 100% bioavailability with no first pass remaining. However, the renal component of CL would remain.
In summary, the methodology and models developed in the analyses described herein played a vital role in underpinning the development of a semi-mechanistic PK model for maraviroc which was further used for phase 1 interaction studies [20] and generation of exposures from phase 2b/3 sparse concentrations [12, 13] for the purpose of efficacy [14, 15] and safety covariate analyses [16].
Appendix A
A semi-mechanistic view of maraviroc non-linear absorption
The reasoning for the various assumptions is illustrated by a semi-mechanistic image of the non-linear oral absorption process for a drug that is a P-glycoprotein (Pgp) substrate with no solubility or permeability limitations.
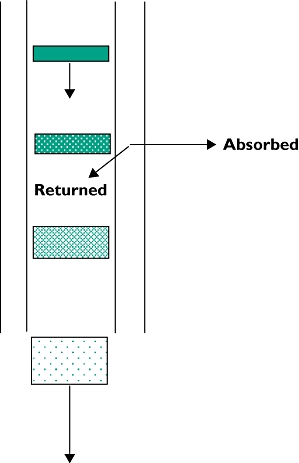 |
| • Absorption represented by a ‘disk’ of drug travelling down an intestinal absorbing tube with walls containing saturable transporters (Pgp) returning part of the drug back into the lumen. |
| • Passage down the tube is spreading and diluting the ‘disk’. |
| • Effect of formulation and/or food is to delay dissolution and/or spread and dilute the ‘disk’. |
| • The more dilute ‘disk’ reduces relative saturation of the transporters and returns relatively more to the lumen. |
| • Multiple doses superimpose upon any residual maraviroc unabsorbed from previous doses and increase lumen concentrations. |
It is assumed that:
There are no dose or covariate changes in disposition pharmacokinetics (including first-pass metabolism)
Fasted solution dose would give the highest single dose-absorption magnitude and quickest absorption
Once daily dosing would give a higher or an equal NAUC compared with the same single dose
Twice daily dosing would give a higher or an equal NAUC compared with the same once-daily dose
The reference model is single dose, solution, fasted
High enough doses would eventually overcome any effects of absorption transporters.
For example, at any given single dose, a fasted solution dose would give the highest single dose bioavailability and quickest single-dose absorption. Hence fasted solution would have the highest NAUC at all doses and so the model-predicted dose-relationship curve for tablet in the fasted or fed state must lie below or adjacent to the fasted solution curve at all doses as shown in Figure 7 of the body of the paper.
Appendix B1
Calculation of predicted mass balance for 300 mg maraviroc solution
Equations from mass balance considerations are as follows, with the scaled values from Table 2 inserted into the calculations. No enterohepatic recycling is assumed to occur (a reasonable assumption since there was no evidence of multiple peaks after iv administration).
For an oral dose, suppose a fraction A of the dose is absorbed and a fraction B of the dose is bioavailable (Figure 3). Fraction B behaves as an iv dose. The remaining unabsorbed parent (1–A) appears in faeces. The fraction of the dose that is absorbed but not bioavailable (A–B) is the fraction of the dose that has been subjected to first-pass effects.
It is assumed that CL consists only of CLR and hepatic components (CLH). CLH is assumed to have a metabolic component (CLM) and a non-metabolic component (CLS; secreted into bile, for example). The individual clearance components can be expressed as fractions of the total clearance as follows.
 |
(1) |
Consideration of an iv dose with linear PK leads to:
| (2) |
By dividing throughout by CL, this can be expressed in terms of the above fractions.
| (3) |
From the pathways presented in Figure 3, it can be seen that the total systemically available dose (B) divides into the proportions of rM, rR and rS. Similarly, the total absorbed dose that is not systemically available (A–B) must have been divided into the proportions rS and rM only, into parent secreted into faeces or metabolized. The metabolized portion can be secreted into faeces and/or circulated systemically where it can be renally eliminated or further metabolized.
Using the pre-existing values for clearance, namely CL (48.0 l h−1) and CLR (12.0 l h−1), CLH is obtained by difference (36.0 l h−1). Thus rR and rH are known (rR= 12/48 =0.25; rH= 36/48 = 0.75).
Using the mass balance data together with the estimate of fraction A (83.8%, from NCA modelling described in the body of the paper) the CLM and CLS components of CLH can be separated out. This is done as follows.
| (4) |
since only bioavailable (systemic) parent is renally cleared.
 |
(5) |
| (6) |
 |
(7) |
 |
(8) |
| (9) |
Having solved for all the r values, it just remains to apportion the balance pathways:
Table A1.
List of abbreviations and definition of terms
| Abbreviation | Definition |
|---|---|
| A | Fraction of oral dose absorbed (mass balance model) |
| ADVAN7 | General linear compartmental subroutine for NONMEM (iv model) |
| AUC | Area under the curve = 0 to infinity single dose, over dosing interval multiple dose |
| B | Fraction of oral dose bioavailable (mass balance model) |
| BIO100 | Absolute bioavailability of 100 mg tablet dose (mass balance model) |
| BIO300 | Absolute bioavailability of 300 mg solution dose (mass balance model) |
| CI | Confidence interval |
| CL | Clearance |
| CLH | Hepatic plasma clearance |
| CLH,B | Hepatic blood clearance |
| Cmax | Maximum plasma concentration |
| CLR | Renal clearance |
| CV | Coefficient of variation |
| CYP3A4 | Cytochrome P450 3A4 enzyme responsible for majority of maraviroc metabolism |
| DV | Dependent value label in NONMEM used to identify observation variable |
| E | Extraction ratio |
| η (eta) | Inter-subject random effect (η) in a PK parameter expressed as % of parameter |
| ED50 | Dose giving half-maximal change in NAUC (NCA model) or in FABS (population PK partition model) |
| Emax | General dose response model |
| F | Absolute bioavailability |
| FABS | Fraction of dose absorbed (population PK partition model) |
 |
Maximum possible fraction of dose absorbed (population PK partition model) |
| FHEP | Fraction of dose escaping first pass metabolism (population PK partition model) |
| FOCE | First-order conditional estimation method as implemented in NONMEM |
| γ (gamma) | Hill coefficient of sigmoidal Emax model (NCA model), (population PK partition model) |
| INTERACTION | Allows additional interaction in the FOCE method in NONMEM |
| IPRE | NONMEM individual predicted value based on individual's etas |
| IWRE | Individual weighted residual obtained as the difference between DV and IPRE and scaled by the within-individual standard deviation of the measurements |
| LC/MS/MS | liquid chromatography with tandem mass spectrometric detection |
| LDV | Natural log of DV |
| LPRE | NONMEM natural log of IPRE |
| NAUC | Dose normalized AUC |
| NCA | Non-compartmental analysis |
| NONMEM | Nonlinear mixed effects modeling software |
| PD | Pharmacodynamic |
| Pgp | Membrane transporter P-glycoprotein for which maraviroc is a substrate |
| PK | Pharmacokinetic |
| PRED | Population or typical individual predicted value obtained from a NONMEM model fit evaluated at η= 0 |
| Q2 | Inter-compartmental clearance from central to peripheral compartment V2 |
| Q3 | Inter-compartmental clearance from central to peripheral compartment V3 |
| Q4 | Inter-compartmental clearance from central to peripheral compartment V4 |
| QH | Hepatic plasma flow |
| QH,B | Hepatic blood flow |
| rB | Blood : plasma partition ratio |
| rH | Fraction of hepatic clearance to total clearance (mass balance model) |
| rM | Fraction of metabolic clearance to total clearance (mass balance model) |
| rR | Fraction of renal clearance to total clearance (mass balance model) |
| rS | Fraction of clearance other than renal or metabolic (mass balance model) |
| SD | Standard deviation |
| SE | Standard error |
| Theta (θ) | Estimate of fixed effects in NONMEM |
| tlag | Lag time |
| V2 | Volume of distribution of first peripheral compartment |
| V3 | Volume of distribution of second peripheral compartment |
| V4 | Volume of distribution of third peripheral compartment |
| WRES | Weighted population residual obtained by the difference between DV and PRED and scaled by the population residual standard deviation |
 |
(10) |
 |
(11) |
 |
(12) |
Clearly, as a check, absorbed parent is 100 – 16.2 = 83.8%, the value of absorption used.
From Equation 7, the separate metabolite contributions can be calculated:
 |
(13) |
Finally, the extraction ratio (E) can be calculated from:
 |
(14) |
Due to the assumption of linear PK, this value for the extraction ratio is independent of dose. It implies that even at a dose that may achieve 100% absorption, the first-pass extraction of 60.2% reduces bioavailability to no more than 39.8% (1–E).
The values obtained above (in bold type in the text) are shown on the 300 mg solution mass balance diagram presented in Figure 3.
Appendix B2
Reverse calculation of predicted mass balance for 100 mg maraviroc immediate-release tablet
Having calculated the ratios for the pathways in the model, shown in Appendix B1 and Figure 3, as the assumption has been made that the pharmacokinetics are linear, if a prediction of the absorption at another dose is available, the calculation can be reversed to give a prediction of the balance achieved from a hypothetical study at that dose. The sequence of additional calculations is as follows, with the example of a 100 mg tablet dose with predicted absorption of 57.45% (A) from the non-compartmental analysis in the body of this paper.
Bioavailability B = A × (1 − E) = 57.45 × (1 − 0.6022) = 22.85 =22.9%
This shows good agreement with the 23.1% (95% CI 19.2, 27.8) absolute bioavailability determined from the intravenous/oral crossover cohort of the intravenous study, comparing 30 mg intravenous dose with 100 mg oral tablet (reference 8 in body of paper).
First-pass fraction A − B = 57.5 − 22.9 =34.6%
Parent in faeces from systemic route = B × rS= 22.9 × 0.101 =2.3%

Unabsorbed parent in faeces = (100 − A) = 100 − 57.45 =42.55%
Therefore total parent in faeces = 2.3 + 4.66 + 42.55 = 49.51 =49.5%
Parent in urine (from systemic route) = B × rR= 22.9 × 0.25 =5.7%
Metabolite from systemic route = B × rM= 22.85 × 0.649 =14.83%

Therefore total metabolite = 14.83 + 29.94 =44.8%
It remains to determine the fractions of the total metabolite that appear in the urine and faeces. Because after absorption the pharmacokinetics of both parent and metabolites are assumed to be linear, it follows that the ratio of urinary metabolite (sourced from systemic parent and first-pass metabolite) to urinary parent will be independent of dose.
 |
Metabolite in faeces = Total metabolite – Urinary metabolite = 44.8 – 8.3 =36.5%
Total urinary radioactivity = Urinary parent + Urinary metabolite = 5.7 + 8.3 =14.0%
Total faecal radioactivity = Faecal parent + faecal metabolite = 49.5 + 36.5 =86.0%
The predicted mass balance at 100 mg immediate-release tablet would be as shown in Figure 8.
Competing interests
This research was sponsored by Pfizer Inc. Barry Weatherley is a paid consultant to Pfizer Global Research and Development, Sandwich, Kent. Lynn McFadyen is an employee of Pfizer Global Research and Development, Sandwich, Kent.
The authors thank Professor Mats Karlsson of Uppsala University, Uppsala, Sweden, for his advice during the model development; Professor Karlsson was a paid consultant to Pfizer Global Research and Development, Sandwich, Kent, UK. We are also grateful for Dr Janet Wade of Exprimo NV, Mechelen, Belgium, who was contracted by Pfizer Global Research and Development, Sandwich, Kent, UK, to assist in constructing this manuscript. We also acknowledge the invaluable support and expert editorial comments provided by Dr Scott Marshall of Pfizer Ltd.
REFERENCES
- 1.Wood A, Armour D. The discovery of the CCR5 receptor antagonist, UK-427 857, a new agent for the treatment of HIV infection and AIDS. Prog Med Chem. 2005;43:239–71. doi: 10.1016/S0079-6468(05)43007-6. [DOI] [PubMed] [Google Scholar]
- 2.Fätkenheuer G, Pozniak AL, Johnson MA, Plettenberg A, Staszewski S, Hoepelman AI, Saag MS, Goebel FD, Rockstroh JK, Dezube BJ, Jenkins TM, Medhurst C, Sullivan JF, Ridgway C, Abel S, James IT, Youle M, van der Ryst E. Efficacy of short-term monotherapy with maraviroc, a new CCR5 antagonist, in patients infected with HIV-1. Nature Med. 2005;11:1170–2. doi: 10.1038/nm1319. [DOI] [PubMed] [Google Scholar]
- 3.Gulick RM, Lalezari J, Goodrich J, Clumeck N, DeJesus E, Horban A, Nadler J, Clotet B, Karlsson A, Wohlfeiler M, Montana JB, McHale M, Sullivan J, Ridgway C, Felstead S, Dunne MW, van der Ryst E, Mayer H. Maraviroc for previously treated patients with R5 HIV-1 infection. N Engl J Med. 2008;359:1429–41. doi: 10.1056/NEJMoa0803152. [DOI] [PMC free article] [PubMed] [Google Scholar]
- 4.Kashuba ADM. Drug–drug interactions and the pharmacotherapy of HIV infection. Top HIV Med. 2005;13:64–9. [PubMed] [Google Scholar]
- 5.Robertson SM, Penzak SR, Pau AK. Drug interactions in the management of HIV infection. Expert Opin Pharmacother. 2005;6:233–53. doi: 10.1517/14656566.6.2.233. [DOI] [PubMed] [Google Scholar]
- 6.Abel S, van der Ryst E, Rosario MC, Ridgway CE, Medhurst CG, Taylor-Worth RJ, Muirhead GJ. Assessment of the pharmacokinetics, safety and tolerability of maraviroc, a novel CCR5 antagonist, in healthy volunteers. Br J Clin Pharmacol. 2008;65(Suppl. 1):5–18. doi: 10.1111/j.1365-2125.2008.03130.x. [DOI] [PMC free article] [PubMed] [Google Scholar]
- 7.Abel S, Russell D, Whitlock LA, Ridgway CE, Nedderman ANR, Walker DK. Assessment of the absorption, metabolism and absolute bioavailability of maraviroc in healthy male subjects. Br J Clin Pharmacol. 2008;65(Suppl. 1):60–7. doi: 10.1111/j.1365-2125.2008.03137.x. [DOI] [PMC free article] [PubMed] [Google Scholar]
- 8.Hyland R, Jones B, Muirhead G. In vitro assessment of the CYP-based drug–drug interaction potential of UK-427 857. 5th International Workshop on Clinical Pharmacology of HIV Therapy; 1–3 April 2004; Rome, Italy.
- 9.Walker DK, Abel S, Comby P, Muirhead GJ, Nedderman AN, Smith DA. Species differences in the disposition of the CCR5 antagonist, UK-427 857, a new potential treatment for HIV. Drug Metab Dispos. 2005;33:587–95. doi: 10.1124/dmd.104.002626. [DOI] [PubMed] [Google Scholar]
- 10.Abel S, Beaumont KC, Crespi CL, Eve MD, Fox L, Hyland R, Jones BC, Muirhead GJ, Smith DA, Venn RF, Walker DK. Potential role for P-glycoprotein in the non-proportional pharmacokinetics of UK-343,664 in man. Xenobiotica. 2001;31:665–76. doi: 10.1080/00498250110052779. [DOI] [PubMed] [Google Scholar]
- 11.Chan PLS, Weatherley B, McFadyen L. A population pharmacokinetic meta-analysis of Maraviroc in healthy volunteers and asymptomatic HIV-infected subjects. Br J Clin Pharmacol. 2008;65(Suppl. 1):76–85. doi: 10.1111/j.1365-2125.2008.03139.x. [DOI] [PMC free article] [PubMed] [Google Scholar]
- 12.Weatherley B, McFadyen L, Chan PLS, Marshall S. Population pharmacokinetic covariate analysis of maraviroc in the MERIT study in treatment naïve subjects. 9th International Workshop on Clinical Pharmacology of HIV Therapy; 7–9 April 2008; New Orleans, USA.
- 13.Weatherley B, McFadyen L, Chan PLS, Marshall S. Population pharmacokinetic covariate analysis of maraviroc in phase 2b/3 studies in treatment experienced (TE) HIV-1 infected subjects on optimized background therapy (OBT) 9th International Workshop on Clinical Pharmacology of HIV Therapy; 7–9 April 2008; New Orleans, USA.
- 14.McFadyen L, Jacqmin P, Wade JR, Weatherley B. Maraviroc exposure-efficacy (<50 copies/mL) analysis in HIV-1 infected treatment-naïve subjects – ITT population (MERIT study) XV11 International Aids Conference. 3–8 August 2008; Mexico City, Mexico.
- 15.McFadyen L, Jacqmin P, Wade JR, Weatherley B, Chan PLS. Maraviroc (MVC) exposure-efficacy relationship in treatment-experienced HIV-1 infected patients. 11th European Aids Conference. 24–27 October 2007; Madrid, Spain.
- 16.McFadyen L, Jacqmin P, Wade JR, Weatherley B. Maraviroc exposure-safety biomarker (transaminases and creatine kinase) analyses in MOTIVATE 1 and 2 studies in HIV-1 infected treatment-experienced subjects. XV11 International Aids Conference. 3–8 August 2008; Mexico City, Mexico.
- 17.Beal SL, Sheiner LB. NONMEM Users Guides. Editors. Icon Development Solutions, Ellicott City, Maryland.
- 18.Seattle, WA: S-PLUS 6 for Windows User's Guide, Insightful Corporation. [Google Scholar]
- 19.Weatherley B, McFadyen L, Milligan P. Population analysis of maraviroc phase 1 noncompartmental pharmacokinetic data. 15th Meeting of the Population Approach Group Europe. 14–16 June 2006; Brugge, Belgium.
- 20.Chan PLS, Weatherley B, McFadyen L, Abel S. Impact of concomitant interacting drugs on maraviroc pharmacokinetics after oral tablet administration. 8th International Workshop on Clinical Pharmacology of HIV Therapy. 16–18 April 2007; Budapest, Hungary.


