Abstract
Herein we report the first fully quantum mechanical study of enantioselectivity for a large dataset. We show that transition state modeling at the UB3LYP-DFT/6-31G* level of theory can accurately model enantioselectivity for various dioxirane-catalyzed asymmetric epoxidations. All the synthetically useful high selectivities are successfully “predicted” by this method. Our results hint at the utility of this method to further model other asymmetric reactions and facilitate the discovery process for the experimental organic chemist. Our work suggests the possibility of using computational methods not simply to explain organic phenomena, but also to predict them quantitatively.
Introduction
The development of tools to quantitatively model the stereochemical outcome of reactions is of great interest to the chemical community, as experimental screening of new compounds for enantioselective reactions is often labor-intense and expensive. Furthermore, modeling stereochemistry presents a formidable challenge to the computational chemist, where a difference of only 1.8 kcal/mol in the stereochemically distinct transition states leads to product ratios of 96:4.
Moitessier, et al. have recently proposed a computational tool to model diastereoselectivity employing a force-field based approach.i Moitessier approximates transition state geometries as linear combinations of reactant and product geomtries. Transition state energies are approximated by multiplying the MM3* force field terms for the forming and breaking bonds with a linear scaling factor. Of course, such an approach has the advantage that the computations are orders of magnitude faster than quantum mechanical calculations, and therefore allow more efficient sampling of conformational space. However, the accuracy of such a crude transition state model is questionable, especially for flexible transition states. A quantum mechanical approach, however, promises higher accuracy for the transition state geometries and energies and does not require the parametrization of a transition state force field. The major disadvantage of a quantum mechanical approach is, of course, the much longer times required to run the calculations. The Jaguar suite of quantum chemistry programsii allows efficient computation of molecular integrals by exploiting pseudospectral methods16 and therefore opens the possibility to model enantioselectivity of reactions between medium sized organic molecules within affordable time. As a rough estimate, the computations described in this work took on the order of one week on a standard PC for a medium sized transition state in the dataset.
Herein we report the first fully quantum mechanical study of enantioselectivity for a large dataset. Our study differs significantly from previous quantum mechanical studies of asymmetric reactions, which have been largely mechanistic or limited to only a handful of substrates. Bach et al. first explored computational methods to help understand asymmetric epoxidations,iii paving the way for Houk and coworkers4 who would later contribute much to the understanding of the reaction’s stereoselectivity. Houk showed that stereoselectivity in asymmetric epoxidations is qualitatively controlled by torsional steering, a differential stability of transition states mediated by varying degrees of torsional strain.iv It has also been shown that the dioxirane-mediated epoxidation, among other epoxidations, is well described by B3LYP.4-v Sarzi-Amadè et al. have published several studies exploring the qualitative nature of enantioselectivity for peroxy acids and dioxiranes, utilizing B3LYP to obtain good qualitative agreement with experimental data.vi Singleton et al. have also demonstrated that B3LYP can be used to predict kinetic isotope effects in very good agreement with experiment for the Shi epoxidation,5b further suggesting B3LYP’s ability to accurately model dioxirane-mediated epoxidations even for larger complex systems. A recent study by Shankar et al. discusses the facial selectivity in the DMDO epoxidation of carbohydrate-based oxepines based on B3LYP calculations and compares the computational results to experimental findings.5i
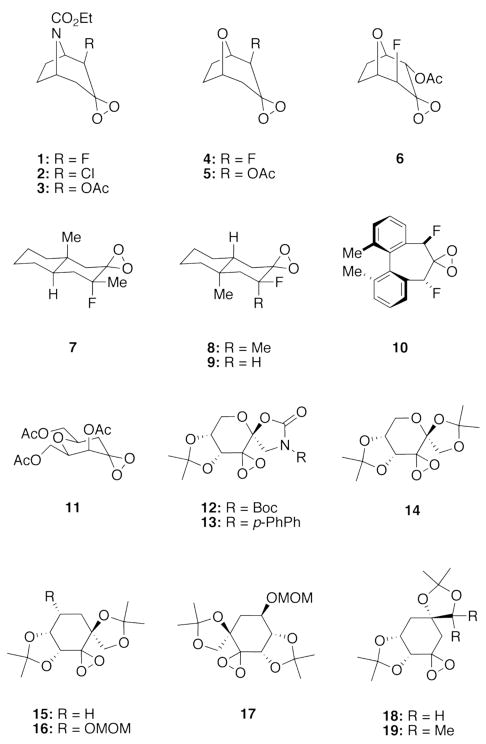
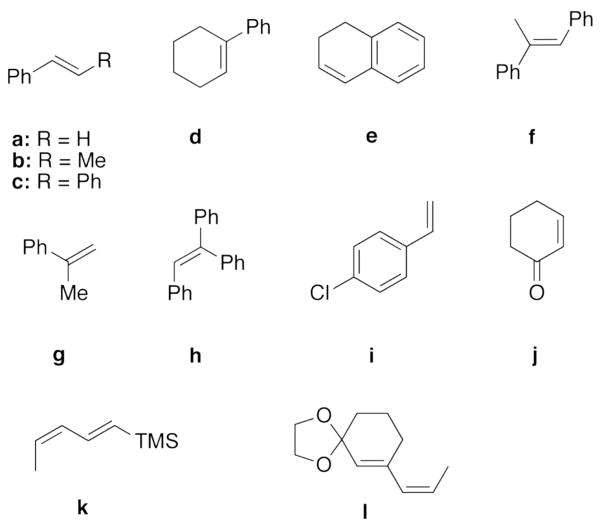
Intrigued by whether computational chemistry could be used to explain organic phenomena of practical interest quantitatively, we employed transition state theory to model enantioselectivity on a large dataset. Our test set comprised 46 asymmetric dioxirane-catalyzed epoxidation reactions with dioxirane catalysts and olefins shown in Charts 1 and 2, respectively. The dataset is notable for the structural diversity of the dioxirane catalysts and of the olefin substrates as well as the broad range of experimental ee-values (ranging from 0 to 98 % ee). Furthermore, the dataset is also marked by various solvent systems and reaction temperatures. By utilizing a dataset of such diversity, we aimed to thoroughly explore the boundaries and limitations of quantum mechanical methods to accurately reproduce experimental data with a keen eye on the future goal of prediction.
Chart 1.
Dioxirane catalysts employed in this study
Chart 2.
Olefins employed in this study
Our current test set includes many practically useful dioxirane-catalysed epoxidations. There are, however, still a few interesting dioxirane catalysts absent from the dataset such as the binapthyl-based catalysts reported by Yangvii. Extending our dataset to the aforementioned additional asymmetric epoxidation reactions as well as to other reaction types would of course be of interest, but is beyond the scope of the current study. Furthermore, we propose that the diversity and size of our current dataset is sufficient to excuse the aforementioned absences, being well beyond the scope of all previous studies.
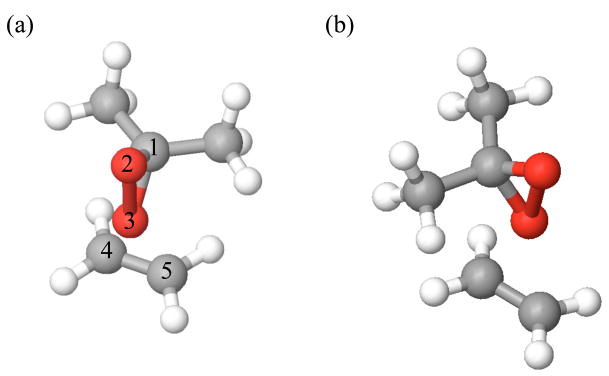
The mechanism of the catalytic dioxirane-mediated epoxidation reaction of olefins is well understood and proceeds through the catalytic cycle shown in Scheme 1.viii Computations by Bach et al.iii and Houk et al.iva have shown the epoxidation of olefins by dioxiranes to proceed through a “spiro” transition state as shown in Figure 1a. Although planar transition state structures (Figure 1b) are invoked by Shi and Bartlett in some cases, ix,x computational evidence continues to support a spiro transition stateiiia or hybrid planar-spiro transition state in more complex systems, as shown by Singleton.vb
Scheme 1.
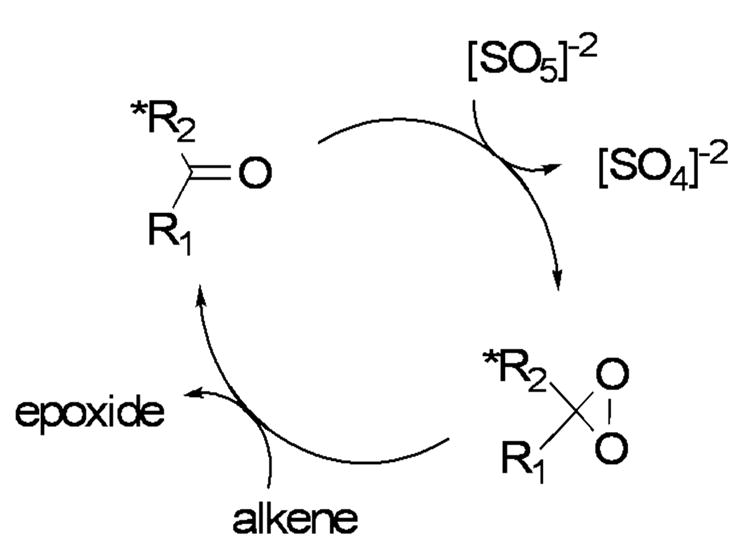
Catalytic cycle for the asymmetric epoxidation reaction of olefins with dioxiranes.
Figure 1.
Spiro (a) and planar (b) transition states of dimethyldioxirane (DMDO) and ethylene.
Physical model and Computational Methodology
The enantiomeric excess is given by
| (1) |
where k is the reaction rate constant leading to either the favored or disfavored enantiomer. The rate constant can be expressed via transition state theory as
| (2) |
where A(T) is a pre-exponential factor, assumed to be equivalent for both enantiomeric pathways, ΔG≠ is the activation Gibbs free energy, R is the gas constant, and T is temperature in Kelvin. Substitution of equation 2 into equation 1 then allows us to write
| (3) |
Where δΔG≠ is given by
| (4) |
As the starting materials leading to the two different enantiomers are identical, and therefore also have identical free energy, we can write the difference in Gibbs free activation energy, δΔG≠, just as the difference in transition state free energies, ΔGTS.
| (5) |
Because the Gibbs free energy, G, is simply related to the Helmholtz free energy, A, as G = A + pV, where pV is assumed to be identical for both enantiomeric pathways, we set ΔGTS equal to ΔATS. The Helmholtz free energy of a transition state ensemble i, was then computed from an estimate of the partition function, Zi.
| (6) |
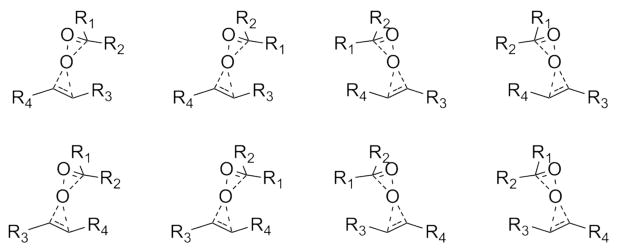
Neglecting entropic effects partially, the partition function Zi was approximated as a Boltzmann-weighted average over unique transition states (shown schematically in Figure 2) leading to enantiomer i.
Figure 2.
All unique transition states considered for systems where the catalysts and olefins show no rotational symmetry.
| (7) |
E is the quantum mechanical transition state energy and the index j loops over unique transition states leading to enantiomer i. Rearrangement of equation 3 gives an expression to compute ΔGTS from the ee-value and vice versa.
| (8) |
For systems involving dioxirane catalysts and olefins with no rotational symmetry, eight geometrically distinct transition states were considered, as shown in Figure 2. For systems involving the C2h symmetrical trans-stilbene (olefin c), the number of unique transition states is reduced by a factor of two. The same is true for systems involving the C2 symmetrical catalyst 10.
To locate transition states in their lowest energy conformations, initial guesses for all transition states were first obtained using the spiro UB3LYP/6-31G* epoxidation transition state of dimethyldioxirane and ethylene as a scaffold. (Figure 1a). While Shi invokes a planar transition state in some cases,ix the planar transition state scaffold was not used, as Houk et al. has shown that the planar transition state for dimethyldioxirane and ethylene is 7.4 kcal/mol higher in energy than the corresponding spiro transition state at the B3LYP/6-31G* level, and represents only a secondary saddle point.4a We attempted to address the conformational flexibility of the systems by performing conformational searches of the transition state guesses using MacroModelxi and the OPLS 2001 force fieldxii while keeping the Cartesian coordinates of the reactive atoms of the transition state guesses frozen (atom numbers 1–5 in Figure 1a). For some systems involving catalysts 14–19 (Chart 1) with relatively flexible ring systems, conformational searching was also performed with the spiro carbon atoms of the dioxirane (C-1 in Figure 1a) unfrozen, therefore allowing rotational adjustment of the transition state geometry, from strictly spiro to hybrid spiro-planar.xiii Finally, where we suspected that the above did not yield transition states in their lowest energy conformations, we further subjected these structures to manual conformational searching.
We further refined our initial transition state guesses by performing minimum energy structure optimizations at the B3LYP/6-31G* level, while keeping three distances (C1-O3, C5-O3 and C4-O3 in Figure 1a) between the reactive atoms fixed. The quantum mechanically refined transition state guesses were then used in all subsequent transition state optimizations.
It has already been shown that dioxirane-mediated epoxidations are well described (at least qualitatively) by B3LYP.4–5 Houk et al.4a and Bach et al.3h have suggested that the transition states for epoxidation by dioxiranes lie in shallow potential energy wells, and that asymmetrical substitutions on the symmetrical dimethyldioxirane and ethylene transition state scaffold lead to more asynchronous transition states. Furthermore, spin-unrestricted B3LYP (UB3LYP) leads to more asynchronous transition states than spin-restricted B3LYP.iva Therefore we employed unrestricted density functional theory within Jaguar 7.0 for all quantum mechanical computations to capture the asynchronicity and flexibility of the transition states. Transition states were first located in vacuum and then subsequently in the solution phase using the PBF solvation model as implemented in Jaguar 7.0. Solvation effects for the vacuum transition states were approximated from single-point calculations in the continuum solventxiv. For CH3CN/H2O and dioxane/H2O mixtures, dielectric constants were taken as those reported in experimental measurements.xv Because no experimental dielectric constants were reported for the other solvent mixtures, DMM/CH3CN/H2O and DMM/DME/H2O, the dielectric constant was approximated as the mole fraction weighted average over all dielectric constants of the pure solvents. The dielectric constants ultimately employed were 55, 47, 20, 69, and 73 for 3:2 CH3CN:H2O (v:v), 3:1 CH3CN:H2O, 2:1 dioxane/H2O, 3:3:6.4 DMM:CH3CN:H2O, and 26:1:2.8 H2O:DMM:DME solvent systems, respectively. The solvent probe radius was set to 1.40 Å for all calculations as this probe radius was shown to reproduce solvation energies accurately for pure waterxvi. The first shell correction factor term and the solute cavity energy term available in Jaguar 7.0 were included for all solvation calculations.xvii Single point calculations at the B3LYP/6-311+G**(solution)//B3LYP/6-31G*(solution) level were also performed in order to check the basis set dependence of the results. Finally, all B3LYP transition states for a representative subset of the dataset were fully reoptimized at the M06-2Xxviii/6-31G*(solution) level employing Jaguar Version 7.6 with the goal of obtaining a more accurate treatment of dispersion interactions, for which B3LYP is known to perform poorlyxix.
The nature of all vacuum B3LYP transition states was verified with frequency calculations, yielding only one large imaginary frequency. Harmonic zero-point energy corrections obtained from the frequency calculations of the vacuum B3LYP transition states were applied to all transition state energies. Because second derivatives within the solvation model can only be calculated via an impractically expensive numerical procedure, vibrational frequencies of the transition states in solution were not computed. Harmonic thermochemical and entropic corrections other than the zero-point energy, for which low frequency vibrational modes contribute the most, were not included because the harmonic approximation is highly inaccurate for low frequency vibrational modes.
Results and Discussions
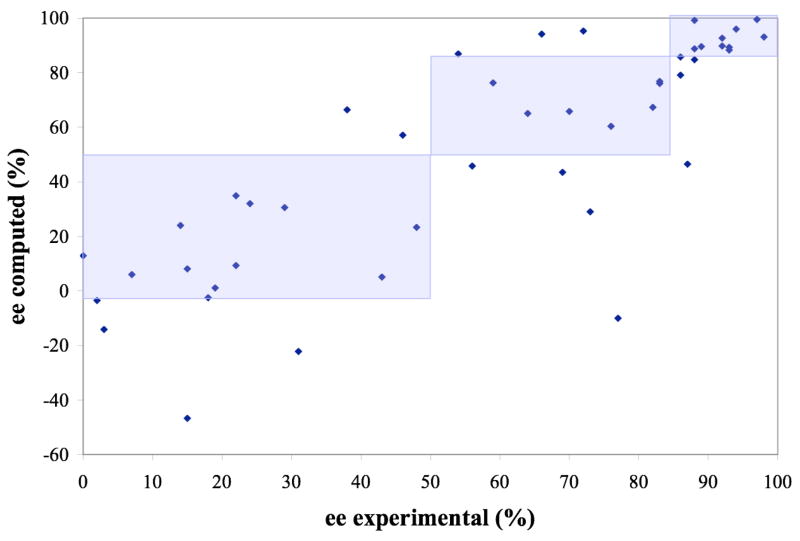
Figure 3 shows the relationship between the computed and experimental enantioselectivity. Like others,1 we found that ΔGTS is systematically over-estimated and scaled all ΔGTS by a scaling factor of 2/3 accordingly before using ΔGTS to calculate the enantiomeric excesses. Inspection of Figure 3 shows that our method is able to capture which enantiomer a system will prefer, except for a few cases where low enantioselectivity is predicted. Furthermore, it is clear that our method consistently and accurately captures whether a system will have low (0–50%), medium (50–85%) or high (>85%) enantioselectivity for the majority of the systems studied. Specifically, most systems with high experimental enantioselectivity also have high computed enantioselectivity. The same is true for both medium and low enantioselectivities, suggesting that our method can be used to model in a quantitative sense the enantioselectivity of other dioxirane-catalysed epoxidations and perhaps even other enantioselective reactions as well.
Figure 3.
Experimental versus computed % ee for solution phase transition states at the B3LYP/6-31G*(solution) level. Shaded areas represent regions where computation and experiment fall within the same category of percent enantiomeric excess, i.e. low (0–50), medium (50–85) and high (85–100). Reactions that do not fall into the correct region are labeled in an identical graph in the supporting information. A linear least squares fit through all the points gives a coefficient of determination R2 = 0.66.
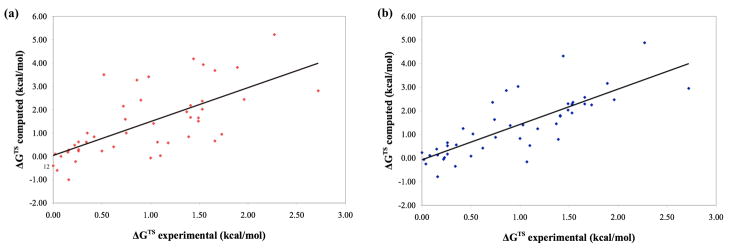
The experimental and computed free energy differences, ΔGTS, between the transition state ensembles leading to favored and disfavored enantiomers are plotted in Figure 4. (Detailed results are listed in Table 1 while similar plots and tables for the results obtained at the B3LYP/6-311+G**(solution)//B3LYP/6-31G*(solution) and the M06-2X/6-31G*(solution) level are available in the supporting information.) Five outliers with deviations from experiment larger than 1.5 kcal/mol are present at the B3LYP/6-31G*(solution) level. As discussed in detail later, all of these outliers share the unique structural motif of π-stacking between an oxygen or a chlorine atom and a benzene ring. Of course those outliers significantly distort the linear least squares fit shown in Figure 4b. Without the five outliers, the slope of the linear least squares fit becomes significantly closer to unity, with a value of 1.33 while the correlation coefficient, R2, increases to a respectable value of 0.78.
Figure 4.
Experimental versus computed enantiomeric transition state energy differences, ΔGTS, for all reactions in the test set. (a) B3LYP/6-31G*(solution)//B3LYP/6-31G*(vacuum) level. (Solid line shows linear least squares fit of y = 1.45x + 0.04 with coefficient of determination R2 = 0.46) (b) B3LYP/6-31G*(solution) level (y = 1.50x − 0.07, R2 = 0.64). Identical figures with all datapoints labeled with their corresponding reaction numbers are shown in the supporting information.
Table 1.
B3LYP/6-31G*(solution)//B3LYP/6-31G*(vacuum) and B3LYP/6-31G*(solution) results.
| ΔGTS (kcal/mol) (% ee) | |||||||
|---|---|---|---|---|---|---|---|
| Entry | Catalyst | Olefin | Exp.c | Vac.d | Soln.e | Ref.a | Solv.b |
| 1 | 1 | e | 0.22 (18) | 0.48 (26) | −0.05 (−3) | I | A |
| 2 | 1 | b | 0.75 (56) | 1.00 (51) | 0.88 (46) | I | A |
| 3 | 1 | c | 1.18 (76) | 0.58 (32) | 1.24 (60) | I | A |
| 4 | 1 | f | 1.10 (73) | 0.03 (2) | 0.53 (29) | I | A |
| 5 | 1 | d | 1.00 (69) | −0.07 (−4) | 0.83 (44) | I | A |
| 6 | 1 | g | 0.26 (22) | 0.29 (16) | 0.65 (35) | I | A |
| 7 | 1 | a | 0.35 (29) | 1.00 (51) | 0.56 (31) | I | A |
| 8 | 1 | h | 1.41 (83) | 2.18 (84) | 1.80 (77) | I | A |
| 9 | 2 | c | 0.72 (54) | 2.15 (84) | 2.36 (87) | I | A |
| 10 | 3 | c | 1.53 (86) | 2.37 (87) | 2.28 (86) | I | A |
| 11 | 8 | b | 0.26 (22) | 0.23 (13) | 0.17 (9) | II | B |
| 12 | 9 | b | 0.00 (0) | −0.40 (−22) | 0.23 (13) | II | B |
| 13 | 7 | b | 1.03 (70) | 1.41 (66) | 1.40 (66) | II | B |
| 14 | 7 | c | 1.53 (86) | 2.02 (81) | 1.91 (79) | II | B |
| 15 | 10 | b | 1.49 (88) | 1.65 (77) | 2.30 (89) | III | A |
| 16 | 10 | c | 1.89 (94) | 3.81 (98) | 3.16 (96.0) | III | C |
| 17 | 10 | d | 0.74 (59) | 1.59 (75) | 1.63 (76) | III | A |
| 18 | 10 | i | 0.50 (43) | 0.23 (14) | 0.08 (5) | III | A |
| 19 | 4 | c | 1.41 (83) | 1.67 (74) | 1.77 (76) | IV | A |
| 20 | 6 | c | 0.90 (64) | 2.41 (88) | 1.38 (65) | IV | A |
| 21 | 6 | a | 0.02 (2) | 0.10 (6) | −0.06 (−4) | IV | A |
| 22 | 5 | a | 0.62 (48) | 0.41 (23) | 0.42 (23) | V | A |
| 23 | 5 | c | 1.96 (93) | 2.44 (88) | 2.47 (88) | V | A |
| 24 | 5 | d | 1.37 (82) | 1.91 (79) | 1.45 (67) | V | A |
| 25 | 5 | h | 2.72 (98) | 2.81 (92) | 2.95 (93) | V | A |
| 26 | 5 | j | 0.04 (3) | −0.60 (−32) | −0.25 (−14) | V | A |
| 27 | 11 | g | 0.08 (7) | 0.00 (0) | 0.11 (6) | VI | A |
| 28 | 11 | a | 0.23 (19) | −0.22 (−12) | 0.02 (1) | VI | A |
| 29 | 14 | c | 2.27 (97) | 5.22 (99.7) | 4.88 (99.5) | VII | D |
| 30 | 15 | c | 1.49 (88) | 1.51 (73) | 2.03 (85) | VII | D |
| 31 | 16 | c | 1.54 (89) | 3.93 (98.4) | 2.36 (90) | VII | D |
| 32 | 18 | c | 0.86 (66) | 3.27 (96.5) | 2.86 (94) | VII | D |
| 33 | 19 | c | 0.98 (72) | 3.41 (97.0) | 3.03 (95) | VII | D |
| 34 | 14 | a | 0.16 (15) | −1.00 (−56) | −0.79 (−47) | VII | D |
| 35 | 15 | a | 0.16 (15) | 0.27 (17) | 0.13 (8) | VII | D |
| 36 | 16 | a | 0.34 (31) | 0.61 (37) | −0.35 (−22) | VII | D |
| 37 | 17 | a | 0.26 (24) | 0.62 (38) | 0.52 (32) | VII | D |
| 38 | 18 | a | 0.15 (14) | 0.18 (12) | 0.38 (24) | VII | D |
| 39 | 14 | b | 1.66 (92) | 3.68 (98.2) | 2.57 (93) | VII | D |
| 40 | 15 | b | 1.39 (87) | 0.84 (49) | 0.79 (47) | VII | D |
| 41 | 16 | b | 1.44 (88) | 4.18 (99.0) | 4.32 (99.2) | VII | D |
| 42 | 17 | b | 1.07 (77) | 0.61 (37) | −0.16 (−10) | VII | D |
| 43 | 18 | b | 0.52 (46) | 3.50 (97.7) | 1.02 (57) | VII | D |
| 44 | 19 | b | 0.42 (38) | 0.84 (49) | 1.25 (66) | VII | D |
| 45 | 13 | k | 1.66 (92) | 0.66 (40) | 2.29 (90) | VIII | E |
| 46 | 12 | l | 1.73 (93) | 0.95 (54) | 2.25 (89) | VIII | E |
Experimental references: (I) Armstrong, A.; Ahmed, G.; Dominguez-Fernandez, B.; Hayter, B. R.; Wailes, J. S. J. Org. Chem. 2002, 67, 8610.. (II) Solladié-Cavallo, A.; Jierry, L.; Klein, A.; Schmitt, M.; Welter, R. Tetrahedron: Asymmetry 2004, 15, 3891. (III) Denmark, S. E.; Matsuhashi, H. J. Org. Chem. 2002, 67, 3479. (IV) Armstrong, A.; Dominguez-Fernandez, B.; Tsuchiya, T. Tetrahedron 2006, 62, 6614. (V) Armstrong, A.; Moss, W. O.; Reeves, J. R. Tetrahedron: Asymmetry 2001, 12, 2779. (VI) Armstrong, A.; Tsuchiya, T. Tetrahedron 2005, 62, 257. (VII) Wang, Z.; Shi, Y. J. Org. Chem. 2001, 66, 521. (VIII) Burke, C. P.; Shi, Y. Angew. Chem. Int. Ed. 2006, 45, 4475.
Solvent systems: (A) 3:2 CH3CN:H2O (v:v), dielectric constant, ε, employed in the continuum solvation model: 55 (B) 2:1 dioxane:H2O (v:v), ε = 20 (C) 3:1 CH3CN:H2O (v:v), ε = 47 (D) 3:3:6.4 DMM:CH3CN:H2O (v:v:v), ε = 69 (E) 26:1:2.8 H2O:DMM:DME (v:v:v), ε = 73.
Experimental ΔGTS.
Results at the B3LYP/6-31G*(solution)//B3LYP/6-31G*(vacuum) level. The ee values were obtained from scaled ΔGTS. (Scaling Factor = 2/3).
Results at the B3LYP/6-31G*(solution) level. The ee values were obtained from scaled ΔGTS. (Scaling Factor = 2/3).
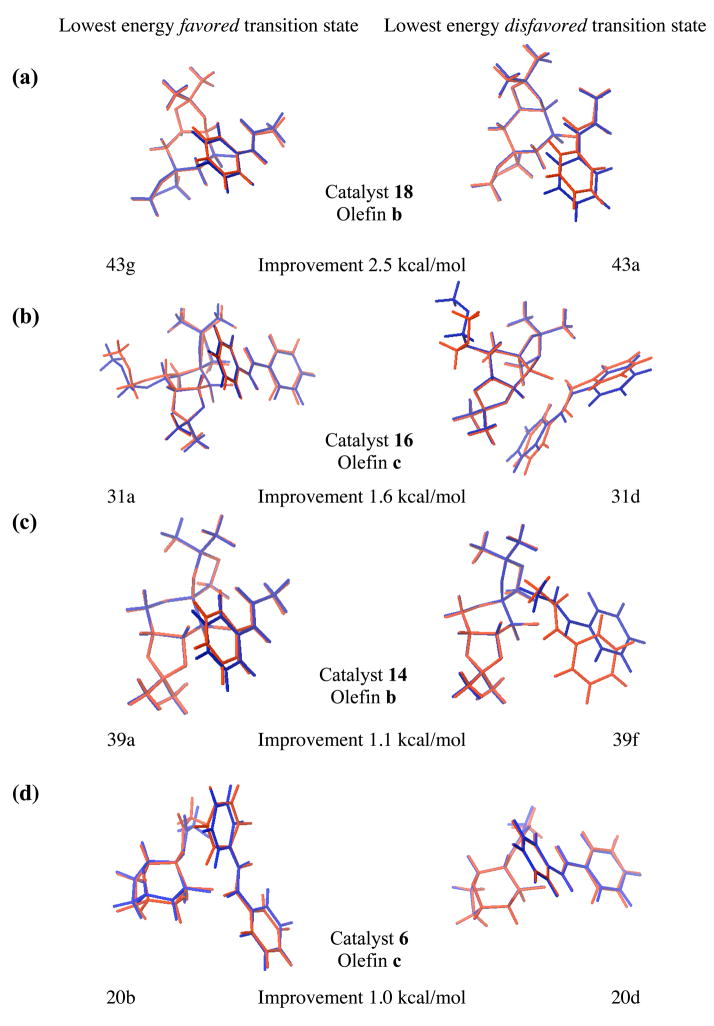
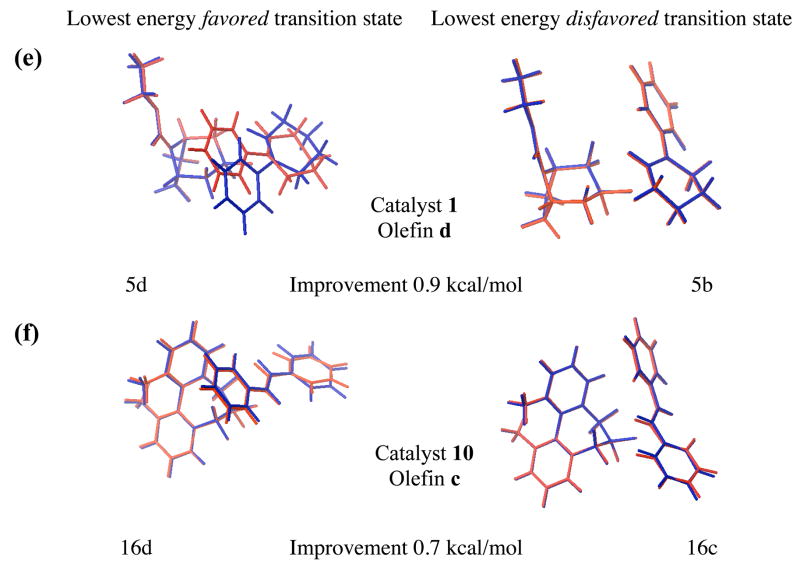
Interestingly, a comparison of Figure 4a and Figure 4b shows a significant improvement in correlation with experimental results when the transition states are optimized in the solution phase, rather than simply estimating solvation energies with single point calculations, with correlation coefficients of 0.46 and 0.64, respectively. This improvement is unsurprising given that all systems treated were aqueous, suggesting that their transition state geometries might change significantly by reoptimizing the vacuum transition states within the solvation model. This strategy differs from that of a number of other publications in which gas phase optimized transition states were employed exclusively under the assumption that the transition state geometries would not vary drastically from vacuum to solution phase.xx Our results show the dubious nature of this common assumption. Figure 5 shows the lowest energy favored and disfavored transition states in vacuum and solution phase for cases which show the most improvement following reoptimization in solution phase. Notably, the two forming bonds (O3-C4 and O3-C5 in Figure 1) are appreciably longer when the transition states are located in solution rather than vacuum phase. In order to quantify this effect we defined average forming bond lengths as a Boltzman weighted average of the corresponding bond lengths of all transition structures. The computed average bond lengths for each reaction are listed in the supporting information (Table S2). Each asynchronous transition state is characterized by two forming average bond lengths, one being shorter then the other. In solution phase these bond lengths are 2.40 ± 0.02 Å (mean ± standard error (s.e.); sample size n = 46) and 2.15 ± 0.01 Å (mean ± s.e.; n = 46) respectively. This is longer than the corresponding averaged bonds lengths of the vacuum transition states, which are 2.30 ± 0.01 Å (mean ± s.e.; n = 46) and 1.97 ± 0.01 Å (mean ± s.e.; n = 46) respectively.
Figure 5.
The lowest energy B3LYP/6-31G*(vacuum) transition state structures (red) superimposed on the B3LYP/6-31G*(solution) transition state structures (blue) for systems which show the most significant improvements following reoptimization of the transition states in solution phase. Reductions in absolute deviations from experimental ΔGTS are also shown.
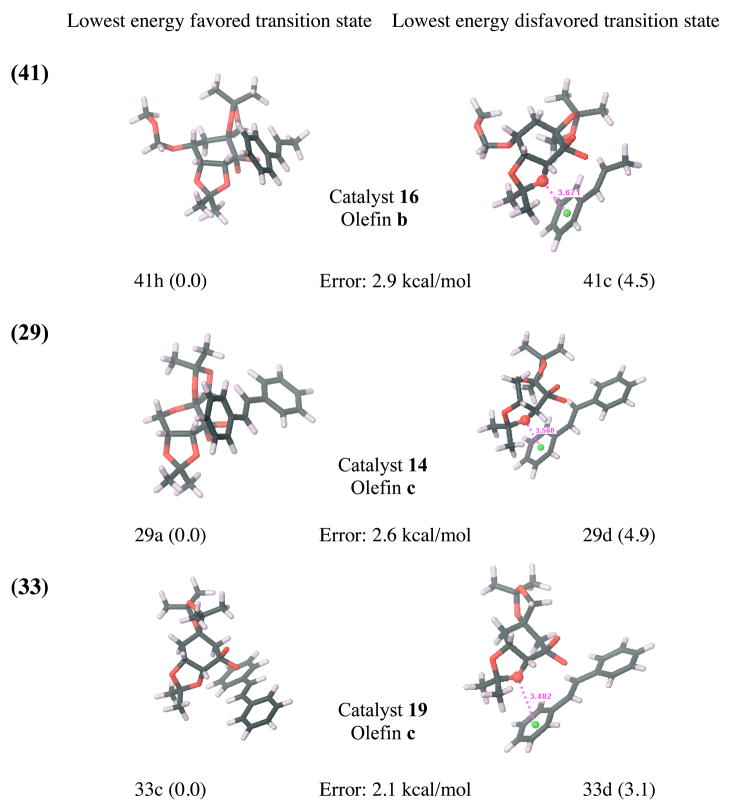
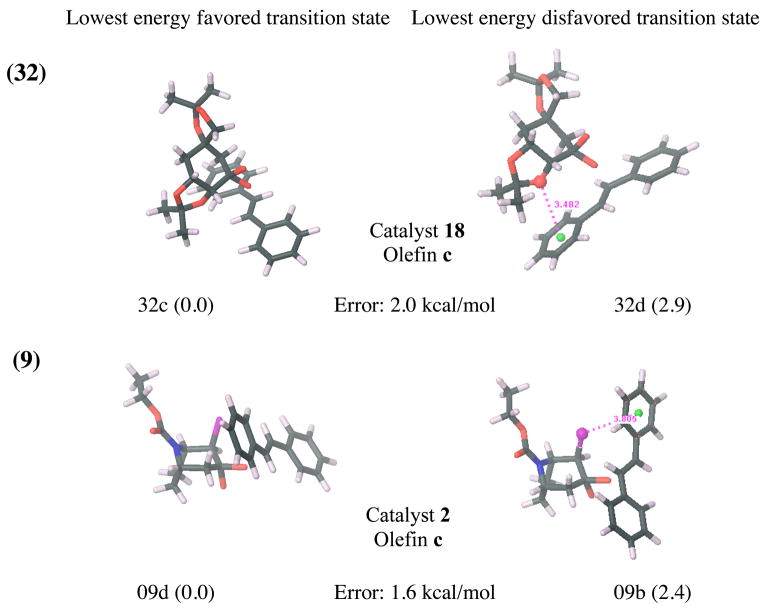
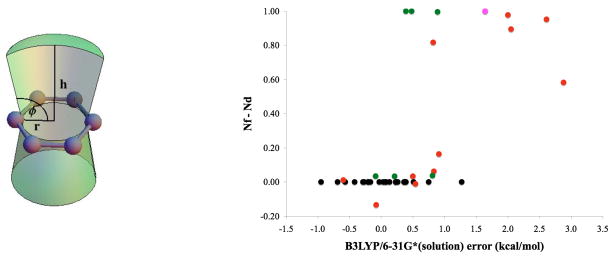
While locating transition states in the solution phase leads to significantly improved results, five outliers persist. Specifically, cases 41, 29, 33, 32 and 9 (listed in decreasing order of error) are not treated well by our model in either vacuum or solution phase and show deviations from experimental ΔGTS larger than 1.5 kcal/mol at the B3LYP/6-31G*(solution) level. All outliers share one common characteristic: the relevant disfavored transition states have either an oxygen or a chlorine atom stacked over the face of a benzene ring (as illustrated in Figure 7). This structural motif seems to be present only for cases with large discrepancies between computation and experiment, but is absent for all other cases. For each ensemble of favored and disfavored B3LYP/6-31G* solution phase transition states, the Boltzman weighted average of the number of oxygen, fluorine or chlorine atoms present in a cone above the plain of each benzene ring was computed as shown in Figure 6a. The differences between these average values of disfavored and favored transition state ensembles were then plotted against the deviation of the computed ΔGTS from experimental values (Figure 6b).
Figure 7.
The lowest energy favored and disfavored transition states at the B3LYP/6-31G* (solution) level for all cases where the error at this level is larger than 1.5 kcal/mol. Deviations (in kcal/mol) from the experimental transition state free energy differences, ΔGTS, are given for each reaction. Relative energies of the transition states (in kcal/mol) are shown in brackets. π-stacking interaction distances between benzene middle points (green) and oxygen or chlorine atoms (in Å) are shown. Atom colors: carbon (black), oxygen (red), hydrogen (white), nitrogen (blue) and chlorine (pink).
Figure 6.
(a). Schematic illustration of the cone volume above benzene rings searched for oxygen, fluorine and chlorine atoms. Benzene carbon atoms are shown in gray. h = 4.0 Å, r = 1.5 Å and φ = 100°.
(b). Difference between disfavored and favored transition state ensembles in the total number of oxygen, fluorine and chlorine atoms (Boltzmann weighted average) present within the cone shown in Figure 6a above each benzene ring plotted against deviation from experiment. black = no atom in cone, red = oxygen in cone, green = fluorine in cone and pink = chlorine in cone.
Based on the well known deficiencies of B3LYP in treating dispersion and especially π-stacking interactionsxix, it is not surprising to see that π-stacking interactions with oxygen and chlorine pose an obstacle for our computational model. However, π-stacking interactions with the smaller and less polarizable fluorine seem to be treated much more accurately by our model. Therefore, because B3LYP generally does not take account of attractive π-stacking interactions, an inflated computed transition state free energy gap could be the result of an artificial energy increase of the disfavored transition state ensemble due to repulsive B3LYP errors for π-stacking interactions. Where π-stacking interactions with oxygen or chlorine are absent from a reaction, dispersion related B3LYP errors are presumably minimized due to fortuitous error cancellation. However, since B3LYP errors for π-stacking interactions are often several kcal/mol higher than the corresponding errors for other types of dispersion interactionsxxi, xxii, differential error likely accumulates where strong π-stacking interactions are present.
In order to test that incorrect treatment of dispersion interactions by B3LYP is a major source of error in our dataset, all transition states of a representative subset of the dataset were reoptimized at the M06-2X/6-31G*(solution) levelxxiii. Truhlar’s M06-2X functional performs well for dispersion dominated complexes as well as for activation energies.18 However, the preliminary results obtained with M06-2X on our dataset are inferior to the B3LYP results. (For a comparison of the statistical performances of all methods employed in this study see Table 2.) The mean unsigned error as well as the correlation between experimental and computed ΔGTS is clearly worse for M06-2X than for B3LYP. It is noteworthy, however, that three of the five B3LYP/6-31G* (solution) outliers improve significantly, namely systems 9, 32 and 33. For those systems the errors with respect to experiment are reduced by 1.4, 1.3 and 0.8 kcal/mol respectively with the M06-2X optimizations. The B3LYP outlier 29 gets significantly worse (error increases by 1.6 kcal/mol) when optimized with M06-2X while for the fifth outlier, 41, M06-2X results are not available due to convergence problems for some of the transition states.
Table 2.
Performance of the methods employed in the current study.
| Method | MUEf | Max Errorg | R2h |
|---|---|---|---|
| B3LYP/6-31G*(solv.)//B3LYP/6-31G*(vac.) | 0.85 | 3.0 | 0.46 |
| B3LYP/6-31G*(solv.) | 0.65 | 2.9 | 0.64 |
| B3LYP/6-311+G**(solv.)//B3LYP/6-31G*(solv.) | 0.73 | 3.1 | 0.36 |
| M06-2X/6-31G*(solv.)i | 1.76 | 5.2 | 0.12 |
Mean unsigned error (kcal/mol) from experimental ΔGTS.
Maximum absolute deviation (kcal/mol) from experimental ΔGTS.
Correlation coefficient for a linear least squares fit to a plot of computed versus experimental ΔGTS.
Due to problems in converging some of the transition state geometries, systems 27, 28, 31, 36, 37, 41, 45, 46 are not included in the M06-2X dataset.
The M06-2X results are somewhat surprising, in view of the strong performance demonstrated by this functional to data on a variety of training sets, and for a wide range of properties. There are several possible explanations for the results, we plan to pursue in future work:
Our solvation model has not been reoptimized for M06-2X; we simply used the model previously optimized for B3LYP. Hence if the charge distributions obtained with M06-02X are sufficiently different (and that might not be an enormous quantitative shift, in view of the small energy differences we are talking about), this could lead to degradation of the relative energetics.
We spent significantly less time creating the optimized transition states for M06-2X than we did when working on the data set with B3LYP. There may for example be alternative minima with the former functional that we did not explore. Again, this could lead problems for specific compounds where one or both of the transition state structures are not in the lowest free energy state.
While M06-2X has displayed encouraging performance for a number of training sets, these data sets are relatively small, and do not cover a broad range of chemical problems. M06-2X also contains a large number of fitting parameters (on the order of 35) as compared to the 3 parameters in B3LYP. Hence, there has to be some concern about overfitting (which would yield superior results for the training set as compared to what one might expect in an application not covered by those data sets) and what we have observed may be one example of this type. Much more work has to be done to rigorously confirm (or deny) this interpretation; however, we feel that it is important to present the data, and conclusions, not least so that other groups can access the data and check our results with their own calculations. To this end, we have supplied all of the data needed for such investigations in our Supplementary Material.
Single point calculations of the solution phase transition states at the B3LYP/6-311+G**(solution)//B3LYP/6-31G*(solution) level were also performed to probe basis set dependence. Table 2 shows that the correlation coefficient becomes notably worse compared to the results obtained with the smaller basis set. One possible reason might simply be due to random errors arising from the fact the geometries are not actually optimized within the larger basis set. Singleton has shown that relative energies at the B3LYP/6-311+G**(vacuum)//B3LYP/6-31G*(vacuum) level vary only by about 0.2 kcal/mol from the energies at the B3LYP/6-311+G**(vacuum)//B3LYP/6-31+G**(vacuum) level for two Shi epoxidations.5b However changes in geometry due to changes in basis set might be larger for transition states optimized in solution phase since the solvation energies also depend on the basis sets used. In addition, since we seek to discriminate free energy differences within a range of only about 2.5 kcal/mol, even small errors in relative energies, which are likely to be negligible for other problems, lead to a dramatic degradation of the correlation with experiment.
Notably, four out of five outliers of the dataset are Shi epoxidations and it is therefore not surprising that the MUE for the Shi epoxidations (entries 29–46) is significantly higher than for the non-Shi epoxidations (entries 1–28), with values of 1.02 and 0.41 kcal/mol at the B3LYP/6-31G*(solvent) level, respectively. Inaccurate treatment of dispersion interactions by B3LYP is one likely reason for this discrepancy. However, additional factors could further explain the computational model’s difficulty in modeling the Shi epoxidation in particular.
First, dioxirane-catalyzed epoxidations have been shown to be particularly sensitive to solvent selection, presumably because the transition state exhibits enhanced hydrogen bonding.4b In cases where the olefin contains hydrophobic groups (such as phenyl substituents), hydrophobic effects likely also influence the enantioselectivity. However, continuum solvation models might not accurately capture such solvation effects. Notably, the sugar-derived dioxirane catalysts employed by Shi (catalysts 12–19) contain many potential hydrogen bond acceptors and the corresponding reactions are also performed in highly polar solvent systems. Therefore, errors due to approximating the solvent with a dielectric continuum are likely to be largest for the Shi epoxidation reactions. A plot of MUE against the number of hydrogen bond acceptors can be found in the supporting information (Figure S3).
Secondly, as noted by Singleton and Houk,4,5b the Shi epoxidation can have many conformationally distinct low-energy transition states. To quantify the degree of conformational flexibility for each reaction, each catalyst and olefin was subjected to conformational searching within MacroModel using the OPLS 2001 force field employing 20,000 steps. The sum of unique conformations of catalyst and olefin conformations within 5 kcal/mol was then taken as a measure of the conformational flexibility of a system. Accordingly we found that the Shi epoxidation catalysts (entries 29–46 in table 1) show a distinctly higher degree of conformational flexibility compared to the rest of the dataset with values of 52 ± 11 (mean ± s.e.; n = 18) and 17 ± 11 (mean ± s.e.; n = 28) respectively. Even though we tried to search conformational space as completely as possible according to our protocol described in the methods section, we cannot exclude the possibility that for some flexible systems there might exist low energy conformations of transition states not considered in this study. Therefore, part of the observed errors for the more flexible Shi epoxidations could also results from incomplete conformational searching.
Much debate within the literature has centered around whether the dioxirane-mediated epoxidation proceeds through a spiro or planar transition state, as shown in Figure 1. Computational studies at various levels of theory have shown the preference of spiro over planar transition states for small model systems3, 4, xxiv. However, Shi has proposed that some reactions with sterically hindered transition states as well as reactions involving cis-olefins proceed through planar transition states10. In agreement with the results obtained by Singleton5b, the results of our work indicate that all relevant low energy transition states are either spiro or hybrid spiro-planar. No relevant transition states with a completely planar geometry were found. In order to classify the degree of rotation in transition states for each reaction, Boltzman-weighted averages of the dihedral angles, θ, as shown in Figure 8, were computed.
Figure 8.
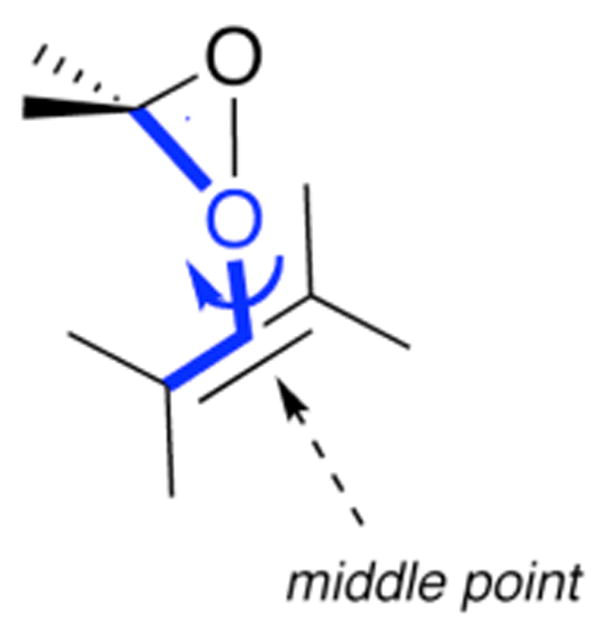
Schematic illustration of the dihedral angle θ (shown in blue).
For each ensemble of favored and disfavored transition states the averaged dihedral angles of the solution phase transition states are listed in the supporting information (Table S3). Interestingly, dihedral angles for the disfavored transition states deviate more from 90° (which corresponds to a perfect spiro transition state) than do the dihedral angles for the favored transition states, with average values for the whole dataset of 117 ± 2° (mean ± s.e.; n = 46) and 100 ± 1° (mean ± s.e.; n = 46) respectively. This suggests that the disfavored transition states are often distorted from spiro in order to reduce steric clashes. However, while Shi proposed that this distortion leads to planar transition states, we show that less distorted hybrid spiro-planar transition states result instead. In addition, the degree of rotation in the transition states seems to be at least partly responsible for the increased energy of the disfavored transition states as compared to the favored ones.
Other groups have illustrated the importance of asynchronous transition structures3–5. Unsurprisingly, we find that the transition state asynchronicity is generally larger for asymmetrically substituted than for symmetrically substituted olefins. In order to quantify these effects, we defined asynchronicity as the absolute difference between the two forming bond lengths (O3-C4 and O3-C5 distances in Figure 1). Representative bond lengths for each reaction were computed as the Boltzman-weighted averages of the corresponding shorter and longer distances of all transition states. Asynchronicities for each reaction were then computed as absolute differences between the Boltzman-weighted distance averages. Table 3 shows mean asynchronicities for all olefins present in the dataset (ordered according to increasing asynchronicity). The electron deficient 2-cyclohexenone (olefin j) forms transition states with lowest asynchronicity. The symmetrically substituted trans-stilbene (olefin c) forms transition states with clearly lower asynchronicity than the other asymmetrically substituted olefins. Consistent with previous findings5b, xxv a dioxirane-catalyzed epoxidation is an electrophilic process, i.e. we find a Boltzmann-weighted partial chargexxvi on the olefin-part of the transition states with an average value of 0.38 ± 0.01 (mean ± s.e.; n = 46). Considering the electrophilic nature of the epoxidations, it is not surprising that we find the longer of the two forming bonds always to be the one between the dioxirane-oxygen and the carbon α to conjugated substituents such as phenyl or alkenexxvii. Olefin h displays the longer forming bond as expected always between the dioxirane oxygen and the carbon α to the two phenyl substituents. Olefin f, containing two symmetrically arranged phenyl substituents, as well as olefin j with very low asynchronicity both show no clear trends in which of the two forming bond lengths is shorter in the transition states.
Table 3.
Asynchronicities for all olefins of the dataset.
| Olefin | Asynchronicity (Å) (mean ± s.e.j) | nk |
|---|---|---|
| j | 0.07 | 1 |
| c | 0.11 ± 0.02 | 13 |
| f | 0.19 | 1 |
| b | 0.25 ± 0.01 | 11 |
| e | 0.26 | 1 |
| d | 0.30 ± 0.02 | 3 |
| i | 0.33 | 1 |
| l | 0.34 | 1 |
| h | 0.37 ± 0.06 | 2 |
| a | 0.38 ± 0.01 | 9 |
| g | 0.41 ± 0.01 | 2 |
| k | 0.45 | 1 |
Standard error.
Sample size.
Conclusions
In conclusion, we present the first fully quantum mechanical study of quantitative computational modeling of enantioselectivity for a large dataset. Our results indicate that optimization of transition states within a solvation model is critical to the accurate and robust prediction of experimental results. We find that the two forming bonds (O3-C4 and O3-C5 in Figure 1) are appreciably longer when the transition states are located in solution rather than vacuum phase. We generally located distorted spiro transition states (Figure 1) and showed that the degree of rotation of the transition states (measured by the dihedral angle θ shown in Figure 7) seems to play an important role in determining the enantioselectivity of a reaction. Specifically, we find that the disfavored transition states show in average a stronger distortion from spiro than the favored ones. Finally, we show that B3LYP’s problems in treating dispersion and especially π-stacking interactions are likely to be part of the reason for the few observed large discrepancies between experiment and computation. Our results illuminate the possibility of employing quantum mechanical predictions to facilitate the discovery of new reactions and catalysts in an efficient and promising way. Future work continues to explore ways of increasing the accuracy of our first generation model. Such approaches for example include applying semiempirical dispersion corrections to Density Functional Theory. Because construction of the manual transition state guesses involves a significant amount of work, we are currently automating our protocol in order to simplify large-scale virtual screening of chiral catalysts.
Supplementary Material
Acknowledgments
RB thanks the National Science Foundation (CHE-06-40407) and RAF thanks the Department of Energy (90ER14162) and the National Institutes of Health (GM 40526) for financial support of this research.
Footnotes
Supporting Information Available: Coordinates, energies, and imaginary frequencies o f transition states. Results at the M06-2X/6-31G*(solvation) and B3LYP/6-311+G**(solvation)//B3LYP/6-31G*(solvation) level as well as additional plots and tables mentioned in the main text, including pictures of all relevant transition states not shown in the main text. This material is available free of charge via the Internet at http://pubs.acs.org.
Contributor Information
Ronald Breslow, Email: rb33@columbia.edu.
Richard Friesner, Email: rich@chem.columbia.edu.
References
- i.(a) Corbeil CR, Thielges S, Schwartzentruber JA, Moitessier N. Angew Chem Int Ed. 2008;47:2635–2638. doi: 10.1002/anie.200704774. [DOI] [PubMed] [Google Scholar]; (b) Moitessier N, Henry C, Len C, Chapleur Y. J Org Chem. 2002;67:7275–7282. doi: 10.1021/jo0258148. [DOI] [PubMed] [Google Scholar]
- ii.Jaguar 7.0. Schrödinger, Inc; Portland, OR: 2007. [Google Scholar]
- iii.(a) Lang TJ, Wolber GJ, Bach RD. J Am Chem Soc. 1981;103:3275. [Google Scholar]; (b) Bach RD, Wolber GJ. J Am Chem Soc. 1984;106:1410–1415. [Google Scholar]; (c) Bach RD, Coddens BA, McDouall JJW, Schlegel HB, Davis FA. J Org Chem. 1990;55:3325–3330. [Google Scholar]; (d) Bach RD, Owensby AL, Gonzalez C, Schlegel HB, McDouall JJW. J Am Chem Soc. 1991;113:2338–2339. [Google Scholar]; (e) Bach RD, Andres JL, Davis FA. J Org Chem. 1992;57:613–618. [Google Scholar]; (f) Bach RD, Andres JL, Owensby AL, Schlegel HB, McDouall JJW. J Am Chem Soc. 1992;114:7207–7217. [Google Scholar]; (g) Bach RD, Winter JE, McDouall JJW. J Am Chem Soc. 1995;117:8586–8593. [Google Scholar]; (h) Bach RD, Glukhovtsev MN, Gonzalez C, Marquez M, Estevez CM, Baboul AG, Schlegel HB. J Phys Chem A. 1997;101:6092–6100. [Google Scholar]; (i) Bach RD, Dmitrenko O, Adam W, Schambony S. J Am Chem Soc. 2003;125:924–934. doi: 10.1021/ja026882e. [DOI] [PubMed] [Google Scholar]; (j) Dmitrenko O, Bach RD. J Phys Chem A. 2004;108:6886–6892. [Google Scholar]
- iv.(a) Houk KN, Liu J, DeMello NC, Condroski KR. J Am Chem Soc. 1997;119:10147–10152. [Google Scholar]; (b) Jenson C, Liu J, Houk KN, Jorgenson WL. J Am Chem Soc. 1997;119:12982–12983. [Google Scholar]; (c) Washington I, Houk KN. Angew Chem Int Ed. 2001;40:4485–4488. doi: 10.1002/1521-3773(20011203)40:23<4485::aid-anie4485>3.0.co;2-n. [DOI] [PubMed] [Google Scholar]; (d) Armstrong A, Washington I, Houk KN. J Am Chem Soc. 2000;122:6297–6298. [Google Scholar]; (e) Lucero MJ, Houk KN. J Org Chem. 1998;63:6973–6977. doi: 10.1021/jo980760g. [DOI] [PubMed] [Google Scholar]
- v.(a) Singleton DA, Merrigan SR, Liu J, Houk KN. J Am Chem Soc. 1997;119:3385–3386. [Google Scholar]; (b) Singleton DA, Wang Zhihong. J Am Chem Soc. 2005;127:6679–6685. doi: 10.1021/ja0435788. [DOI] [PubMed] [Google Scholar]; (c) Christian CF, Takeya T, Szymanski MJ, Singleton DA. J Org Chem. 2007;72:6183–6189. doi: 10.1021/jo070777b. [DOI] [PMC free article] [PubMed] [Google Scholar]
- vi.(a) Freccero M, Gandolfi R, Sarzi-Amade M, Rastelli A. J Org Chem. 2005;70:9573–9583. doi: 10.1021/jo0515982. [DOI] [PubMed] [Google Scholar]; (b) Freccero M, Gandolfi R, Sarzi-Amade M, Rastelli A. J Org Chem. 2004;69:7479–7485. doi: 10.1021/jo048980j. [DOI] [PubMed] [Google Scholar]; (c) Freccero M, Gandolfi R, Sarzi-Amade M, Rastelli A. J Org Chem. 2002;67:8519–8527. doi: 10.1021/jo026141w. [DOI] [PubMed] [Google Scholar]; (d) Freccero M, Gandolfi R, Sarzi-Amade M, Rastelli A. J Org Chem. 2000;65:8948–8959. doi: 10.1021/jo000900y. [DOI] [PubMed] [Google Scholar]; (e) Freccero M, Gandolif R, Sarzi-Amade M, Rastelli A. J Org Chem. 2000;65:2030–2042. doi: 10.1021/jo991530k. [DOI] [PubMed] [Google Scholar]; (f) Freccero M, Gandolfi R, Sarzi-Amade M, Rastelli A. J Org Chem. 1999;64:3853–3860. [Google Scholar]; (g) Freccero M, Gandolfi R, Sarzi-Amade M, Rastelli A. Tetrahedron. 1998;54:12323–12336. [Google Scholar]; (h) Freccero M, Gandolfi R, Sarzi-Amade M, Rastelli A. Tetrahedron. 1998;54:6123–6134. [Google Scholar]; (i) Markad SD, et al. J Org Chem. 2008;73:6341–6354. doi: 10.1021/jo800979a. [DOI] [PubMed] [Google Scholar]
- vii.Yang D. Acc Chem Res. 2004;37:497–505. doi: 10.1021/ar030065h. [DOI] [PubMed] [Google Scholar]
- viii.Wang ZX, Tu Y, Frohn M, Zhang JR, Shi Y. J Am Chem Soc. 1997;119:11224. [Google Scholar]
- ix.Bartlett PD. Rec Chem Prog. 1957;18:111. [Google Scholar]
- x.(a) Tian H, She Z, Shu L, Yu H, Shi Y. J Am Chem Soc. 2000;122:11551–11552. [Google Scholar]; (b) Tian H, She Z, Xu J, Shi Y. Org Lett. 2001;3:1929–1931. doi: 10.1021/ol010066e. [DOI] [PubMed] [Google Scholar]; (c) Shi Y. Acc Chem Res. 2004;37:488–496. doi: 10.1021/ar030063x. [DOI] [PubMed] [Google Scholar]
- xi.MacroModel 6.0. Schrödinger, Inc; Portland OR: [Google Scholar]
- xii.Jorgensen WL, Maxwell DS, Tirado-Rives J. J Am Chem Soc. 1996;118:11225–11236. [Google Scholar]
- xiii.This proved to be necessary as we observed many transition states that were neither completely planar, nor completely spiro, but rather a hybrid. This phenomenon has also been reported by Singleton et al.5b
- xiv.Throughout text we will use B3LYP/6-31G*(solvation)//B3LYP/6-31G*(vacuum) to indicate single point calculations within the solvation model on the transition states optimized in vacuum.
- xv.(a) Venables DS, Schmuttenmaer CA. J Chem Phys. 1998;108:4935–4944. [Google Scholar]; (b) Ahn-Ercan G, Krienke H, Schmeer G. J Mol Liquids. 2006;129:75–79. [Google Scholar]
- xvi.Jaguar 7.0 user manual. Schrödinger, Inc; Portland OR: [Google Scholar]
- xvii.keywords icavity=2 and isurf=1
- xviii.Zhao Y, Truhlar DG. Acct Chem Res. 2008;41:157–167. doi: 10.1021/ar700111a. [DOI] [PubMed] [Google Scholar]
- xix.(a) Johnson ER, Wolkow RA, DiLabio GA. Chem Phys Lett. 2004;394:334. [Google Scholar]; (b) Tsuzuki S, Üthl HP. J Chem Phys. 2001;114:3949. [Google Scholar]; (c) Ye X, Li ZH, Wang W, Fan K, Xu W, Hua Z. Chem Phys Lett. 2004;397:56. [Google Scholar]; (d) Godfrey-Kittle A, Cafiero M. Int J Quant Chem. 2006;106:56. [Google Scholar]
- xx.(a) Silva MA, Bellenie R, Goodman JM. Org Lett. 2004;6:2559. doi: 10.1021/ol0491641. [DOI] [PubMed] [Google Scholar]; (b) Bach RD, Glukhovtsev MN, Gonzalez C. J Am Chem Soc. 1998;120:9902. [Google Scholar]; (c) Cheong PHY, Yun H, Danishefsky SJ, Houk KN. Org Lett. 2006;8:1513. doi: 10.1021/ol052862g. [DOI] [PMC free article] [PubMed] [Google Scholar]
- xxi.This is illustrated by comparing the B3LYP/6-31G* errors for the stacked (C2h) and the T-shaped (C2v) benzene dimers. Single point B3LYP/6-31G* calculations on ab initio geometries reported by Urecka22 give binding energies of 2.58 and 0.18 kcal/mol for the stacked and the T-shaped benzene-dimers, respectively, while best estimates for these interaction energies are −2.73 and −2.74 kcal/mol. Therefore B3LYP seems to give the largest repulsive errors for systems showing strong π-stacking interactions.
- xxii.Jurečka P, Šponer J, Černý J, Hobza P. Phys Chem Chem Phys. 2006;8:1985–1993. doi: 10.1039/b600027d. [DOI] [PubMed] [Google Scholar]
- xxiii.Zhao Y, Truhlar D. Theor Chem Acc. 2008;120:215–241. [Google Scholar]
- xxiv.Crehuet R, Anglada JM, Cremer D, Bofill JM. J Phys Chem A. 2002;106:3917–3929. [Google Scholar]
- xxv.Dufert A, Werz DB. J Org Chem. 2008;73:5514–5519. doi: 10.1021/jo800692z. [DOI] [PubMed] [Google Scholar]
- xxvi.Computed as the sum over all mulliken charges of the olefin atoms at the B3LYP/6-31G*(solution) level.
- xxvii.Only exceptions to this rule are a few high energy transition states, i.e. 41a, 41e, 42b (solution phase structures) as well as 39f, 40a, 41a, 41e, 42b (vacuum structures).
Associated Data
This section collects any data citations, data availability statements, or supplementary materials included in this article.


