Abstract
There has been growing interest in the use of rapid and selective separation methods such as high-performance affinity chromatography (HPAC) or affinity capillary electrophoresis (ACE) for the characterization of drug-protein interactions. L-Tryptophan is commonly used in these and other methods as a site-selective probe for examining the binding of small solutes and drugs at Sudlow site II on the protein human serum albumin (HSA). However, solutions of L-tryptophan can be unstable and are generally prepared fresh daily for these studies. In this report, HPAC was used to examine other indole compounds as possible replacements for L-tryptophan as a site-selective probe for use in the high-throughput screening of drug binding to HSA; the implications of these results in the use of such compounds in ACE were also considered. The probe candidates that were tested included indole-3-acetic acid, indole-3-carboxylic acid, indole-3-butyric acid, indole-3-propionic acid, indole-3-methanol, 3-acetylindole, and 3-methylindole. All of these compounds were found by 1H NMR spectroscopy and UV/vis spectroscopy to be stable for up to three weeks at room temperature when in pH 7.4, 0.067 M phosphate buffer. The binding of these compounds was examined by using columns that contained immobilized HSA. 3-Acetylindole was found to be the best candidate in this group for use as an alternative probe to L-tryptophan for Sudlow site II. This probe had the same binding site and a similar affinity to L-tryptophan but was more stable in aqueous solution, making it suitable for high-throughput screening of drug-HSA binding in both HPAC and ACE.
Keywords: Human serum albumin, Sudlow site I, L-tryptophan, indole compounds, drug-protein binding, high-performance affinity chromatography, affinity capillary electrophoresis
1 Introduction
Human serum albumin (HSA) is a soluble protein that is responsible for the binding and transportation of many low-molecular-weight compounds in blood [1]. The interaction of drugs with this protein is known to affect such properties as the distribution, excretion, toxicity and activity of pharmaceutical agents [2]. Many drugs are thought to bind to a series of relatively well-defined regions on this protein. The two regions that are most commonly involved in these interactions are the warfarin-azapropazone site of HSA (also known as Sudlow site I) and the indole-benzodiazepine site (Sudlow site II). Crystallographic studies have identified the location of these sites as being in the IIA and IIIA subdomains of HSA, respectively [3,4].
L-Tryptophan is an essential amino acid and a precursor of serotonin [5]. L-Tryptophan is known to bind to Sudlow site II of HSA and is commonly used as a site-selective probe for this region in drug binding sites [6–8]. The main disadvantage of this probe is L-tryptophan’s relatively instability in aqueous solutions, requiring that fresh samples and solutions of this chemical be prepared on a daily basis. This instability is thought to be due, in part, to the oxidation of tryptophan. Degradation products that have been noted when aqueous solutions of L-tryptophan are exposed to ultraviolet light include N-formylkynurenine, kynurenine, dioxindolyalanine, aminoindolenine, cinnoline, and quinazoline, although other products are possible in the presence of methylene blue (i.e., an oxidizing agent) [9–11]. Although other compounds have been used as probes for Sudlow site II (e.g., dansylsarcosine and various benzodiazepines), the well-characterized and selective interaction that occurs between L-tryptophan and HSA has continued to make L-tryptophan popular as probe in drug binding studies despite its stability problems [6–8].
Many techniques have been utilized to study drug interactions with HSA. These techniques include X-ray crystallography [12,13], fluorescence spectroscopy [14], absorption spectroscopy [14], ultrafiltration or dialysis [15–17], capillary electrophoresis [18,19], surface plasmon resonance [20] and nuclear magnetic resonance (NMR) spectroscopy [21]. High-performance affinity chromatography (HPAC) and affinity capillary electrophoresis (ACE) are two “non-gel” separation methods that can also be used for such studies. HPAC can be employed in investigations of drug-HSA interactions by utilizing an HPLC support that contains immobilized HSA as the stationary phase [22–29], with results that have been shown to give good correlation with the behavior reported for HSA in solution [25,30–36]. ACE can make use of soluble HSA in the study of drug interactions and competition, and has also been shown to give correlation versus reference techniques in work with HSA and related proteins [37–42]. The relative high speed of these methods and their ability to be used as part of automated systems have made both HPAC and ACE attractive for use in the high-throughput screening and analysis of binding by drugs to proteins such as HSA [22,23,37,38].
The object of this study is to examine several indole compounds as possible alternatives to L-tryptophan for use as site-selective probes for Sudlow site II of HSA. The compounds that will be considered are shown in Figure 1. One item of particular interest is whether one or more of these structural analog of L-tryptophan can be used as a selective probe for HSA while reducing or eliminating the problems with instability that occur for L-tryptophan in an aqueous solution. The variety of analogs that are available for L-tryptophan is an appealing feature of working with this class of agents in such a study. The long-term stability of these compounds in pH 7.4 phosphate buffer will be examined by 1H NMR and UV/vis spectroscopy, as well as by HPAC using HSA columns. Frontal analysis will be used to characterize the binding of these compounds with HSA at pH 7.4 and 37°C. Competition studies between these compounds and L-tryptophan will be performed to see if these agents interact with Sudlow site II. From this information, it should be possible to determine if any of these indole-related compounds can be used as an alternative to L-tryptophan as site-selective probes when HPAC is employed for the high-throughput analysis of binding by drugs and other chemicals to HSA. The extension of these results to work involving ACE for drug-protein binding studies will also be considered.
Figure 1.
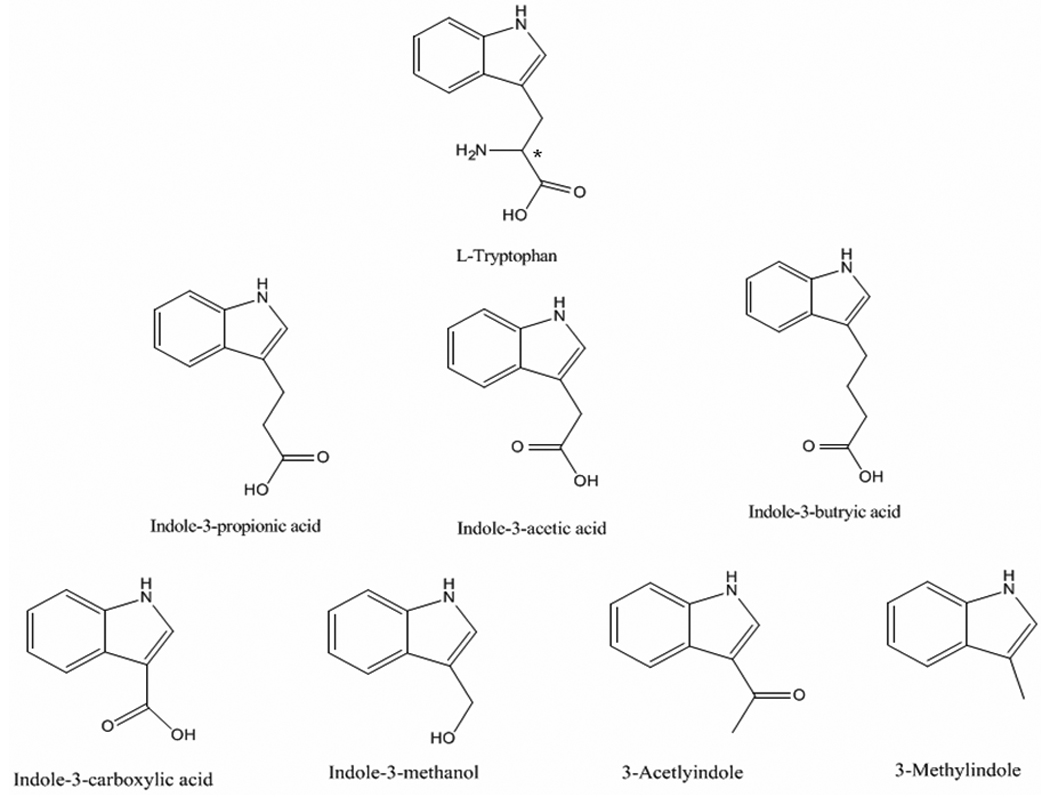
Structures of several probe candidates for Sudlow site II of HSA. The asterisk shows the location of the chiral center in tryptophan.
2 Materials and methods
2.1 Reagents
The HSA (Cohn fraction V, 99% globulin and fatty acid free) and L-tryptophan (99.5% pure) were from Sigma (St. Louis, MO, USA). The Nucleosil Si-300 (7 µm particle diameter, 300 Å pore size) was obtained from Alltech (Deerfield, IL, USA). All aqueous solutions were prepared using water from a Nanopure water system (Barnstead, Dubuque, IA, USA). Indole-3-acetic acid (98%), indole-3-carboxylic acid (99%), indole-3-butyric acid (99%), indole-3-propionic acid (99%), indole-3-methanol (98%), 3-acetylindole (98%), and 3-methylindole (98%) were obtained from Aldrich (Milwaukee, WI, USA). Deuterated dimethylsulfoxide (DMSO-d6) (99.96% pure) was obtained from Aldrich (St. Louis, MO, USA). Deuterium oxide (>98%) was purchased from Cambridge Isotopes (Andover, MA, USA).
2.2 Apparatus
The HPLC system consisted of two Jasco PU-980 pumps (Easton, MD, USA), a Dynamax S200 pump (Woburn, MA, USA), and a Waters 509 UV/vis absorbance detector (Milford, MA, USA). Data were collected from this system using LabView 5.1 software (National Instruments, Austin, TX, USA). Injections were made using a Rheodyne valve (Rohnert Park, CA, USA) equipped with a 20 µL sample loop. The column temperature was controlled using a Fisher Scientific 9100 circulator (Pittsburgh, PA, USA) and an Alltech water jacket. Columns were downward packed using an HPLC slurry packer from Alltech.
The pH meter used to prepare samples for the NMR studies was an IQ240 (IQ Scientific Instruments, Carlsbad, CA, USA) equipped with an ion selective field effect transistor (ISFET) probe. The NMR spectra were acquired on a Bruker DRX Avance 400 MHz NMR using a QNP probe and X-WinNMR as the processing program (Bruker, Billerica, MA, USA). These spectra were analyzed using Nuts from Acorn NMR (Livermore, CA, USA) and XWIN PLOT from Bruker. Sixty-four scans were acquired during each 1H NMR experiment. UV/vis spectra were acquired by using a Shimadzu UV-2401 spectrophotometer (Kansas City, MS, USA) with matched quartz cuvettes. These spectra were obtained from 400 to 200 nm in 0.5 nm intervals.
2.3 NMR analysis and stability studies
Deuterated phosphate buffer was prepared by adding 0.0912 g of monobasic potassium phosphate to 10.0 mL deuterium oxide to create a 0.067 M phosphate solution. A second 0.067 M phosphate solution was made by adding 0.1167 g dibasic potassium phosphate to 10.0 mL deuterium oxide. These two solutions were mixed to create a pH 7.4 phosphate buffer (or pD when using the deuterated buffer salts).
A saturated solution (i.e., containing roughly 200 µM) of each probe candidate was prepared in the pH 7.4, 0.067 M deuterated phosphate buffer for use in the NMR stability studies. These saturated solutions were prepared by adding the compounds in excess to the deuterated buffer, followed by sonication of these solutions for several hours. The samples were then centrifuged to remove any undissolved material and the supernatant was removed for analysis by NMR. Immediately following the preparation of each sample, a 1H NMR spectrum was taken. Each sample was then separated into two portions which were stored at 25°C in the dark or in the presence of normal laboratory lighting. 1H NMR spectra were acquired for these samples over the course of 3–4 weeks. These solutions were also examined visually throughout this period of time for any changes in color or signs of precipitation.
In later experiments, stability studies were also conducted to compare L-tryptophan with 3-acetylindole, one of the alternative probes identified in this study. The stability of these two compounds in a pH 7.4, 0.067 M phosphate buffer was compared was by using zonal elution (see Section 2.5) and UV/Vis spectroscopy. This latter method was performed over the course of several weeks by using an approximately 100 µM solution of each compound stored at 25°C or 4°C and in the dark or in the presence of normal laboratory lighting.
2.4 Column preparation
Diol-bonded silica for preparation of the immobilized HSA column was made from Nucleosil Si-300 silica according to a previous method [43]. The diol content of this support was 164 (± 7) nmol/g silica, as determined through the use of an iodometric capillary electrophoresis method [44]. HSA was immobilized onto a portion of this support using the Schiff base method [32], resulting in a final support that contained 40 (± 2) mg HSA/g silica. This support has been found in many previous reports to be a good model for soluble HSA in drug binding experiments [25, 30–36]. A second portion of the diol-bonded silica was taken through the Schiff base method but with no HSA being added during the immobilization step. This latter support was utilized to prepare a control column that could be used to examine and correct for non-specific binding by each tested solute on the support or chromatographic system.
The immobilized HSA support and control support were downward slurry-packed at 3000 psi (20.7 MPa) into separate 5 cm × 2.1 mm i.d. stainless steel columns using pH 7.4, 0.067 M potassium phosphate buffer as the packing solution. These columns were stored at 4°C in pH 7.4, 0.067 M potassium phosphate buffer when not in use. The mobile phase used with these columns for drug binding studies was pH 7.4, 0.067 M potassium phosphate buffer. Prior to its use, this mobile phase was filtered through a 0.2 µm cellulose acetate filter and degassed under vacuum for 15 min.
2.5 Chromatographic binding studies
The samples for frontal analysis were all prepared in pH 7.4, 0.067 M potassium phosphate buffer and were applied to the immobilized HSA column and control column at 0.5 mL/min (typical back pressure, 300–400 psi). These studies were carried out at 37°C and using analyte concentrations that ranged from 0.5 µM to 30 µM. These samples were all stored at 4°C when not in use. The elution of all compounds tested in this study was monitored at 260 nm.
During the frontal analysis experiments, the pH 7.4 phosphate buffer was passed through the immobilized HSA column until a stable baseline was obtained, at which point a valve was used to switch to the application of a solution containing the same buffer plus a known concentration of the probe candidate of interest. This probe candidate solution was applied until a breakthrough curve was formed and a stable plateau in response was obtained, as shown in Figure 2(a). A valve was then used to reapply only pH 7.4, 0.067 M phosphate to the column; this step served to elute the retained probe candidate and to regenerate the column for the next experiment. Identical experiments were performed on the control column to measure and account for any non-specific interactions of the probe candidate with the support or chromatographic system. The mean breakthrough time during each frontal analysis experiment was determined using an in-house program written in LabView 5.1.
Figure 2.
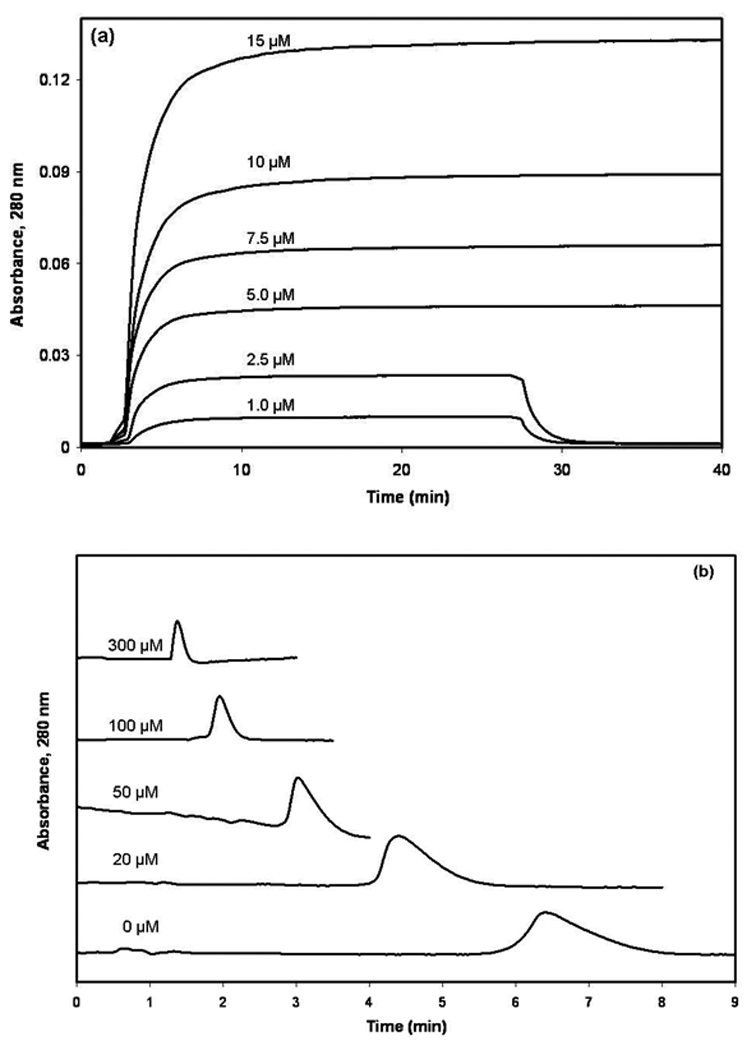
(a) Typical breakthrough curves seen during the frontal analysis studies that were performed for this report and (b) typical results obtained during the zonal elution studies examining the competition of a probe candidate with L-tryptophan. The concentrations that are shown by these curves represent (a) the applied concentration of 3-acetylindole or (b) the concentrations of L-tryptophan in the mobile phase. All other conditions are given in the text.
The mobile phase used in the zonal elution studies was pH 7.4, 0.067 M potassium phosphate buffer that contained 0 to 300 µM L-tryptophan. These solutions were prepared fresh on a daily basis. The injected samples contained 20 µM of the desired probe candidate dissolved in the solution of L-tryptophan that was being used as the mobile phase. Replicate 20 µL injections of each probe candidate sample were made in each mobile phase. Some typical results are shown in Figure 2(b) (Note: no significant change in retention for these samples was noted when using lower sample concentrations, indicating that linear elution conditions were present for these analytes). The retention time for each injected compound was determined from the central moment of its observed peak. The column void time was determined by injecting a non-retained compound (i.e., sodium nitrate) onto the HSA column or control column. The extra-column void time was determined by injecting sodium nitrate onto the chromatographic system with no column present. Similar zonal elution studies were used to evaluate the long-term stability of L-tryptophan and 3-acetylindole by storing these samples at 4°C in the dark and injecting them periodically over the course of several weeks onto the HSA column.
3 Results and discussion
3.1 Selection and stability of probe compounds
The probe candidates shown in Figure 1 were originally chosen based on their structural resemblance to L-tryptophan. It has been noted previously that the indole ring on L-tryptophan is a key component in the interaction of this solute with HSA [1,4]. Thus, all of the selected probe candidates had indole rings with side groups at the 3-position, the same position at which L-tryptophan has a substituent on its indole ring. One difference between the selected probe candidates and L-tryptophan is that these candidates all lack a chiral center. This was a desirable feature for the use of such probes in drug-protein binding studies because it avoids the added complexity or expense that arises when the chiral forms of a solute have different interactions with HSA, as occurs for D- and L-tryptophan [45]. Other more minor issues that were considered during the initial selection of these probe candidates included their relative cost, purity, and solubility in an aqueous solution (see Table 1).
Table 1.
Purity, cost and solubility of selected probe candidates for Sudlow site IIa
| Compound | Cost/g ($) | Available Purity | Solubility (mg/L) |
|---|---|---|---|
| Indole-3-acetic acid | 3.32 | 98% | ≤ 1500 |
| Indole-3-carboxylic acid | 22.60 | 99% | ≤ 1610 |
| 3-Acetylindole | 18.90 | 98% | ≤ 1590 |
| 3-Methylindole | 3.22 | 98% | ≤ 1320 |
| Indole-3-butyric acid | 5.36 | 99% | ≤ 250 |
| Indole-3-propionic acid | 11.66 | 99% | ≤ 3940 |
| Indole-3-methanol | 10.60 | 98% | ≤ 8340 |
| L-Tryptophan | 10.20 | 98.5% | ≤ 2040 |
The costs and purities provided are based on data obtained from commercial suppliers in 2007. The solubilities listed are based on the Merck index.
The main issue of concern with the use of L-tryptophan as a probe for HSA was the limited stability of this chemical in an aqueous solution. This problem is illustrated in Figure 3(a), in which UV/Vis spectra were acquired over the course of several days for a solution that contained 110 µM L-tryptophan in pH 7.4, 0.067 M phosphate buffer. In this example, storing the solution of L-tryptophan at 25°C in the presence of normal laboratory lighting gave rise to significant changes in the UV/vis spectra within two days of this solution's preparation (note: the same solution when stored in the dark at 4°C was found to be stable for about 9 days). In contrast to this result, a solution in pH 7.4, 0.067 M phosphate buffer that containing about the same concentration of 3-acetylindole (one of the probe candidates in Figure 1) showed no significant changes in its UV/Vis spectrum under any of the tested storage conditions, as illustrated in Figure 3(b). Similar stability to 3-acetylindole was noted for all of the other probe candidates (data not shown). The stability of each probe candidate was also tested by using 1H NMR spectroscopy. This second method indicated that these candidates were stable for at least three weeks in pH 7.4, 0.067 M phosphate buffer when stored either in the dark or in the presence of normal laboratory lighting and at either 4°C or 25°C. Thus, all of these probe candidates appeared to have greater stability than L-tryptophan under such conditions.
Figure 3.
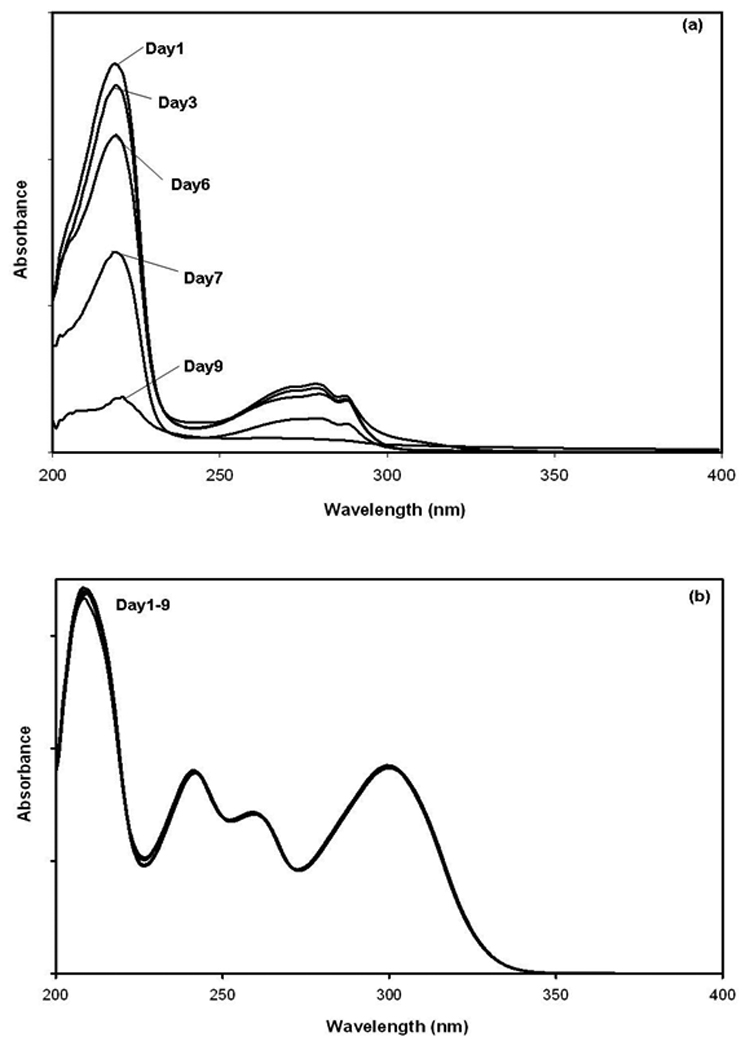
UV/vis spectra for solutions of (a) L-tryptophan and (b) 3-acetylindole in pH 7.4, 0.067 M phosphate buffer and stored at 25°C in the presence of normal laboratory lighting.
The effect of this change in L-tryptophan solutions during drug-binding studies was next considered. This was examined by looking at how the apparent retention for L-tryptophan on an HSA column changed over time after the L-tryptophan sample had been stored for various lengths of time in pH 7.4, 0.067 M phosphate buffer at 4°C in the dark. Injections of 3-acetylindole were also made as a stable control to monitor the overall activity of the HAS column (note: 3-acetylindole was used in this case because it was later found in this study to be one of more promising alternative probes for Sudlow site II). A 20 µM sample of each compound was injected over the course of two weeks onto the same HSA column. The results are shown in Figure 4. It was found that the apparent peak observed for L-tryptophan shifted by 10–11% to longer retention times and larger retention factors over the two week period. However, only a 4% change was noted for injections of 3-acetylindole, which was later shown to have the same binding site as L-tryptophan on HSA. These results indicated that changes in the stability of an L-tryptophan solution could produce noticeable effects during the use of this compound as a probe for HSA.
Figure 4.
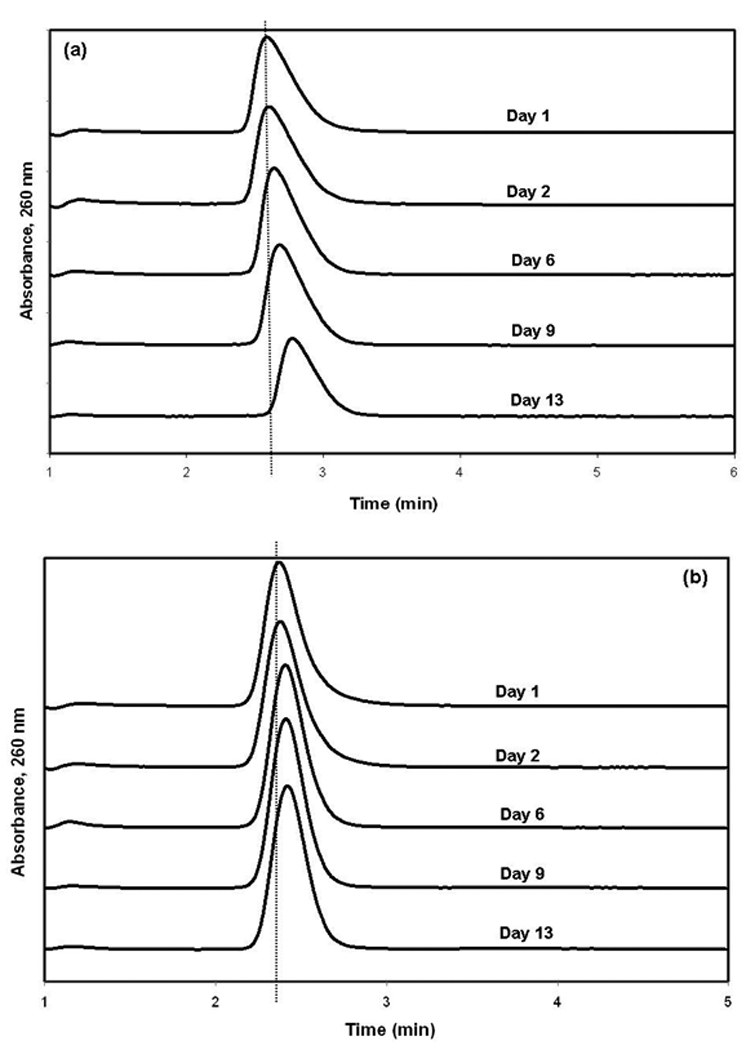
Shift in observed retention for repeated injections of a sample of (a) L-tryptophan or (b) 3-acetylindole onto an HSA column after these samples had been stored for various lengths of time at 4°C in the dark. The dashed vertical lines are shown for reference and indicate the location for the peak maximum for each injected compound at the beginning of the stability study.
The relatively strong UV absorbance of the various indole probes examined in this work (as demonstrated in Figure 3 for L-tryptophan and 3-acetylindole) should make it convenient to monitor such agents when they are used as site-specific probes in HPAC or ACE. A strong absorbance by the probe is desirable in these methods because it allows only a small amount of the probe to be injected and monitored. The analyte that is being placed into the mobile phase or running buffer during such studies may also have absorbance in the UV range; however, this generally does not create a significant problem in HPAC or ACE if the analyte is present at a consistent level and produces a constant background signal.
3.2 Binding of probe candidates to HSA
All of the probe candidates were evaluated for their binding to HSA by using the method of frontal analysis. This work involved the continuous application of solutions that contained known concentrations of each probe candidate to the HSA column or a control column. As the binding sites in the column became saturated, the amount of analyte that eluted from the column gradually increased, producing a characteristic breakthrough curve, as shown Figure 2(a). The mean position of each breakthrough curve was then determined at each applied concentration of the probe candidate and analyzed according to equations that have been previously derived to describe various binding models [24].
Prior to studying the binding of each probe candidate on the HSA column, the presence of any non-specific binding to the support was also examined by conducting frontal analysis studies with these same compounds on the control column. Figure 5 shows the results obtained at a concentration of 5 µM for each probe candidate. Indole-3-carboxylic acid had essentially no significant binding to the control column, while indole-3-butyric acid and indole-3-methanol had only small retention on this column (e.g., total breakthrough times in Figure 5, including the column and system void time, below 120 s). Probe candidates with larger but still acceptable levels of non-specific binding included indole-3-acetic acid and 3-acetylindole (total breakthrough times below 200 s in Figure 5). The final two candidates, indole-3-proprionic acid and 3-methylindole, produced much broader breakthrough curves and exhibited higher levels of non-specific binding (breakthrough times greater than 200 s in Figure 5). These latter two candidates were considered for possible elimination in later HPAC experiments because of these characteristics; however, non-specific binding by these candidates would be expected to be less important in ACE due to the lower available surface area for adsorption that is often present in this method versus HPAC.
Figure 5.
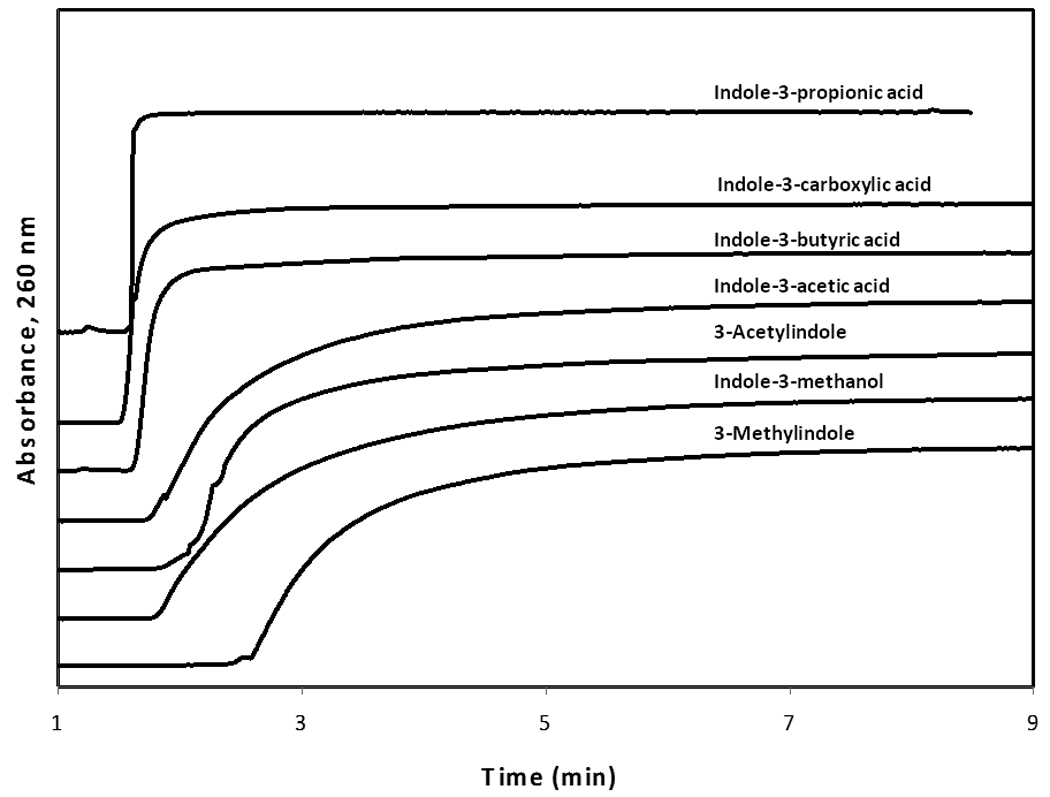
Non-specific binding by each of the probe candidates on the control column at an applied concentration of 5 µM. For the sake of comparison, the response on the y-axis has been normalized for each probe candidate to correct for differences in their molar absorptivities at the detection wavelength and to give them breakthrough curves with equivalent plateau values.
Once the non-specific binding of each analyte to the control column had been measured, these results were used to correct for non-specific binding in the frontal analysis data that were obtained on an HSA column under the same probe concentration conditions. The corrected data were then analyzed to determine the type and strength of binding that was present between each remaining probe candidate and HSA. For example, a probe that has 1:1 binding with HSA (as occurs for L-tryptophan) should give a response that fits the following equation,
| (1) |
in which mLapp is the measured binding capacity of the column at a given applied concentration of the probe candidate [A], mL is the total moles of binding sites in the column for the probe candidate, and KA is the association equilibrium constant for this interaction [22,24]. This equation predicts that a plot of 1/mlapp versus 1/[A] should result in a linear relationship that can be used to provide the values of KA and mL from the slope and intercept. If the plot is not linear, then multi-site interactions are present and alternative equations and models can be used for data analysis to obtain the binding parameters for the system [24,46].
Figure 6 shows an example of a plot that was obtained when Eq. (1) was used to analyze the results for indole-3-acetic acid (r2 = 0.9974, n = 7). The linear response that was obtained indicated that this particular probe candidate had a single major binding site on HSA. Similar fits to a model based on a single major binding site were obtained for indole-3-carboxylic acid (r2 = 0.9998, n = 8) and 3-acetylindole (r2 = 0.9606, n = 9). The indole-3-propionic acid and indole-3-butyric acid gave greater variability in their results but also gave a reasonable fit to a one-site model (r2 = 0.8083 at n = 7 and r2 = 0.7731 at n = 5, respectively); however, this variability plus the strong retention of these candidates on the HSA column lead to their not being examined further in later studies.
Figure 6.
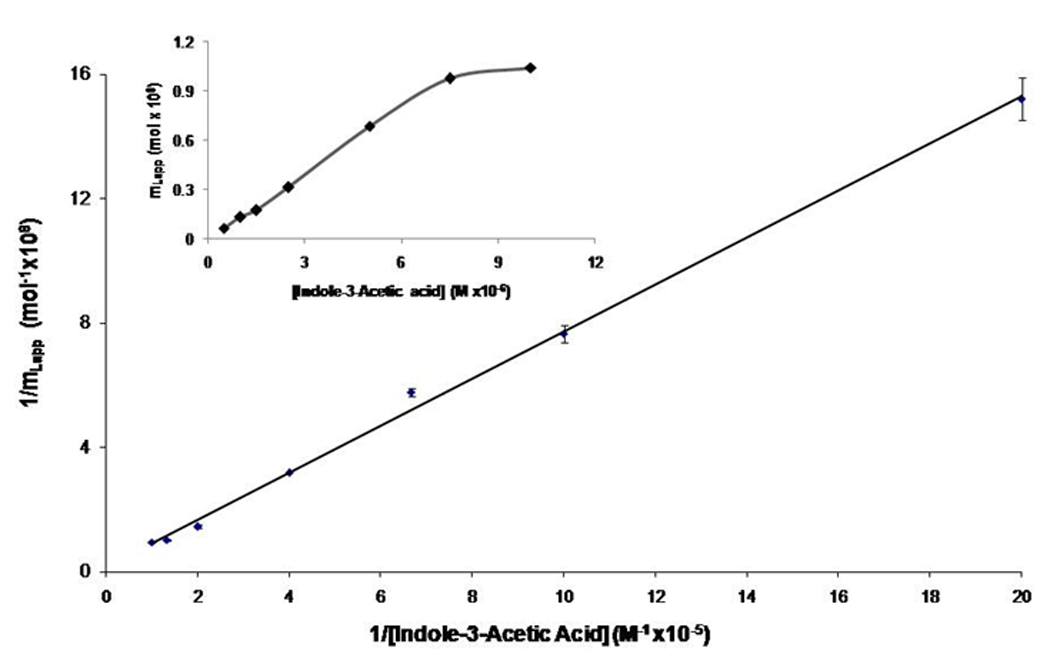
Frontal analysis results for indole-3-acetic acid, as analyzed according to Eq. (1). The best-fit line for this plot was y = 0.76 (± 0.02) x + 0.135 (± 0.002), with r2 = 0.9974 (n = 7). The error bars represent a range of ± 1 S.D. for each point. The inset shows the results obtained when the same frontal analysis data were analyzed according to a non-reciprocal plot.
The values of KA and mL that were obtained from these fits to a model based on one major binding site are summarized in Table 2. Indole-3-acetic acid gave the largest association equilibrium constant for the HSA column in the group of tested probe candidates, with a value that was over 300-fold larger than the KA value of 1.1 × 10⁴ M−1 that has been previously reported for L-tryptophan with HSA [45]. Indole-3-propionic acid gave an association equilibrium constant that was 10-fold larger than that for L-tryptophan and 3-acetylindole had a KA value that was 7-fold larger. Indole-3-carboxylic acid gave a slightly lower association equilibrium constant, with a value that was only 77% of that for L-tryptophan with HSA. These results indicated that the tested probe candidates covered a nice range of both higher and lower association equilibrium constants for high-throughput screening studies of drug binding to HSA. Being able to adjust the affinity of such probe candidates would be useful in helping adjust analyte retention/migration in either HPAC or ACE [45–49].
Table 2.
Association equilibrium constants (KA), total binding capacity (mL) and specific activity for the probe candidate with HSA
| Probe Candidate | Association Equilibrium Constant, KA (M−1) |
Total Binding Capacity, mL (mol) |
Specific Activity (mol/mol HSA) |
|---|---|---|---|
| Indole-3-acetic acida | 3.4 (± 0.08) × 106 | 3.7 (± 0.05) × 10−8 | 0.78 (± 0.03) |
| Indole-3-carboxylic acida | 8.5 (± 0.2) × 103 | 12 (± 0.02) × 10−8 | 2.6 (± 0.1) |
| 3-Acetylindole | 7.8 (± 0.6) × 104 | 0.84 (± 0.01) × 10−8 | 0.18 (± 0.01) |
| Indole-3-propionic acid | 1.1 (± 0.02) × 105 | 4.5 (± 0.01) × 10−8 | 0.94 (± 0.04) |
| 3-Methylindole | 5.3 (± 0.5) × 104 | 2.9 (± 0.9) × 10−8 | 0.62 (± 0.19) |
| Indole-3-butyric acid | 9.7 (± 3.0) × 105 | 2.6 (± 0.2) × 10−8 | 0.55 (± 0.04) |
| Indole-3-methanol | 1.2 (± 0.5) × 105 | 0.12 (±0.05) × 10−8 | 0.03 (± 0.01) |
The results in this table were all obtained using a model based on a single major binding site. However, other data obtained in this report suggests that indole-3-acetic acid and indole-3-carboxylic acid may actually have significant multi-site binding with HSA, as discussed in the text.
A comparison was also made of the total binding capacities and specific activities that were determined for each probe candidate versus the protein content of the HSA column. This comparison was made by using a total protein content for the column of 4.7 (± 0.2) × 10−8 mol HSA, as calculated by using a protein content for the support of 40 mg HSA/g silica along with a molecular weight for HSA of 66.5 kDa and a packing density for the support of 0.45 g/cm3. The resulting specific activity for each compound (given in units of mol analyte/mol HSA) that was calculated from this information is given in Table 2. Most of probe candidates gave specific activities that were less than or equal to one, as would be expected for a drug or solute with a single major binding site on HSA (note: values less than one can be obtained in HPAC if not all of the binding sites are active; when using soluble HSA in ACE, a value near unity would be expected for a 1:1 interaction) [45,46]. The only exception was indole-3-carboxylic acid, for which a specific activity between 2 and 3 was obtained. This result for indole-3-carboxylic acid indicated that multi-site interactions were present in this case, as was confirmed by the presence of some curvature at high concentrations for plots that were prepared according to Eq. (1). This property would tend to make indole-3-carboxylic acid unsuitable as a site-specific probe in the use of either ACE for high-throughput screening of drug binding to HSA.
3.3 Competition of probe candidates with L-tryptophan
After each probe candidate had been evaluated for its overall binding to HSA, its binding to Sudlow site II was specifically examined by looking at the competition of the probe candidate with L-tryptophan. These competition studies were carried out on the HSA column by using zonal elution experiments. In these experiments a small injection of the probe candidate (A) was made in the presence of mobile phases that contained various known concentrations of L-tryptophan (competing agent, I) while the retention of the injected analyte was monitored. The following relationship can be used to describe the retention that will be observed for a system in which A and I have direct competition at a single binding site (e.g., Sudlow site II, when using L-tryptophan as the competing agent) [24].
| (2) |
In this equation, k is the observed retention factor for the analyte, VM is the column void volume, mL represents the moles of common binding sites, KI is the association equilibrium constant for the competing agent at the site of competition and KA is the association equilibrium constant for the analyte at this same site. According to Eq. (2), a plot of 1/k versus [I] should give a linear relationship if A and I have direct competition at a single site and A has no other interactions with the column. An example of such a plot is shown in Figure 7. If a non-linear relationship is observed, then the analyte has multiple binding sites on the column and/or multiple sites of interaction with the competing agent [24].
Figure 7.
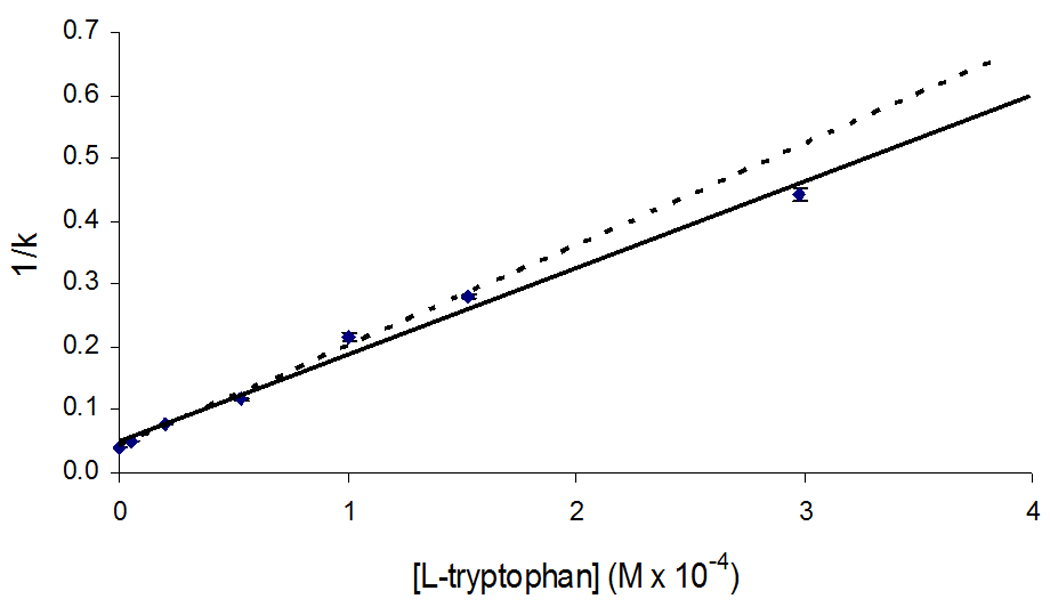
Results of competition studies for injections of 3-acetylindole in the presence of various concentrations of L-tryptophan. The error bars represent a range of ± 1 S.D. for each point. These results were analyzed according to Eq. (2), giving a best fit line over the lower six points in this plot (see dashed line) of y = 1370 (± 70) x + 0.052 (± 0.009), with r2 = 0.9872. A slightly lower slope but comparable intercept was obtained when using the entire set of points in this plot (see solid line).
Of the various remaining probe candidates that were examined, only 3-acetylindole gave a reasonably linear relationship when the results of its competition study were examined by using Eq. (2) (see Figure 7). This result indicated that 3-acetylindole was competing directly with L-tryptophan at Sudlow site II. As expected from the previous frontal analysis experiments, indole-3-carboxylic acid gave a non-linear graph when its data were examined according to Eq. (2), as caused by the presence of multi-site interactions of this compound with HSA. Some nonlinear behavior was also noted for indole-3-acetic acid, which is believed to be due to the presence of weak interactions with HSA that were not detected under the conditions used in the frontal analysis experiments. The presence of a much smaller amount of curvature from such interactions may also have been present for 3-acetylindole, as indicated in Figure 7.
4 Conclusions
Various indole-related compounds were examined as alternatives to L-tryptophan for use as site-selective probes in drug-protein binding studies involving HSA. All of the tested probe candidates had greater stability than L-tryptophan in aqueous solution but many of these suffered from other limitations when used in binding studies. For example, indole-3-propionic acid and 3-methylindole had a relatively large amount of non-specific binding to the support, which could limit their usefulness in HPAC but probably not ACE. Indole-3-carboxylic acid had significant multi-site interactions with HSA, which would make it unsuitable as a site-selective probe for either HPAC or ACE studies. The only candidate in the group of tested compounds that gave reasonably strong binding to HSA, acceptable levels of non-specific binding, and good competition with L-tryptophan was 3-acetylindole. This compound had a comparable affinity to L-tryptophan for HSA and yet was much more stable in an aqueous solution. These properties should make 3-acetylindole useful as a possible alternative to L-tryptophan for future work in the high-throughput screening of drug interactions with the Sudlow site II of HSA by either HPAC or ACE.
Acknowledgments
This research was supported by National Institutes of Health under grant R01 GM044931 and was conducted in facilities renovated under NIH grant RR015468.
Abbreviations
- ACE
Affinity capillary electrophoresis
- HPAC
high-performance affinity chromatography
- HSA
human serum albumin
- NMR
nuclear magnetic resonance
References
- 1.Carter DC, Ho JX. Adv. Prot. Chem. 1994;45:153–203. doi: 10.1016/s0065-3233(08)60640-3. [DOI] [PubMed] [Google Scholar]
- 2.Hardman JG, Limbird LE, Molinoff PB, Ruddon RW, Gilman AG, editors. Goodman and Gilman’s The Pharmacological Basis of Therapeutics. 9th Ed. New York: McGraw Hill; 1996. [Google Scholar]
- 3.Sengupta A, Hage DS. Anal. Chem. 1999;71:3821–3827. doi: 10.1021/ac9903499. [DOI] [PubMed] [Google Scholar]
- 4.He XM, Carter DC. Nature. 1992;358:209–215. doi: 10.1038/358209a0. [DOI] [PubMed] [Google Scholar]
- 5.Charney DS, Heniger GR, Sternberg DE. Arch. Gen. Psych. 1984;41:359–365. doi: 10.1001/archpsyc.1984.01790150049008. [DOI] [PubMed] [Google Scholar]
- 6.Sulow G, Birkett DJ, Wade DN. Mol Pharmacol. 1976;12:1045–1051. [PubMed] [Google Scholar]
- 7.Fehske K, Schlafer U, Wollert U, Muller WE. Mol Pharmacol. 1982;21:387–393. [PubMed] [Google Scholar]
- 8.Peters TJ. All About Albumin: Biochemistry, Genetics and Medical Applications. San Diego: Academic Press; 1996. [Google Scholar]
- 9.Lee MG, Rogers CM. J. Parenteral Sci. Technol. 1988;42:20–22. [PubMed] [Google Scholar]
- 10.Savige WE. Aust. J. Chem. 1971;24:1285–1293. [Google Scholar]
- 11.Savige WE. Aust. J. Chem. 1975;28:2275–2287. [Google Scholar]
- 12.Matsuzaki T. AIP Conf. Proc. 2004;716:54–57. [Google Scholar]
- 13.Zou J, Taylor P, Dornan J, Robinson SP, Walkinshaw MD, Sadler PJ. Angew. Chem. Int. Edit. 2000;39:2931–2933. doi: 10.1002/1521-3773(20000818)39:16<2931::aid-anie2931>3.0.co;2-w. [DOI] [PubMed] [Google Scholar]
- 14.Xie M, Long M, Liu Y, Qin C, Wang Y. Biochim. Biophys. Acta. 2006;1760:1184–1191. doi: 10.1016/j.bbagen.2006.03.026. [DOI] [PubMed] [Google Scholar]
- 15.Heinze A, Holzgrabe U. Int. J. Pharm. Sci. 1981;70:146. [Google Scholar]
- 16.Zhirkov YA, Piotrovskii VK. J. Pharm. Pharmacol. 1984;36:844–845. doi: 10.1111/j.2042-7158.1984.tb04891.x. [DOI] [PubMed] [Google Scholar]
- 17.Whilam JB, Brown KF. J. Pharm. Sci. 1981;70:146–150. doi: 10.1002/jps.2600700208. [DOI] [PubMed] [Google Scholar]
- 18.Shiwang L, Zhang L, Zhang X. Anal. Sci. 2006;22:1515–1518. doi: 10.2116/analsci.22.1515. [DOI] [PubMed] [Google Scholar]
- 19.Zhongjiang J. Current Pharm. Anal. 2005;1:41–56. [Google Scholar]
- 20.Day YSN, Myszka DG. J. Pharm. Sci. 2003;92:333–338. doi: 10.1002/jps.10293. [DOI] [PubMed] [Google Scholar]
- 21.Sulkoxska A, Bojko B, Rownicka J, Rezner P, Sulkoxski WW. J. Mol. Struct. 2005;744:775–779. [Google Scholar]
- 22.Kim HS, Hage DS. J. Chromatogr. B. 2005;816:57–66. doi: 10.1016/j.jchromb.2004.11.006. [DOI] [PubMed] [Google Scholar]
- 23.Schiel JE, Mallik R, Soman S, Joseph KS, Hage DS. J. Sep. Sci. 2006;29:719–728. doi: 10.1002/jssc.200500501. [DOI] [PubMed] [Google Scholar]
- 24.Hage DS. J. Chromatogr. B. 2002;768:3–30. doi: 10.1016/s0378-4347(01)00482-0. [DOI] [PubMed] [Google Scholar]
- 25.Hage DS, Austin J. J. Chromatogr. B. 2000;739:39–54. doi: 10.1016/s0378-4347(99)00445-4. [DOI] [PubMed] [Google Scholar]
- 26.Hage DS, Sengupta A. J. Chromatogr. B. 1999;724:91–100. doi: 10.1016/s0378-4347(98)00589-1. [DOI] [PubMed] [Google Scholar]
- 27.Chattopadyay A, Tian T, Kortum L, Hage DS. J. Chromatogr. B. 1998;715:183–190. doi: 10.1016/s0378-4347(98)00140-6. [DOI] [PubMed] [Google Scholar]
- 28.Hage DS, Noctor TAG, Wainer IW. J. Chromatogr. A. 1995;693:23–32. doi: 10.1016/0021-9673(94)01009-4. [DOI] [PubMed] [Google Scholar]
- 29.Xuan H, Hage DS. Anal. Biochem. 2005;346:300–310. doi: 10.1016/j.ab.2005.08.025. [DOI] [PubMed] [Google Scholar]
- 30.Domenici E, Bertucci C, Salvadori P, Felix G, Cahagne I, Motellier S, Wainer IW. Chromatographia. 1990;29:170–176. [Google Scholar]
- 32.Loun B, Hage DS. J. Chromatogr. 1992;579:225–235. [PubMed] [Google Scholar]
- 33.Noctor TAG, Pham CD, Kaliszan R, Wainer IW. Mol. Pharmacol. 1992;42:506–511. [PubMed] [Google Scholar]
- 34.Noctor TAG, Wainer IW. J. Chromatogr. 1992;577:305–315. doi: 10.1016/0378-4347(92)80252-l. [DOI] [PubMed] [Google Scholar]
- 35.Russeva VN, Zhivkova ZD. Int. J. Pharmaceut. 1998;168:23–29. [Google Scholar]
- 36.Loun B, Hage DS. Anal. Chem. 1994;66:3814–3822. doi: 10.1021/ac00093a043. [DOI] [PubMed] [Google Scholar]
- 37.Hage DS. J. Chromatogr. B. 1998;715:3–28. doi: 10.1016/s0378-4347(97)00621-x. [DOI] [PubMed] [Google Scholar]
- 38.Heegaard NHH, Schou C. Chap. 26. In: Hage DS, editor. Handbook of Affinity Chromatography. 2nd Ed. New York: Taylor & Francis; 2006. [Google Scholar]
- 39.Liu X, Chen X, Yue Y, Zhang J, Song Y. Electrophoresis. 2008;29:2876–2883. doi: 10.1002/elps.200700748. [DOI] [PubMed] [Google Scholar]
- 40.Erim FB, Kraak JC. J. Chromatogr. B. 1998;710:205–210. doi: 10.1016/s0378-4347(98)00127-3. [DOI] [PubMed] [Google Scholar]
- 41.Busch MHA, Carels LB, Boelens HFM, Kraak JC, Poppe H. J. Chromatogr. A. 1997;777:311–328. doi: 10.1016/s0021-9673(97)00369-5. [DOI] [PubMed] [Google Scholar]
- 42.Heeseung K, Austin J, Hage DS. Electrophoresis. 2002;23:956–963. doi: 10.1002/1522-2683(200203)23:6<956::AID-ELPS956>3.0.CO;2-7. [DOI] [PubMed] [Google Scholar]
- 43.Ruhn PF, Garver S, Hage DS. J. Chromatogr. A. 1994;669:9–19. doi: 10.1016/0021-9673(94)80332-3. [DOI] [PubMed] [Google Scholar]
- 44.Chattopadhyay A, Hage DS. J. Chromatogr. 1997;758:255–261. doi: 10.1016/s0021-9673(96)00742-x. [DOI] [PubMed] [Google Scholar]
- 45.Yang J, Hage DS. J. Chromatogr. 1993;645:241–250. doi: 10.1016/0021-9673(93)83383-4. [DOI] [PubMed] [Google Scholar]
- 46.Hage DS, Chen J. Chap. 22. In: Hage DS, editor. Handbook of Affinity Chromatography. New York: Taylor & Francis; 2006. [Google Scholar]
- 47.Ahmed A, Ibrahim H, Pastore F, Lloyd DK. Anal. Chem. 1996;68:3270–3273. [Google Scholar]
- 48.Hage DS. Electrophoresis. 1997;18:2311–2321. doi: 10.1002/elps.1150181222. [DOI] [PubMed] [Google Scholar]
- 49.Bose S, Yang J, Hage DS. J. Chromatogr. B. 1997;697:77–88. doi: 10.1016/s0378-4347(97)00014-5. [DOI] [PubMed] [Google Scholar]


