

Abstract
In the preceding paper, we reported that flexor digitorum brevis (FDB) muscle fibres from S100A1 knock-out (KO) mice exhibit a selective suppression of the delayed, steeply voltage-dependent component of intra-membrane charge movement current termed Qγ. Here, we use 50 μm of the Ca2+ indicator fluo-4 in the whole cell patch clamp pipette, in addition to 20 mm EGTA and other constituents included for the charge movement studies, and calculate the SR Ca2+ release flux from the fluo-4 signals during voltage clamp depolarizations. Ca2+ release flux is decreased in amplitude by the same fraction at all voltages in fibres from S100A1 KO mice compared to fibres from wild-type (WT) littermates, but unchanged in time course at each pulse membrane potential. There is a strong correlation between the time course and magnitude of release flux and the development of Qγ. The decreased Ca2+ release in KO fibres is likely to account for the suppression of Qγ in these fibres. Consistent with this interpretation, 4-chloro-m-cresol (4–CMC; 100 μm) increases the rate of Ca2+ release and restores Qγ at intermediate depolarizations in fibres from KO mice, but does not increase Ca2+ release or restore Qγ at large depolarizations. Our findings are consistent with similar activation kinetics for SR Ca2+ channels in both WT and KO fibres, but decreased Ca2+ release in the KO fibres possibly due to shorter SR channel open times. The decreased Ca2+ release at each voltage is insufficient to activate Qγ in fibres lacking S100A1.
In the preceding paper (Prosser et al. 2009) we examined the properties of intra-membrane charge movement currents in muscle fibres from S100A1 knock-out (KO) mice and from their wild-type (WT) littermates. We found that fibres from S100A1 KO mice exhibit a selective suppression of the delayed, steeply voltage dependent component of intra-membrane charge movement termed Qγ. In previous studies on frog skeletal muscle fibres it has been noted that there is a close temporal relationship between the Qγ component of charge movement and the onset of Ca2+ release from the SR, with Qγ being considered to be either a cause (Reviewed in Huang, 1988) or a consequence (Csernoch et al. 1991; García et al. 1991; Pizarro et al. 1991; Gonzalez & Rios, 1993) of Ca2+ release. We therefore next sought to examine the relationship between Ca2+ transients and charge movement under the conditions of our studies by including 50 μm of the Ca2+ indicator fluo-4 in the whole cell patch clamp pipette.
Here we use fluo-4 fluorescence transients, monitored with ultra-high speed confocal imaging, to calculate Ca2+ release during voltage clamp depolarizations in mouse flexor digitorum brevis (FDB) skeletal muscle fibres, while simultaneously monitoring charge movement currents. We find that Ca2+ release is decreased in amplitude by the same factor at all voltages, but unchanged in time course at any voltage in fibres from S100A1 KO mice compared to fibres from WT littermates, and that the decreased Ca2+ release is likely to account for the suppression of Qγ in the KO fibres. Additionally, pharmacologically enhancing release in KO fibres with the RyR1 agonist 4-chloro-m-cresol at least partially rescues Qγ, further supporting the correlation between Ca2+ release and the Qγ component of intra-membrane charge movement.
Methods
Ethical approval
All animals were housed in a pathogen-free area at the University of Maryland, Baltimore. The animals were killed according to authorized procedures of the Institutional Animal Care and Use Committee, University of Maryland, Baltimore, by regulated delivery of compressed CO2 overdose followed by decapitation.
FDB fibre preparation
Fibres were prepared using enzymatic dissociation of FDB muscles of 6- to 7-week-old C57 × 129 WT and S100A1 KO mice, and were cultured as previously described (Liu et al. 1997). S100A1−/− animals and WT littermate control animals were obtained from Dr Danna Zimmer, Texas A&M University. The generation and genotyping of these animals has been previously reported (Prosser et al. 2007).
Solutions
Except where otherwise specifically indicated, all solutions were identical to those used in the previous paper (Prosser et al. 2009), with the addition of 50 μm Fluo-4 to the internal solution in the patch pipette for monitoring Ca2+ transients in all studies in this paper.
Electrophysiology and data analysis
Membrane current measurements and quantification of intra-membrane charge movement were performed identically as described in the companion paper.
Ca2+ transient fluorescence recordings
Fluorescence signals were recorded during voltage clamp depolarizations using a high speed confocal system (Zeiss LSM 5 LIVE) synchronized with the patch clamp system. Fibre culture chambers were mounted on a Zeiss Axiovert 200M inverted microscope and confocal imaging was performed in linescan x–t mode as previously described (Prosser et al. 2007), with images acquired at 50 μs/line for 1 s acquisition. A region of interest was taken from the centre of the fibre and the change in fluorescence (ΔF) upon depolarization was averaged from this region after subtraction of background fluorescence from a region outside of the fibre. Images were analysed and processed using OriginPro 8.0 (OriginLab Corp., Northampton, MA, USA).
Calculation of Ca2+ release flux
Time course of free Ca2+ concentration
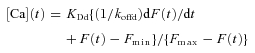
Following the analysis previously used for calculating the time course of free Ca2+ concentration from fura-2 fluorescence signals under conditions when the dye is not at equilibrium with the myoplasmic free Ca2+ (Klein et al. 1988), the time course of free Ca2+ concentration ([Ca](t)), is given by (Klein et al. 1988, eqn (5), with rearrangements):
 |
(1) |
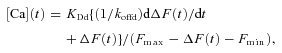
where KDd is the dissociation constant for Ca2+ from the indicator dye (here fluo-4), koffd is the off rate const for Ca2+ dissociation from the dye, F is the fibre fluo-4 fluorescence signal and Fmax and Fmin are the fluorescence at saturating and zero free Ca2+, respectively. Due to the presence of 20 mm EGTA in the pipette solution with no added Ca2+ we assume that the resting fibre fluorescence F0=Fmin. In this case F=Fmin+ΔF and:
 |
(2) |
which is the equation used here for calculating [Ca](t). This derivative term in eqn (2) introduces significant noise into the calculation of [Ca](t). Therefore, for smaller depolarizing pulses that produced negligible or slowly changing fluorescence transients, we routinely set the derivative term to zero for calculating [Ca](t) to improve signal to noise. Such cases can be identified in Figs 3, 4, 5 and 8 by the reduced noise level in the records of [Ca](t) and calculated Ca2+ release for the smaller pulses (see below).
Figure 3. Calculation of voltage-dependent Ca2+ release flux from fluo-4 ΔF transients.

A, experimentally measured fluo-4 ΔF records from Fig. 1B, now expanded in time, with pulse protocol above and time scale at bottom of C. B, free Ca2+ waveforms derived from A and calculated using eqn (2) (see Methods). C, Ca2+ release flux derived from B, calculated using eqn (4) with 20 mm EGTA in the internal solution. EGTA is the major intracellular binding site for released Ca2+, and therefore the rate of Ca2+ binding to EGTA can be used as a first approximation of the rate of Ca2+ release. In B and C, for pulses to −40 and −30 mV, the derivative term from eqn (2) (see Methods) has been set to zero to improve signal to noise.
Figure 4. Peak rate of Ca2+ release is decreased at all voltages in S100A1 KO fibres.

A, average records of Ca2+ release flux from WT fibres (n= 9). B, average records of flux from KO fibres (n= 8), plotted on same scale as A to appreciate differences in release amplitude. C, peak release (R) plotted vs. voltage. Continuous lines through the symbols are best fits to a single Boltzmann function (eqn (5)) with parameters of 57 μm ms−1 for Rmax, 8.3 mV for k and −9.5 mV for Vhalf for average WT data, with corresponding values of 32 μm ms−1, 8.4 mV and −10.9 mV for the average KO fibres. The continuous red trace represents the fit to the KO average scaled up to the WT maximum to show virtually identical voltage dependence between WT and KO fibres. D, WT and KO R plotted vs. WT and KO charge movement from companion paper (Prosser et al. 2009). Traces are normalized to WT maximum R and Q to appreciate proportional differences.
Figure 5. WT (blue trace) and KO (red trace) fibres demonstrate virtually identical relative time courses of Ca2+ release.

Average Ca2+ release time courses from designated voltage steps in WT and KO fibres. Inset in bottom two panels shows zoom in of the rising phase of the rate of Ca2+ release peak, demonstrating virtually identical time course of release.
Figure 8. Potentiation of Ca2+ release in KO fibres by 4–CMC.

A, average Ca2+ release records of KO fibres (n= 6) before (red traces) and after addition of 100 μm 4–CMC (purple traces). There was a large potentiation of release at intermediate depolarizations that diminished with increasing depolarization. B, R vs. V plot of KO fibres before (red symbols) and after application of 4–CMC (purple symbols) demonstrates a leftward shift in the voltage dependence of release imparted by 4–CMC. C, normalized R vs. V comparing the differences in Ca2+ release isolated from 4–CMC application to KO fibres (KO+4–CMC – KO; dark grey line) with the difference in release between WT and KO fibres (WT – KO; green line). The release augmented by 4–CMC demonstrates a leftward shift, a peak, and then diminishes with increasing depolarization, while the difference between WT and KO fibres is sustained at maximal depolarizations and exhibits a similar voltage dependence to both the WT or KO release curves (dashed line).
Time course of the rate of change of [Ca-EGTA]
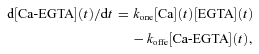
Under the conditions of 20 mm EGTA with no added Ca2+ in the pipette, EGTA is the major binding site for released Ca2+. In that case d[Ca-EGTA](t)/dt provides a good approximation to the rate of SR Ca2+ release in the fibre, and will be used in the Ca2+ release calculations presented here. For Ca binding to EGTA,
 |
(3) |
where kone and koffe are on and off rate constants for Ca2+ binding to EGTA.
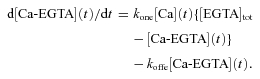
Since [EGTA](t) =[EGTA]tot–[Ca-EGTA](t),
 |
(4) |
Equation (4) was solved numerically using [Ca](t) from eqn (2) and using the Euler method to calculate the time course of d[Ca-EGTA](t)/dt, which was used as the time course of the rate of Ca2+ release from the SR during the voltage clamp pulses. [EGTA] at the start of each pulse was assumed to be equal to the total [EGTA] in the pipette solution and [Ca-EGTA] was correspondingly assumed to be 0 at the start of each pulse.
The parameter values used in our calculations were KDd= 1000 nm (Harkins et al. 1993), which we confirmed in situ using a Ca2+ calibration kit (Molecular Probes), koffd= 90 s−1 (Shirokova et al. 1996), kone= 15 (μm s)−1 and koffe= 7.5 s−1 (Royer et al. 2008).
Extracellular application of 4–CMC
4-Chloro-m-cresol (4-CMC; Aldrich, Milwaukee, WI, USA) was diluted in DMSO and added directly to the external solution, which was then gently pipetted to promote uniform dilution in the bath volume.
Statistical analysis
All statistical analysis was performed using OriginPro 8.0. All data are presented as mean values ± standard error of the mean (s.e.m.) unless otherwise noted. Normality of data sets was ensured for each statistical calculation. Significance was determined using Student's t-test and set at P < 0.05.
Results
Fluo-4 fluorescence transients elicited by voltage clamp pulses
Figure 1 illustrates the basic protocol used to monitor Ca2+ transients in these studies. An FDB fibre from a WT mouse was voltage clamped at a holding potential of −80 mV with 50 μm of fluo-4 in the patch pipette. Starting 20 min after seal formation, a series of voltage clamp depolarizations of increasing amplitude (Fig. 1A, top) were applied to the fibre at 30 s intervals. The high speed (50 μs per line) confocal line scan images (Fig. 1A) synchronized with each of the pulses show a non-detectable fluorescence signal for the pulse to −40 mV, but increasing fluorescence signals for the increasingly larger depolarizations. Thus, despite the presence of 20 mm EGTA in the patch pipette solution together with the 50 μm fluo-4, we were still able to record clearly detectable voltage-dependent fluo-4 signals in response to depolarization of the voltage clamped fibres. Note that due to the presence of 20 mm EGTA in the pipette solution and its diffusion into the fibre there is no detectable sign of fibre movement in the confocal line scan images. Figure 1B shows the time course of fluorescence change (ΔF) in the region of interest in the middle part of the fibre (shown in white in Fig. 1A, bottom) for each of the pulses. Consistent with the image display (Fig. 1A), the extracted ΔF records showed no detectable change at −40 mV, and then increased in amplitude as well as in rate of rise, and decreased in latency as the pulse was increased from −30 to +20 mV (Fig. 1B). There is no sign of fibre movement in the fluorescence change signals in Fig. 1B, or in any other record obtained in this study.
Figure 1. Fluo-4 Ca2+ transients elicited by step depolarizations in a control voltage-clamped FDB fibre.

A, high speed (50 μs per line) confocal line scan x–t images synchronized with pulse protocol drawn above. Time scale is same as in B. The white box in the bottom panel (pulse to +20 mV) represents the region of interest drawn in the centre of the fibre that was averaged to calculate the change in fluorescence intensity. B, time course of change in fluo-4 fluorescence (ΔF) recorded from pulses above. A change in fluo-4 fluorescence was typically first detected at pulses to −30 mV, and saturated with pulses around +20 mV.
Basis for resting fibre fluo-4 fluorescence, and estimation of fluo-4 Fmin
Fluorescence signals from Ca2+ indicator dyes depend on the concentrations of both Ca2+ and dye, as well as other divalent cations that may interact with the dye. Since fluo-4 is not a ratiometric Ca2+ indicator dye, the effects of Ca2+ and dye concentrations cannot be separated by using ratiometric recording. However, since 20 mm EGTA was present in the patch pipette together with 50 μm fluo-4, we expected that fluo-4 would be essentially fully Ca2+ free in the resting fibre. In that case the fibre resting fluorescence would be expected to provide a direct measure of Fmin, the fluo-4 fluorescence in the fibre at zero [Ca2+].
We next examined fibre resting fluorescence and how it changed over time, with and without application of repeated depolarizing pulses over a time interval corresponding to our standard experimental recording period. As shown diagrammatically at the bottom of Fig. 2A, starting exactly 20 min after the time of establishing the whole cell recording configuration, fibres were first subjected to a series of four depolarizing steps to +10 mV applied at 30 s intervals, then to four steps to −60 mV at 30 s intervals and then again to four steps to +10 mV at 30 s intervals (all pulses 80 ms in duration). In three fibres bathed in our standard external solution (containing 0.5 mm Cd2+ and 0.5 mm Co2+) and studied with this pulse protocol, the fibre resting fluorescence prior to each pulse increased steadily over the course of the experiment (Fig. 2A, filled circles), both during the two sets of pulses to +10 mV (22 and 24% increase per min, respectively) and during the set of pulses to −60 mV (16% per min). As there was a significant time-dependent increase in resting fluorescence in our standard external solution even with sub-threshold stimulation that did not produce detectable fluo-4 ΔF Ca2+ transients (Fig. 2A, middle filled circles), the increase in resting fluorescence with time during the periods of supra-threshold stimulation that did cause Ca2+ release was likely to be due to accumulation in the cytoplasm of previously released Ca2+, as well as an additional time-dependent elevation in fluorescence independent of Ca2+ accumulation.
Figure 2. Evaluation of resting fluorescence, evoked fluorescence transients, and charge movement currents during repetitive pulses in fibres exposed to an external solution with or without Cd2+ and Co2+.

A, F0 and ΔF plotted against time of dialysis with 50 μm fluo-4 in the patch pipette. The first four points represent pulses from −80 mV to +10 mV, the second four represent pulses to −60 mV, and the last four repeat pulses to +10 mV. As can be seen the resting fluorescence (F0) steadily increases with time, even with pulses to −60 mV where there is no detectable release, in the presence (F0-Cd2+, Co2+; filled circles), but not in the absence of Cd2+ and Co2+ (F0-Mg2+; open circles). The initial F0 value in both solutions was normalized to the initial value in the Cd2+/Co2+ containing solution to appreciate differences in F0 at the start of the experimental protocol. B, charge movement records from pulses in A show that charge movement currents are preserved with repeated pulsing and time in solution. C, ΔF records from pulses in A (ΔF-Cd2+, Co2+; filled squares) show stability of ΔF recordings, despite elevation in F0, with repetitive pulsing. Some slight rundown with time is evident after 25 min.
In contrast, when Cd2+ and Co2+ were eliminated from the bathing medium, the resting fluorescence only increased due to Ca2+ accumulation. The time-dependent increase in resting fibre fluorescence (Fig. 2A, open circles) was essentially eliminated during the subthreshold pulses to −60 mV (1% per min), when there was no detectable Ca2+ release. When there was significant Ca2+ release (Fig. 2A, open circles left and right), fluorescence increased, but at a reduced rate (12 and 18% per min, respectively) compared to fibres bathed in the Cd2+ and Co2+ containing solution. Thus, independent of changes in free Ca2+ concentration, the presence of Cd2+ and Co2+ seems to promote a time-dependent increase in fibre fluorescence, as has been previously documented in other cell types (Hinkle et al. 1992; Shibuya and Douglas, 1992; Schaefer et al. 1994). Consistent with this idea, 20 min after the whole cell clamp condition was established, the mean fibre fluorescence was 1.78 ± 0.09 times higher (P < 0.05) in fibres in the Cd2+ and Co2+ solution than in fibres in the Cd2+ and Co2+-free external solution containing 2 mm Mg2+ (Fig. 2A, left most filled and open circles, respectively). Since there were no pulses applied during the 20 min equilibration period, we conclude that the presence of Cd2+ and Co2+ in the bathing solution artifactually raises the fibre fluo-4 fluorescence, possibly due to Cd2+ and/or Co2+ binding to fluo-4 in the fibre. A similar time-dependent increase in fibre resting fluorescence occurs in intact FDB fibres pre-loaded with fluo-4AM and subsequently exposed to Cd2+ or Co2+ in the bathing solution (Prosser et al. unpublished observation). Since the ratio of fluorescence of fibres in the two solutions in Fig. 2 was highly reproducible at 20 min after the whole cell configuration was established (Fig. 2A), we scaled the starting fluorescence recorded at 20 min in each fibre in the Cd2+ and Co2+ solution by the factor 0.56 (= 1/1.78), and used this as Fmin for all calculations of Ca2+ concentration or of Ca2+ release for that fibre.
The increase in fibre resting fluorescence observed during the course of the experiment (Fig. 2A, filled circles) might be assumed to indicate an increase in fluo-4 concentration in the fibre with time. In this case, if Ca2+ release were constant we would then expect that there should be a parallel increase in the fluorescence signal for a given pulse. However, this was not the case. Figure 2A (filled squares) and Fig. 2C, left and right traces, show that the fluo-4 ΔF transients did not increase with time during the experiment, but were similar from pulse to pulse when the same 80 ms pulse to +10 mV was repeatedly applied 4 times at 30 s intervals either early or late during the experiment. A slight decline of ΔF, presumably due to fibre run-down, was seen during the second set of pulses to +10 mV (Fig. 2A filled squares, right, and Fig. 2C, right traces). The simultaneously recorded charge movement currents for the two groups of repeated pulses to +10 mV were also highly reproducible (Fig. 2B). Thus both Ca2+ transients and charge movement were stable in voltage clamped fibres during repeated application of the same pulse using our standard bathing and pipette solutions (plus 50 μm fluo-4 in the pipette). The constancy of the ΔF transients for repeated pulses suggests that despite the possible partial occupancy of the dye by Cd2+ and/or Co2+, the diffusion of free dye from the pipette is sufficient to maintain a relatively constant level of free dye in the fibre.
Ca2+ transients and Ca2+ release flux in wild-type fibres
Figure 3A presents the fluo-4 ΔF records for the family of pulses in Fig. 1 now replotted on an expanded time scale. Figure 3B presents the corresponding Ca2+ transients calculated from the fluorescence signals in Fig. 3A by eqn (2), and Fig. 3C presents the rate of release of Ca2+ from the SR as calculated from the Ca2+ records using eqn ((4). Under the present conditions of high EGTA buffering, the Ca2+ release time course was quite similar to that of the free Ca2+. As previously described for both frog (Melzer et al. 1984) and rodent (Delbono & Stefani, 1993; Royer et al. 2008) muscle, the Ca2+ release waveform for the larger depolarizing pulses exhibited a pronounced early peak followed by a subsequent rapid and then a slower decline with time, likely to be reflecting partial inactivation of the RyR Ca2+ release channel and decline of SR Ca2+ content, respectively (Schneider & Simon, 1988; Simon et al. 1991). For smaller pulses the relative decline in Ca2+ release during the pulse was much less than for the larger pulses, consistent with less cumulative inactivation of RyR Ca2+ release channels at the lower level of RyR channel activation during smaller depolarizations (Klein et al. 1997).
S100A1 KO muscle fibres have suppressed Ca2+ release amplitude, but exhibit Ca2+ release kinetics highly similar to that of WT fibres
Figure 4A presents the average of the Ca2+ release records obtained from nine WT fibres for 80 ms pulses to −40 through +20 mV in 10 mV steps, and Fig. 4B presents the comparable set of average release records for pulses to the same voltages in eight KO fibres. The release at each voltage is smaller in the KO than in the WT fibres, but the time courses of the two sets of records are remarkably similar, as will be considered further below. The amplitude of the average peak rate of Ca2+ release was considerably greater at each voltage for the WT compared to the KO fibres (Fig. 4C), but the voltage dependence was very similar. As a first approximation, average voltage dependence of peak rate of release data from both the WT and the KO fibres (Fig. 4C) of each individual fibre tested was fitted to a single Boltzmann function, as described by the equation:
| (5) |
where Rmax gives the maximum release rate, Vhalf defines the potential where R= 0.5 of Rmax, and 1/k is a measure of the steepness of the maximum release rate versus V relationship. The parameter values for the fit of the Boltzmann relationship to the WT data were 57 μm ms−1 for Rmax, 8.3 mV for the steepness factor (k) and −9.5 mV for the mid-point voltage (Vhalf), with corresponding values of 32 μm ms−1, 8.4 mV and −10.9 mV for the fit to the average KO data. The average values for the parameters for fits to the voltage dependence of peak release for the individual fibres were 56 ± 8 μm ms−1 for Rmax, 7.9 ± 0.3 mV for k and −10.5 ± 1.7 mV for Vhalf in WT fibres and 32 ± 8 μm ms−1 (P < 0.01), 8.1 ± 0.6 mV (NS) and −9.9 ± 1.5 mV (NS) for KO fibres. Thus aside from the greater amplitude of release at all voltages, the relative voltage dependence of release was essentially identical for fibres from WT and S100A1 KO animals, as shown by the scaled up voltage dependence of release from the KO fibres which essentially superimposes on that of the WT fibres (Fig. 4C).
Figure 4D plots the voltage dependence of release determined here together with the voltage dependence of charge movement, analysed in detail in the previous paper (Prosser et al. 2009). KO traces were normalized to corresponding WT Q or R values to provide a comparison of the proportional suppression of release and charge. Both WT and KO fibres demonstrated significant charge movement prior to detectable release. As can be seen the Q vs. V relationship was virtually identical in both WT and KO fibres up to the onset of detectable release at −30 mV. The Q–V plots then began to diverge upon further depolarization, with greater charge moved in the WT fibres concomitant with their increased release flux compared to KO counterparts. Differences in both release and charge in WT versus KO fibres continued to increase with further depolarization, and then saturated around +10 mV. Maximal charge was suppressed by ∼30% in KO fibres, whereas maximal release was suppressed by ∼43%. These results suggest a close correlation in the voltage dependence of suppressed Ca2+ release and the suppressed component of intra-membrane charge movement in S100A1 KO fibres.
The remaining charge in the KO represents a good approximation to Qβ, which may be responsible for the voltage-dependent activation of Ca2+ release in WT and KO fibres. We examined whether the voltage dependence of charge and peak Ca2+ release flux exhibited a relationship similar to that described by Simon & Hill (1992) for amphibian muscle fibres by fitting the normalized KO/WT R vs. V relationship (essentially identical in WT and KO fibres, as depicted in Fig. 4C) to the KO Q vs. V relationship (representing Qβ) elevated to the fourth power. Qβ4(V) did not accurately describe the R(V) relationship, as it was right shifted along the voltage axis and slightly less steep than the R(V) fit, exhibiting a Vhalf of −4.6 mV and a k value of 9.2 mV (compared to −10 mV and 8 mV for the Vhalf and k of R(V), respectively). The reason for this discrepancy is unknown, although it may stem from the fact that Simon & Hill utilized a different stimulation protocol to isolate the non-inactivatable component of Ca2+ release, whereas here we evaluated the peak release flux with variable inactivation inherent in our recordings.
The average rate of Ca2+ release records from Fig. 4 are re-plotted in Fig. 5 on an expanded time scale, but with the average Ca2+ release records from the KO fibres now scaled up to match the peak amplitude of the average WT records at the same pulse voltage. This comparison of the scaled records indicates that the relative time course of the release records for WT and KO fibres were virtually identical at all voltages examined. Temporal expansion of the initial phase of the Ca2+ release records (inset for 0 and +20 mV records) indicates that the latency and the time to peak of the normalized records were also essentially indistinguishable in the WT and KO fibres. This remarkable constancy of relative time course, but different amplitudes, of the average Ca2+ release records in the KO compared to the WT fibres, as well as the identical voltage dependence but smaller amplitude in the KO compared to the WT fibres, is consistent with an identical opening pattern for both the WT and KO RyR Ca2+ release channels, but with longer mean channel open time in the presence (WT) compared to the absence (KO) of S100A1, as previously reported for RyR1 Ca2+ channels in lipid bilayer membranes (Treves et al. 1997).
Ca2+ release amplitude is strongly correlated to the presence of Qγ in both WT and KO fibres
As considered in the preceding paper (Prosser et al. 2009 paper), there is a range of charge movement phenotypes within both the WT and the KO fibres, with a small fraction of atypical WT fibres exhibiting little or no Qγ component of charge movement (Fig. 6A and B, left, WT orange records) and a small fraction of atypical KO fibres exhibiting definite Qγ (Fig. 6A and B, left, KO green records). In the fibres studied here, two of the 11 WT fibres lacked Qγ. Two exhibited slight Qγ and seven had definite Qγ, whereas for the 11 KO fibres seven lacked Qγ, two had slight Qγ and two had definite Qγ. Figure 6A (left) shows charge movement ON records from a step to −10 mV, where Qγ is typically most prominent, in representative WT and KO fibres to demonstrate these three classifications. Figure 6B shows charge movement records in these same fibres from a step to +20 mV, where the difference in charge is still evident but there is no distinguishable ‘hump’ component. To the right of these charge records are the corresponding Ca2+ release records. Within both the WT and the KO fibre populations, there was a clear correlation in which fibres with definite Qγ had larger peak Ca2+ release, and fibres without Qγ had lower Ca2+ release (Fig. 6C, and individual unscaled Ca2+ release records in Fig. 6A and B). Within each group (WT and KO), the normalized release time courses were again similar for the fibres exhibiting low or high Qγ, and correspondingly low or high release (Fig. 6B, right). These findings suggest a clear correlation between the amplitude of Ca2+ release flux, independent of release kinetics, and the presence (or absence) of Qγ in both WT and KO fibres.
Figure 6. Correlation between Qγ and Ca2+ release in WT and KO fibres.

A and B, charge movement currents (left column traces) elicited by steps to −10 mV (top) and +20 mV (bottom) in representative WT and KO fibres demonstrating definite (green traces), slight (black traces), and no Qγ (orange traces). Ca2+ release records (middle column traces) from these same fibres at each voltage. Note the correlation between the presence or absence of Qγ and the peak of Ca2+ release. Right-most traces in B show normalized release records from +20 mV steps, showing that despite variable presence/absence of Qγ, the relative time course of Ca2+ release is virtually identical in WT and KO fibres. C, bar plot showing distribution of WT and KO fibres demonstrating definite, slight and no Qγ, and average peak release in these groups.
Comparisons of charge movement and Ca2+ release time course in fibres exhibiting or lacking Qγ
For best examination of the temporal relationship between Ca2+ release and charge movement currents in fibres with or without Qγ, we averaged the release records and charge movement current records for only the seven WT fibres in Fig. 6 exhibiting definite Qγ and for only the seven KO fibres in Fig. 6 lacking Qγ. Figure 7 presents the resulting sets of records, as well as the Qγ current record (green), calculated at each voltage as the difference in the charge movement currents, for pulses to four different voltages. At each voltage, the Qγ component developed at a time roughly corresponding to the start of the rising phase of the Ca2+ transient (Fig. 7, first vertical dashed line at each voltage) and, particularly at more positive depolarizations, peaked at a time corresponding to the time of peak of the Ca2+ release records (second vertical dashed line at each voltage). The decreasing time window between the two dashed lines with increasing voltage denotes the diminishing time window between the latency and the peak rate of Ca2+ release with increasing depolarization. Note additionally that this time window, and correspondingly the time of initial rise and peak of the Ca2+ release records, was virtually identical between groups at each voltage. In contrast, the peak of the charge movement currents was clearly delayed in WT fibres demonstrating Qγ, presumably as it developed in close conjunction with the relatively greater release in WT vs. KO fibres. Despite the relatively large, delayed additional charge moved in these WT fibres demonstrating definite Qγ compared to KO fibres with no Qγ, there were no readily detectable differences in either the relative time course of release flux or voltage dependence of release between these groups at any voltage tested (see online Supplemental Fig. 1), similar to the result found for the pooled data of all WT and KO fibres in Figs 4 and 5. These temporal relationships were as expected if Ca2+ release were causing the Qγ component.
Figure 7. Temporal comparison of charge movement and Ca2+ release in fibres exhibiting (WT fibres, n= 7) or lacking (KO fibres, n= 7) Qγ.

Average Ca2+ release flux (top records each panel) and charge movement currents (bottom record each panel) are plotted in time during depolarizing steps to designated voltages. The green curve represents the difference charge current, or Qγ current. The initial dashed line represents the start of the rising phase of Ca2+ release, and the following dashed line represents the peak of release. Note the development of the Qγ current in time with release, and the similar peaks of release and the Qγ current.
4–CMC potentiates Ca2+ release and Qγ in a voltage-dependent manner in S100A1 KO fibres
Our present results clearly demonstrate that suppression of Ca2+ release in fibres from S100A1 KO mice compared to WT littermates, without any alteration in voltage dependence or relative time course, is correlated with a suppression of Qγ. However, in a few atypical KO fibres demonstrating release similar to that of WT counterparts, Qγ could be detected. Therefore if Qγ were caused by the typically increased amplitude of release in WT compared to KO fibres, pharmacological potentiation of Ca2+ release in KO fibres should restore the missing Qγ. 4–CMC is a potent and specific agonist of RyR1 Ca2+ release (Zorzato et al. 1993; Herrmann-Frank et al. 1996; Westerblad et al. 1998). High concentrations of 4–CMC (∼1 mm) trigger a large release of SR Ca2+ in mammalian fibres without any electrical stimulation (Jiménez-Moreno et al. 2008). However, Westerblad et al. (1998) showed that at lower concentrations (100 μm) 4–CMC leads to a potentiation of released Ca2+ upon tetanic stimulation of FDB fibres, importantly without triggering significant resting release, as these authors showed less than a 10 nm change in resting Ca2+ after 10 min of 100 μm 4–CMC. In preliminary experiments, we confirmed that a 60 s exposure to 100 μm 4–CMC does in fact lead to a large potentiation of Ca2+ release in electrically stimulated KO fibres, without any significant change in the resting fibre fluorescence (2.4 ± 2.1% increase in F0 with 4–CMC, P > 0.8). Therefore, we designed the following experiment to test the effect of 4–CMC potentiation on RyR1 Ca2+ release and charge movement in KO fibres. Twenty minutes after establishing whole cell voltage clamp in the control extracellular solution, fibres from KO mice were first characterized for Ca2+ release and charge movement using the standard family of depolarizing pulses. Then, starting 60 s after adding 100 μm 4–CMC to the bathing solution, the same family of pulses was repeated on each fibre. In the presence of 4–CMC, Ca2+ release was detected at smaller depolarizations in all six KO fibres tested, and was considerably larger at intermediate depolarizations than in its absence (Fig. 8A). At the largest depolarizations the Ca2+ release records were very similar in the presence and absence of 4–CMC (Fig. 8A). The net result was thus a leftward shift in the voltage dependence of the peak rate of Ca2+ release after addition of 4–CMC (Fig. 8B). This leftward shift seen in mammalian fibres differs from the effects of 4–CMC seen in amphibian fibres, where release was increased without a leftward shift in the half-maximal voltage (Struk & Melzer, 1999).
The parameter values for the fit of the Boltzmann relationship to the average data from these six KO fibres were 31.1 μm ms−1 for the maximum release rate (Rmax), 9.5 mV for the steepness factor (k) and −9.9 mV for the mid-point voltage (Vhalf), with corresponding values of 33.5 μm ms−1, 9.5 mV and −21.1 mV for the fit to the average data for KO fibres treated with 4–CMC (Fig. 8B, curves). The average values of the Boltzmann parameters for fits to the voltage dependence of peak release for individual KO fibres before 4–CMC treatment were 31.2 ± 4.2 μm ms−1 for Rmax, 9.3 ± 0.4 mV for k and −10.0 ± 1.6 mV for Vhalf, and 33.4 ± 5.0 μm ms−1 (NS), 8.2 ± 0.7 mV (NS) and −21.9 ± 2.2 mV (P < 0.01) for KO fibres treated with 100 μm 4–CMC. Thus, 100 μm 4–CMC shifted the mid-point voltage of the voltage dependence of peak Ca2+ release without causing any significant change in the maximum amplitude of release or in the steepness of the voltage dependence. The difference in the voltage dependence of peak rate of Ca2+ release in S100A1 KO fibres in the presence compared to the absence of 4–CMC thus exhibited a peak at intermediate depolarizations (Fig. 8B and C). This is in clear contrast to the difference in the voltage dependence of Ca2+ release between KO and WT fibres, where the maximal release was different, with no difference in midpoint voltage or steepness, so that the difference curve of WT – KO fibres had the same voltage dependence as the release in either KO or WT fibres (Fig. 8C, dashed curve).
Figure 9A presents the average charge movement currents for the same KO fibres as in Fig. 8 before and after addition of 4–CMC. At intermediate depolarizations, potentiation of release with 4–CMC elicited a temporally delayed charge movement component, similar in kinetics to the Qγ component that is suppressed in KO compared to WT fibres. Similar to the voltage dependence of the augmentation of Ca2+ release by 4–CMC, the charge moved was increased at intermediate depolarizations by the presence of 4–CMC, but was much less influenced by 4–CMC at the smaller or larger depolarizations, causing the difference in charge moved (KO with minus KO without 4–CMC) to exhibit a maximum at about −20 mV (Fig. 9A, B and C; dark grey continuous curve). This was in sharp contrast to the difference in charge moved in WT vs. KO fibres, where a steep change in charge occurred at intermediate voltages (albeit right shifted voltages) but was maintained for all further depolarizations (Fig. 9C, green curve). However, the steep voltage dependence of onset and current kinetics of the component elicited by the addition of 4–CMC closely resembled the Qγ component calculated as the difference in charge movement between WT and KO fibres.
Figure 9. Potentiation of Ca2+ release with 4–CMC elicits a temporally delayed charge movement component in KO fibres.

A, average charge movement currents in same KO fibres from Fig. 8 before (red trace) and after (purple trace) the addition of 4–CMC, with resulting difference record (KO+4–CMC – KO, dark grey trace). The addition of 4–CMC to KO fibres isolated a temporally delayed ‘hump’ component similar to that seen in WT fibres. B, Q vs. V relationship of KO fibres before (red symbols) and after application of 4–CMC (purple symbols), and the resulting difference charge (dark grey symbols). 4–CMC led to additional charge moved at intermediate depolarizations that diminished in magnitude with increasing depolarization in KO fibres. C, normalized Q vs. V of difference charge isolated by application of 4–CMC to KO fibres (dark grey line) compared to difference charge between WT and KO fibres (green line). Similar to release, the charge augmented by 4–CMC in KO fibres exhibits a left-shifted activation, a peak, and then declines monotonically with increasing depolarization, in contrast to the sustained additional charge isolated between WT and KO fibres.
Discussion
The functional interaction between DHPR voltage sensor charge movement and RyR mediated SR Ca2+ release serves as the fundamental trigger of skeletal muscle EC coupling, and ultimately force generation. Here, we demonstrate for the first time in mammalian muscle fibres two clearly and reproducibly observed components of intra-membrane charge movement, monitored simultaneously with high temporal resolution characterization of SR Ca2+ release. We show a clear correlation between Ca2+ release and the Qγ component of charge movement, and provide evidence that the Qγ component is a consequence of release. Furthermore, we demonstrate decreased amplitude of the rate of Ca2+ release in fibres lacking S100A1, but an essentially identical relative time course and voltage dependence of release, when compared to WT fibres. We propose that this depressed release is the underlying cause for the suppression of Qγ in KO fibres (Prosser et al. 2009). This hypothesis is strengthened by the finding that potentiating Ca2+ release with 4–CMC partially restores Qγ in KO fibres.
Qγ: cause vs. consequence of SR Ca2+ release
Based on studies conducted primarily in amphibian muscle fibres, Qγ has been argued to be a consequence (and perhaps an additional cause) of Ca2+ release from the SR. This was demonstrated by interfering with Ca2+ release through various methods, such as voltage-dependent inactivation of RyR1, depletion of SR Ca2+ stores, or pharmacological inhibition of RyR1, and monitoring the resulting effects on the hump component of charge movement currents in amphibian fibres (Csernoch et al. 1991; García et al. 1991; Pizarro et al. 1991; Gonzalez & Rios, 1993). These authors proposed that released Ca2+ ions act as a local positive feedback signal at the t-tubule membrane, driving further charge movement and possibly greater release. Therefore, interventions that suppress release also suppress a temporally delayed component of intra-membrane charge movement.
Our results in mammalian fibres generally support this model, as evidenced by the following. (1) S100A1 KO fibres demonstrate decreased peak Ca2+ release, but a remarkably similar time course and voltage dependence of release (Figs 4 and 5) compared to WT fibres. As Qγ is a steeply voltage dependent and temporally delayed component of charge movement, if Qγ were driving release we would expect to see alterations in the time course and voltage dependence of release in KO fibres that lack Qγ. In contrast, if the depressed amplitude of release in KO fibres is altering charge movement, we would expect to see differences in charge movement current kinetics and total charge moved only at voltages where there is substantial release, as is demonstrated in Figs 4D and 7. It should be noted that despite the very similar relative time course of release detected here, we cannot rule out the possibility that limitations in clamp speed or signal to noise may prevent the detection of very subtle changes in release time course between WT and KO fibres. (2) As illustrated in Fig. 7, there is considerable charge development prior to the rise of detectable release, and Qγ begins to develop in time with release. Additionally, there is a close temporal correlation between the peak of Ca2+ release and the peak of Qγ difference current. If Qγ were driving further Ca2+ release, KO fibres that lack Qγ may be expected to demonstrate an earlier release peak than WT fibres that show Qγ. Instead, KO and WT fibres show an essentially simultaneous peak of release, suggesting that the increased amplitude of Ca2+ release in WT fibres is driving this temporally delayed charge component. (3) Interventions that specifically target RyR1 mediated Ca2+ release and bypass the voltage sensor alter Qγ, supporting the concept of Qγ as a consequence of release. Specifically, potentiating release at intermediate voltages with 4–CMC restores a temporally delayed component of charge movement in KO fibres. As demonstrated in the accompanying paper (Prosser et al. 2009), the application of dantrolene, an RyR1 inhibitor, to WT fibres suppresses a similar temporally delayed component of charge movement current. Furthermore, S100A1 KO fibres exhibit depressed Ca2+ release, detailed here in voltage clamp studies, but originally S100A1 was shown to directly affect ligand activated RyR1-mediated Ca2+ release, in the absence of voltage sensor activation (Fano et al. 1989; Treves et al. 1997; Most et al. 2003). Therefore it seems likely that enhancement of release in the presence of S100A1 is driving the additional charge component seen in WT, but not in S100A1 KO, muscle fibres. Our findings in general, therefore, support the concept of local Ca2+ release driving additional intra-membrane charge movement, or, simply re-phrased, Qγ being a consequence of SR Ca2+ release.
However, there is a notable dissimilarity between the difference component isolated by pharmacological manipulations of release, specifically application of 4–CMC to KO fibres or application of dantrolene to WT fibres, and the difference component isolated between WT and KO fibres. 4–CMC produced a leftward shift in the voltage dependence of release, augmenting release and ‘rescuing’Qγ in KO fibres only at intermediate depolarizations. This suggests that 4–CMC sensitized the RyR Ca2+ release channels to activation by the T-tubule voltage sensor, and thereby potentiated release to a sufficient extent at these intermediate voltages to surpass the threshold of release required to drive Qγ. However, at maximal depolarizations (+20 mV), there was no significant enhancement of release by 4–CMC, and subsequently no additional charge moved, in these treated KO fibres. In contrast, WT fibres exhibited greater release than KO fibres at every voltage, and correspondingly moved additional charge at every voltage (Figs 8 and 9C). This suggests two different and possibly independent mechanisms for the enhancement of release by 4–CMC and S100A1. 4–CMC appears to increase the sensitivity of the RyR Ca2+ release channels to activation. Consequently, 4–CMC improves the efficiency of coupling between the voltage sensor Qβ component and release channel activation at sub-maximal activation in KO fibres, without altering the effectiveness of the Qβ component of charge movement at maximal depolarizations, where presumably all available RyRs are already activated in the absence of 4–CMC (Fig. 9A). S100A1, on the other hand, appears to augment release without affecting the coupling efficiency of the release channels to Qβ. One possible mechanism could be that S100A1 increases the amount of Ca2+ released by an active RyR channel, with no change in activation kinetics, by increasing channel open time (or increasing single channel Ca2+ current), so that global Ca2+ release is simply scaled up without changing kinetics in WT compared to S100A1 KO fibres. Additionally, we cannot rule out the possibility that S100A1 may have a secondary effect on the voltage sensor, besides simply potentiating RyR1 Ca2+ release, which could further alter charge movement. However, the fact that atypical S100A1 KO fibres, which demonstrate ‘WT’ rates of Ca2+ release, exhibit definite Qγ and a similar voltage dependence of charge movement, argues against this possibility.
Mechanisms for generation of Qγ and comparison with previous models
The fact that the total charge moved at large depolarizations in S100A1 containing fibres that exhibit greater Ca2+ release compared to KO fibres indicates that the extra release allows movement of a separate component of intra-membrane charge that is not moved in the S100A1 KO fibres. In contrast, adding 4–CMC to KO fibres causes an increase in charge movement at intermediate, but not at large, depolarizations. Thus, this extra charge movement at intermediate voltages could be generated by the same charged groups that move at larger depolarizations in KO fibres, but now moving at intermediate depolarizations in the presence of 4–CMC. This mechanism is similar to that proposed previously for Qγ in amphibian fibres (Csernoch et al. 1991; García et al. 1991; Pizarro et al. 1991; Gonzalez & Rios, 1993). However, our finding that the total charge moved at large depolarizations is greater in WT than KO fibres is not consistent with the model for generating Qγ by a shift in the voltage range of movement of a single group of charges. Instead, our results suggest that, in WT fibres, Qγ may arise from a separate set of voltage sensors. The function of this charge movement component remains to be determined.
Our results with 4–CMC potentiation of Ca2+ release in S100A1 KO fibres raise interesting questions about the requirements for the development of Qγ. In KO fibres, increasing release by treatment with 4–CMC leads to the generation of Qγ (Figs 8 and 9), but a similar increase in release produced by further depolarization of KO fibres in the absence of 4–CMC does not. If Qγ were purely a consequence of the overall rate of release, we might expect that the Qγ charge would just be right shifted along the voltage axis in KO compared to WT fibres, a prediction not supported by our results. This suggests that an additional factor, other than simply a necessary overall rate of release, is required for the generation of Qγ. This additional factor could be the release per activated channel, rather than the overall release from all activated channels, implying a possible regulation of Qγ by the local Ca2+ in close proximity of the activated RyR channels. However, in that case 4–CMC would have to increase the Ca2+ release per activated channel at the intermediate voltage range, but not increase single channel Ca2+ release at the larger depolarizations, in addition to sensitizing the RyR channel to activation by the DHPR. Another possibility, to be tested in future studies, is whether the peak rate of release must be sufficient to match the state or conformation of the voltage sensor in order to produce Qγ. In this scenario, the altered state of the voltage sensor with further depolarization (perhaps the increasing kinetics of charge movement with increasing voltage) continuously raises the threshold for the peak rate of release required to trigger Qγ. KO fibres with low rates of release simply never are able to catch up to this threshold.
Ca2+ transients and calculated rate of Ca2+ release: comparison with previous reports
In our studies we utilized an internal solution in the whole cell patch pipette containing 20 mm EGTA with no added Ca2+, which should have resulted in near zero free Ca2+ in the resting muscle fibres 20 min after establishing the whole cell recording configuration, when our voltage clamp data acquisition began. The high intra-fibre [EGTA] also buffers the released Ca2+ at a very low level. Under these conditions, we used fluo-4 (50 μm) in the pipette to record the fluorescence signals during voltage clamp depolarizations, calculated the Ca2+ transient from the ΔF signal assuming resting Ca2+ prior to each pulse to be zero, and then calculated the rate of Ca2+ release to equal the time course of the rate of change of [Ca-EGTA]. The Ca2+ release waveforms recorded under these conditions generally resembled release records calculated previously, exhibiting a rapid rise to peak, followed first by a rapid decline attributed to Ca2+ dependent inactivation of the RyR Ca2+ release channel, and then a slower decline (Melzer et al. 1984; Delbono & Stefani, 1993). However, the slower decline seen here was considerably more rapid than recently reported by another laboratory, also using high EGTA in voltage clamped mouse FDB fibres, but with resting Ca2+ buffered at about 0.1 μm (Royer et al. 2008). The ΔF records in that paper were generally maintained during a 100 ms depolarization, whereas here the ΔF signals clearly declined during the larger 80 ms depolarizing pulses, which in turn was reflected by the relatively rapid rate of the slow phase of decline of Ca2+ release flux during our pulses. The source of this faster decline in release during the latter part of the pulses here is not known, but might be due to partial depletion of the SR at the very low level of cytoplasmic Ca2+ prior to the pulses, or possibly to some unidentified secondary effect of low resting Ca2+ concentration.
An interesting observation from our fluorescence records was the consistent elevation of baseline fluorescence in the presence, but not absence, of Cd2+ and Co2+ (Fig. 2A). These divalent cations have been previously demonstrated to interact with fluorescent Ca2+ indicators and produce an artificial elevation in dye fluorescence in multiple cell types other than muscle (Hinkle et al. 1992; Shibuya & Douglas, 1992; Schaefer et al. 1994). Presumably there is some permeation of these ions into the cell through cationic channels, allowing the interaction with cytosolic indicator dyes. This is of specific importance to the field of excitation–contraction coupling, as these cations are commonly used for the blocking of L-type Ca2+ currents, often in conjunction with fluorescence recordings. While we consistently see this artificial elevation of fluorescence in mammalian fibres, it is unclear whether this permeation into the cell occurs in amphibian fibres. We have evaluated the effects of both Cd2+ and Co2+ separately on resting fluorescence in unstimulated fibres loaded with fluo-4-AM and found a similar elevation in fluorescence, apparently independent from a rise in resting Ca2+ concentration, for both divalent cations.
Voltage dependence of charge movement and Ca2+ release
Previous studies on amphibian ileofibularis muscle fibres found a voltage dependence of Qγ with a mid point voltage about 20 mV more negative (Pizarro et al. 1991; Hui, 1983) than the value of −17 mV found here in WT mouse FDB fibres. This difference in voltage dependence of Qγ may be attributed to the right shifted voltage range found here for the appearance of Ca2+ release compared to the voltage range of release in frog fibres reported in some (Ríos & Pizarro, 1991; Simon & Hill, 1992) but not all (Melzer et al. 1986) studies on frog fibres. A similar voltage range for Ca2+ release as reported here in mouse FDB fibres has been previously described in rodent muscle fibres (Delbono & Stefani, 1993). In another report using mouse FDB fibres, both Ca2+ release and charge movement are shifted to more positive voltages than seen here (Wang et al. 1999), possibly due to the presence of La3+ in the bathing solution, which we find leads to a positive shift in the voltage dependence of charge movement.
Model for the relationship between Ca2+ release and Qγ
The results presented here clearly demonstrate that although the amplitude of the rate of Ca2+ release was clearly depressed at all voltages in S100A1 KO fibres compared to fibres from WT littermates, the time course of the release waveform was essentially unaltered. Furthermore, the voltage dependence of Ca2+ release was the same, except for a scaling factor, in fibres from WT and KO fibres. In this case, movement of some Qβ in WT fibres during depolarization (Fig. 10, top centre) would activate sufficient SR Ca2+ release to generate Qγ, presumably by released Ca2+ interacting with the voltage sensor and thereby causing an additional component of charge movement (Fig. 10, right), as suggested earlier for frog fibres (Pizarro et al. 1991). Then the absence of Qγ in fibres from KO mice is simply explained by the lower rate of release observed at all voltages in KO fibres (Fig. 10, bottom). The lower rate of Ca2+ release simply does not reach the level required for the Ca2+-dependent step(s) needed for the appearance of Qγ in the KO fibres. Consistent with the link between release amplitude and appearance of Qγ, atypical KO fibres that exhibit unusually high release rates (for the KO fibres) also exhibited definite Qγ in their charge movement records. A straightforward effect of S100A1 on RyR channel gating that could account for these observations would be for the mean RyR channel open time to be longer in the presence of S100A1 then in its absence, as previously observed in bilayer studies (Treves et al. 1997). In this case, on average there would be a greater amount of Ca2+ released during each channel opening in WT compared to S100A1 KO fibres, and a consequent larger increase in local Ca2+ in the vicinity of a putative Ca2+ binding site regulating the generation of Qγ by intra-membrane voltage sensors.
Figure 10. Model for the effects of Ca2+ release on charge movement in WT and S100A1 KO fibres.

A, proposed effects of Ca2+ release on charge movement in WT fibres. Upon depolarization, charged residues in the α1s subunit of the DHPR (cylinders in DHPR cartoon) act as voltage sensors that transduce its movement (Qβ) through the II–III loop into conformational changes that are sensed by the RyR1 and initiate Ca2+ release (middle cartoon). In WT fibres, S100A1 binding to the cytoplasmic foot of RyR1 enhances channel open time and optimizes release. This optimized Ca2+ release results in an elevation of local Ca2+ in the vicinity of a putative Ca2+ binding site regulating the generation of Qγ by the DHPR (right cartoon). B, proposed effects of the absence of S100A1 on Ca2+ release and charge movement. In this scenario, the lower rate of Ca2+ release (middle cartoon) and the subsequently blunted local Ca2+ gradient, due to the lack of S100A1, simply does not reach the ‘optimal’ level required for the Ca2+-dependent step(s) needed for the generation of Qγ (right cartoon). Qγ may arise from the further movement of the same set of voltage sensors that generate Qβ, or from a parallel set of charges uncoupled to the activation pathway. The function of this additional component of charge movement remains to be determined.
In contrast to the simple uniform increase in release at all voltages seen in WT compared to S100A1 KO fibres, the addition of 4–CMC to KO fibres caused a shift of release activation to lower depolarizations, but with little or no change in the maximum rate of Ca2+ release. This is likely to have reflected a change in the coupling efficiency between charge moved and channel activation, and caused Qγ to appear for intermediate depolarizations, but not for the largest depolarizations where release was not altered.
The exact charged residues that contribute to Qγ, as well as their function, remain undetermined. Qγ may arise from the further movement of the same set of voltage sensors that generate Qβ, or from a parallel set of charges uncoupled to the activation pathway (Bezanilla, 2000). Recent work has demonstrated several non-conducting functions of voltage-gated ion channels, such as the activation of enzymatic pathways by α and β subunits of ion channels (reviewed in Kaczmarek, 2006). It is tempting to speculate that Qγ may contribute to some alternative cell signalling pathway in skeletal muscle fibres.
Summary
In summary, here we demonstrate that Ca2+ release flux is suppressed, but unchanged in voltage dependence and relative time course, in FDB muscle fibres lacking S100A1. We also identify a clear correlation in both WT and S100A1 KO fibres between Ca2+ release flux and the presence of a temporally delayed component of intra-membrane charge movement, Qγ. We propose that the decreased release flux in S100A1 KO fibres, presumably due to the removal of a direct modulator of RyR1, accounts for the suppression of the Ca2+-activated Qγ component in KO fibres. This is supported by the finding that 4–CMC potentiates release flux during depolarizations to intermediate voltages and consequently restores Qγ in KO fibres. Thus Qγ may serve as an indicator of optimized local Ca2+ release at the triad junction. These findings shed light on the nature of RyR1 modulation and further our understanding of the complex bi-directional signalling between RyR1 and the DHPR.
Acknowledgments
The project described was supported by grant number RO1 AR055099 from the National Institute of Arthritis and Musculoskeletal and Skin Diseases, NIH. B.L.P. was supported by NIAMS training grant T32 AR007592 to the Interdisciplinary Program in Muscle Biology, University of Maryland School of Medicine.
Glossary
Abbreviations
- CaM
calmodulin
- 4-CMC
4-chloro-m-cresol
- DHPR
dihydropyridine receptor
- FDB
flexor digitorum brevis
- RyR
ryanodine receptor
- SR
sarcoplasmic reticulum
Author contributions
B.L.P. performed the experimentation, analysis, and writing involved with this work. E.O.H. contributed to experimental design, interpretation of results, and drafting of the manuscript. D.B.Z. designed and provided the S100A1−/− animal and WT counterparts, and also critically revised and approved the final manuscript. M.F.S contributed to experimental design, analysis, interpretation, discussion and drafting of the manuscript. All the experiments presented above were performed in the laboratory of M.F.S., University of Maryland, Baltimore.
Supplemental material
References
- Bezanilla F. The voltage sensor in voltage-dependent ion channels. Physiol Rev. 2000;80:555–592. doi: 10.1152/physrev.2000.80.2.555. [DOI] [PubMed] [Google Scholar]
- Csernoch L, Pizarro G, Uribe I, Rodríguez M, Ríos E. Interfering with calcium release suppresses Iγ, the ‘hump’ component of intramembranous charge movement in skeletal muscle. J Gen Physiol. 1991;97:845–884. doi: 10.1085/jgp.97.5.845. [DOI] [PMC free article] [PubMed] [Google Scholar]
- Delbono O, Stefani E. Calcium transients in single mammalian skeletal muscle fibres. J Physiol. 1993;463:689–707. doi: 10.1113/jphysiol.1993.sp019617. [DOI] [PMC free article] [PubMed] [Google Scholar]
- Fano G, Marsili V, Angelella P, Aisa MC, Giambanco I, Donato R. S100a0 protein stimulates Ca2+-induced Ca2+ release from isolated sarcoplasmic reticulum vesicles. FEBS Lett. 1989;255:381–384. doi: 10.1016/0014-5793(89)81127-5. [DOI] [PubMed] [Google Scholar]
- García J, Pizarro G, Ríos E, Stefani E. Effect of the calcium buffer EGTA on the ‘hump’ component of charge movement in skeletal muscle. J Gen Physiol. 1991;97:885–896. doi: 10.1085/jgp.97.5.885. [DOI] [PMC free article] [PubMed] [Google Scholar]
- Gonzalez A, Rios E. Perchlorate enhances transmission in skeletal muscle excitation-contraction coupling. J Gen Physiol. 1993;102:373–421. doi: 10.1085/jgp.102.3.373. [DOI] [PMC free article] [PubMed] [Google Scholar]
- Hui CS. Differential properties of two charge components in frog skeletal muscle. J Physiol. 1983;337:531–552. doi: 10.1113/jphysiol.1983.sp014640. [DOI] [PMC free article] [PubMed] [Google Scholar]
- Huang CL. Intramembrane charge movements in skeletal muscle. Physiol Rev. 1988;68:1197–1147. doi: 10.1152/physrev.1988.68.4.1197. [DOI] [PubMed] [Google Scholar]
- Harkins AB, Kurebayashi N, Baylor SM. Resting myoplasmic free calcium in frog skeletal muscle fibres estimated with fluo-3. Biophys J. 1993;65:561–562. doi: 10.1016/S0006-3495(93)81112-3. [DOI] [PMC free article] [PubMed] [Google Scholar]
- Hinkle PM, Shanshala ED, Nelso EJ. Measurement of intracellular cadmium with fluorescent dyes. J Biol Chem. 1992;287:25553–25559. [PubMed] [Google Scholar]
- Herrmann-Frank A, Richter M, Sarközi S, Mohr U, Lehmann-Horn F. 4-Chloro-m-cresol, a potent and specific activator of the skeletal muscle ryanodine receptor. Biochim Biophys Acta. 1996;1289:31–40. doi: 10.1016/0304-4165(95)00131-x. [DOI] [PubMed] [Google Scholar]
- Jiménez-Moreno R, Wang ZM, Gerring RC, Delbono O. Sarcoplasmic reticulum Ca2+ release declines in muscle fibres from aging mice. Biophys J. 2008;94:3178–3188. doi: 10.1529/biophysj.107.118786. [DOI] [PMC free article] [PubMed] [Google Scholar]
- Kaczmarek L. Non-conducting functions of voltage-gated ion channels. Nat Rev Neurosci. 2006;7:761–771. doi: 10.1038/nrn1988. [DOI] [PubMed] [Google Scholar]
- Klein MG, Simon BJ, Szucs G, Schneider MF. Simultaneous recording of calcium transients in skeletal muscle using high- and low-affinity calcium indicators. Biophys J. 1988;53:971–988. doi: 10.1016/S0006-3495(88)83178-3. [DOI] [PMC free article] [PubMed] [Google Scholar]
- Klein MG, Lacampagne A, Schneider MF. Voltage dependence of the pattern and frequency of discrete Ca2+ release events after brief repriming in frog skeletal muscle. Proc Natl Acad Sci U S A. 1997;94:11061–11066. doi: 10.1073/pnas.94.20.11061. [DOI] [PMC free article] [PubMed] [Google Scholar]
- Liu Y, Carroll SL, Klein MG, Schneider MF. Calcium transients and calcium homeostasis in adult mouse fasttwitch skeletal muscle fibres in culture. Am J Physiol Cell Physiol. 1997;272:C1919–1927. doi: 10.1152/ajpcell.1997.272.6.C1919. [DOI] [PubMed] [Google Scholar]
- Melzer W, Rios E, Schneider MF. Time course of calcium release and removal in skeletal muscle fibres. Biophys J. 1984;45:637–641. doi: 10.1016/S0006-3495(84)84203-4. [DOI] [PMC free article] [PubMed] [Google Scholar]
- Most P, Remppis A, Weber C, Bernotat J, Ehlermann P, Pleger ST, Kirsch W, Weber M, Uttenweiler D, Smith GL, Katus HA, Fink RH. The C terminus (amino acids 75–94) and the linker region (amino acids 42–54) of the Ca2+-binding protein S100A1 differentially enhance sarcoplasmic Ca2+ release in murine skinned skeletal muscle fibres. J Biol Chem. 2003;278:26356–26364. doi: 10.1074/jbc.M303338200. [DOI] [PubMed] [Google Scholar]
- Melzer W, Schneider MF, Simon BJ, Szucs G. Intramembrane charge movement and calcium release in frog skeletal muscle. J Physiol. 1986;373:481–511. doi: 10.1113/jphysiol.1986.sp016059. [DOI] [PMC free article] [PubMed] [Google Scholar]
- Pizarro G, Csernoch L, Uribe I, Rodríguez M, Ríos E. The relationship between Qγ and Ca release from the sarcoplasmic reticulum in skeletal muscle. J Gen Physiol. 1991;97:913–947. doi: 10.1085/jgp.97.5.913. [DOI] [PMC free article] [PubMed] [Google Scholar]
- Prosser B, Wright N, Hernandez-Ochoa E, Varney K, Liu Y, Olojo R, Zimmer D, Weber D, Schneider M. S100A1 binds to the calmodulin-binding site of ryanodine receptor and modulates skeletal muscle excitation-contraction coupling. J Biol Chem. 2007;283:5046–5057. doi: 10.1074/jbc.M709231200. [DOI] [PMC free article] [PubMed] [Google Scholar]
- Prosser B, Hernandez-Ochoa E, Zimmer D, Schneider M. The Qγ component of intra-membrane charge movement is present in mammalian muscle fibres, but suppressed in the absence of S100A1. J Physiol. 2009;587:4523–4541. doi: 10.1113/jphysiol.2009.177238. [DOI] [PMC free article] [PubMed] [Google Scholar]
- Royer L, Pouvreau S, Ríos E. Evolution and modulation of intracellular calcium release during long-lasting, depleting depolarization in mouse muscle. J Physiol. 2008;586:4609–4629. doi: 10.1113/jphysiol.2008.157990. [DOI] [PMC free article] [PubMed] [Google Scholar]
- Ríos E, Pizarro G. Voltage sensor of excitation-contraction coupling in skeletal muscle. Physiol Rev. 1991;71:849–908. doi: 10.1152/physrev.1991.71.3.849. [DOI] [PubMed] [Google Scholar]
- Schaefer T, Beters J, Beyersmann D. Cadmium uptake and interference with receptor-mediated calcium mobilization in PC12 cells. Metal Ions in Biology and Medicine. 1994:149–154. [Google Scholar]
- Schneider MF, Simon BJ. Inactivation of calcium release from the sarcoplasmic reticulum in frog skeletal muscle. J Physiol. 1988;405:727–745. doi: 10.1113/jphysiol.1988.sp017358. [DOI] [PMC free article] [PubMed] [Google Scholar]
- Shirokova N, García J, Pizarro G, Ríos E. Ca2+ release from the sarcoplasmic reticulum compared in amphibian and mammalian skeletal muscle. J Gen Physiol. 1996;107:1–18. doi: 10.1085/jgp.107.1.1. [DOI] [PMC free article] [PubMed] [Google Scholar]
- Shibuya I, Douglas WW. Calcium channels in rat melanotrophs are permeable to manganese, cobalt, cadmium, and lanthanum, but not to nickel: evidence provided by fluorescence changes in fura-2-loaded cells. Endocrinology. 1992;131:1936–1941. doi: 10.1210/endo.131.4.1327724. [DOI] [PubMed] [Google Scholar]
- Simon BJ, Klein MG, Schneider MF. Calcium dependence of inactivation of calcium release from the sarcoplasmic reticulum in skeletal muscle fibres. J Gen Physiol. 1991;97:437–471. doi: 10.1085/jgp.97.3.437. [DOI] [PMC free article] [PubMed] [Google Scholar]
- Simon BJ, Hill DA. Charge movement and SR calcium release in frog skeletal muscle can be related by a Hodgkin-Huxley model with four gating particles. Biophys J. 1992;61:1109–1116. doi: 10.1016/S0006-3495(92)81920-3. [DOI] [PMC free article] [PubMed] [Google Scholar]
- Struk A, Melzer W. Modification of excitation-contraction coupling by 4-chloro-m-cresol in voltage-clamped cut muscle fibres of the frog. J Physiol. 1999;515:221–231. doi: 10.1111/j.1469-7793.1999.221ad.x. [DOI] [PMC free article] [PubMed] [Google Scholar]
- Treves S, Scutari E, Robert M, Groh S, Ottolia M, Prestipino G, Ronjat M, Zorzato F. Interaction of S100A1 with the Ca2+ release channel (ryanodine receptor) of skeletal muscle. Biochemistry. 1997;36:11496–11503. doi: 10.1021/bi970160w. [DOI] [PubMed] [Google Scholar]
- Wang ZM, Messi ML, Delbono O. Patch-clamp recording of charge movement, Ca2+ current, and Ca2+ transients in adult skeletal muscle fibres. Biophys J. 1999;77:2709–2716. doi: 10.1016/s0006-3495(99)77104-3. [DOI] [PMC free article] [PubMed] [Google Scholar]
- Westerblad H, Andrade FH, Islam MS. Effects of ryanodine receptor agonist 4-chloro-m-cresol on myoplasmic free Ca2+ concentration and force of contraction in mouse skeletal muscle. Cell Calcium. 1998;24:105–115. doi: 10.1016/s0143-4160(98)90078-1. [DOI] [PubMed] [Google Scholar]
- Zorzato F, Scutari E, Tegazzin V, Clementi E, Treves S. Chlorocresol: an activator of ryanodine receptor-mediated Ca2+ release. Mol Pharmacol. 1993;44:1192–201. [PubMed] [Google Scholar]
Associated Data
This section collects any data citations, data availability statements, or supplementary materials included in this article.