The constraints imposed by high sensitivity cellular and medical imaging, especially through tissue, has fueled efforts in developing red and near-infrared (NIR) fluorophores. Ideal for excitation and emission within the optical window from 630-1100nm, two-photon excited fluorescence offers high spatial resolution owing to its inherent quadratic intensity dependence, while also providing spectral selectivity and improved sensitivity resulting from decreased NIR absorption, scattering, and fluorescence in tissue.1,2 Many fluorophores have been created and characterized for multiphoton bio-imaging.3 Push-pull organic dyes have been created with high absorption cross sections,4 but water-soluble organic dyes are plagued by low two-photon absorption (TPA) cross sections and rapid photobleaching.5 Semiconductor quantum dots exhibit large two-photon excitation (TPE) cross sections,6 but pose problems due to their large physical size and toxicity concerns.7,8 Recently, gold clusters and nanoparticles (Au≥38) have been reported with high TPA cross sections, but their solubility in hexane and low total fluorescence currently limit application as biolabels.9
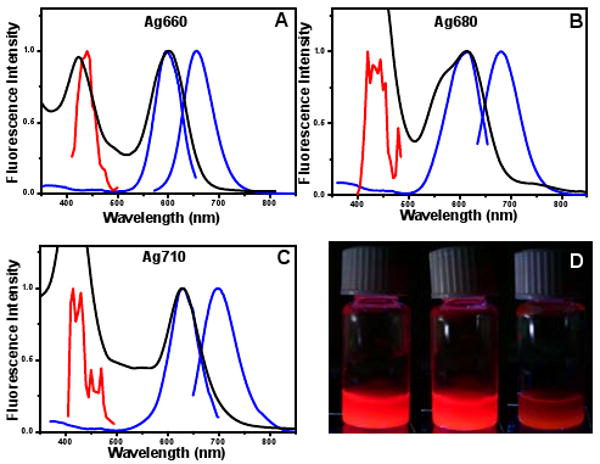
Here we present a new class of two-photon dyes with high TPE cross sections, providing bright, photostable emission with versatile tunability of excitation and emission wavelengths. We have previously reported sequence-dependent oligonucleotide encapsulation of silver clusters to selectively create emissive species in the blue, green, red, and near-IR,10 that also have utility as intracellular fluorophores.11,12 Further refining microarray experiments has enabled creation of three distinct red/NIR-emitting species (Fig. 1). These nanoclusters all exhibit indistinguishable hydrodynamic radii and yield spectrally pure solutions emitting at 660, 680, or 710 nm, after synthesis according to a previously described procedure.10 Two-photon excitation (150 fs, 80MHz, 680-1040nm, Coherent Mira) yields emission indistinguishable from one-photon excitation (OPE) (Figure 1).
Figure 1.

(A) OPE fluorescence and excitation (blue), TPE (red) spectra, and absorption spectra (black) of 660nm emitting species created in 5′-CCCATATTCCCC-3′. (B) 680nm emitting species created in 5′-CCCTATAACCCC-3′. (C) 710nm emitting species created in 5′-CCCTAACTCCCC-3′. (D) Picture showing from left to right the OPE emission of the 660, 680, and 710nm species
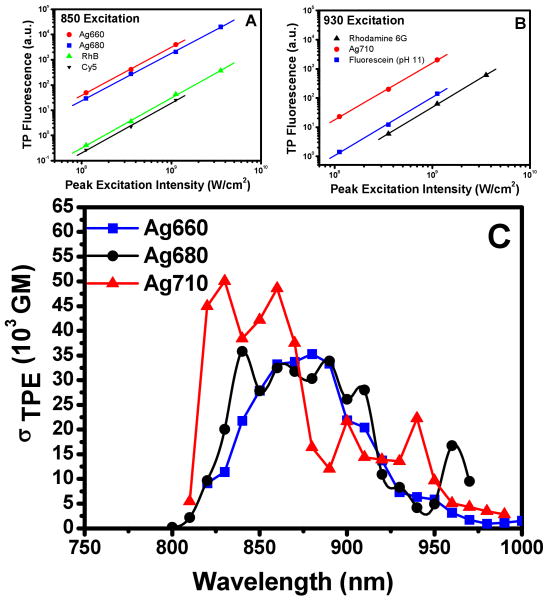
A function of TPA cross section, quantum yield, concentration, and excitation intensity, two photon excited fluorescence was recorded on a CCD camera (Newton, Andor) through a monochromator. Quadratic excitation intensity dependent regions were identified for each Ag nanocluster compared with excitation and TPE fluorescence from reference dyes3,13,14 (Fig. 2). Accounting for concentration and quantum yield differences, the ratios of emission intensities in quadratically-dependent excitation intensity regions enabled the calculation of cross sections. As OPE and TPE emission energies and the fluorescence lifetimes are indistinguishable for each nanocluster emitter (Table 1), one- and two-photon-excited quantum yields were treated as being the same for each species. Each nanocluster cross section measurement was referenced to two separate reference dyes (rhodamine B,13 fluorescein (pH=11),3 or Cy514, Table 1) to provide a cross-reference for accuracy, and measured TPE brightness further validate OPE and TPE ΦF's being the same. To avoid dark state residence in either the nanodots or the reference dyes, all cross section measurements were performed at 8 kHz, ensuring that all molecules have returned to the ground state before the arrival of the next excitation pulse.
Figure 2.
(A) and (B) Excitation intensity dependence taken at 8 kHz excitation rate, plotted on a log-log scale, along with references rhodamine B and Cy5 (for A) and rhodamine 6G and fluorescein (for B). (C) TPE cross-sections as a function of wavelength for the 3 species. The slopes of the fitted lines are 1.9±0.1 for Ag660, 1.9±0.1 for Ag680, and 2.0±0.1 for Ag710.
Table 1.
OPE and TPE Photophysical values of Ag Nanoclusters
| TPE ex. max | σ (GM) | Φ | τOPE (ns) | τTPE(ns) | Rhd(nm) | |
|---|---|---|---|---|---|---|
| Ag660 | 880 nm | 35,300 | 0.18 | 3.0 ± 0.02 | 3.1± 0.02 | 2.3 |
| Ag680 | 890 nm | 33,900 | 0.37 | 3.0± 0.02 | 3.0± 0.02 | 2.3 |
| Ag710 | 830 nm | 50,000 | 0.31 | 3.5± 0.02 | 3.4± 0.02 | 2.3 |
| RhB | 840 nm | 210 | 0.31 | 1.8 | 0.7 | |
| Cy5-DNA | 785 nm | 400 | 0.27 | 1.0 | 2.7 | |
| Fluor | 930 nm | 24 | 0.95 | 4.0 |
As shown in Figure 2C, the cross section for the 660nm emitter peaks at 35,000 Goppert-Mayer (GM) units (10-50cm4photon/s), while the 680nm emitter peaks at 34,000 GM, and the 710nm emitter reaches 50,000 GM. These cross sections are close to the value of water-soluble quantum dots (66,000 GM),6 with brightnesses far exceeding that observed for the best water-soluble two-photon dyes.5 Ag nanoclusters, however, are not only much smaller than quantum dots, but they also do not exhibit the heavy metal toxicity. Two-photon fluorescence correlation spectroscopy experiments confirm that the hydrodynamic radii of Ag660, Ag680, and Ag710 (all ∼2.3nm) are smaller than Cy-5 labeled 12-mer DNA (2.7nm).
For each of the species, an excitation spectrum was measured and calibrated for the cross section measurement in GM units. The excitation maxima are blue-shifted with respect to the OPE peak (Figure 1), indicating that TPE accesses a higher excited electronic state than OPE. The OPE excitation spectra of the three species all show, in addition to the primary electronic transitions at or beyond 600nm, much less efficient excitation at higher energy overlaps with the doubled TPE transition energy (Figure 1). Although OPE and TPE transitions typically exhibit different selection rules,15 the absorption, OPE, and TPE spectra suggest that the selection rules for this transition are loosened, and the clusters can be directly excited to this high energy state.
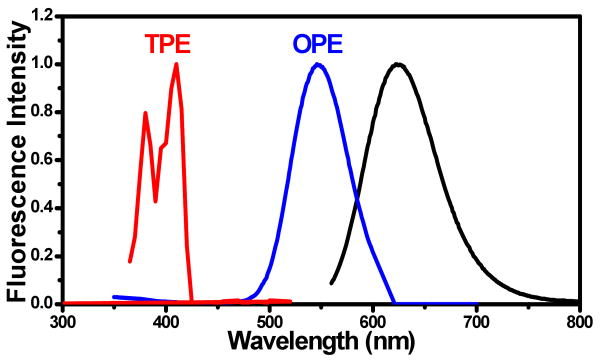
Though the Ti-sapphire range does not permit us to directly excite at half the transition energy of the primary OPE transition for the emitters reported here (i.e. ≥1150nm excitation), we excited another emitter (540nm excitation, 620nm emission,10 Fig. 3), much closer to half the OPE excitation energy. No pre-resonance by TPE was observed upon approaching half the OPE transition energy. Although high energy overlap in OPE and TPE spectra exists, direct TPE into the primary OPE peak yields no observable fluorescence, suggesting that transitions may be doubly enhanced by both intermediate and final state resonances.
Figure 3.
(A) The OPE and TPE (doubled in energy) spectra are shown along with the emission spectrum (black) for 620nm emitting Ag nanoclusters.10 Only a small portion of the OPE overlaps with the TPE spectrum (out as far as 1040 nm), but no overlap with the principal OPE peak at 540nm is observed.
According to theoretical sum rules,16 the fundamental limit of the TPA cross section can be estimated as a function of the number of participating electrons, surrounding refractive index, and the energy of the OPE and TPE transitions. For a system resonant only with the final two-photon state, the limit is ∼210,000 GM for a 5 electron system, with n=1.5 (considering the higher index of the surrounding DNA17), assuming a spherical cluster shape. Though the number of participating electrons N is not precisely known, previously reported results suggest that N≤5,18,19 which would lead to σTPE/σTPEmax ≥ 0.24. Push-pull organic dyes typically exhibit values of less than 0.01.16 The free electrons of Ag clusters, however, exhibit large polarizabilities through free movement of electrons within the cluster,20,21 possibly accounting for more efficient two-photon absorption per electron.
These Ag nanoclusters exhibit TPE cross sections in buffer far surpassing all known water-soluble fluorophores and are comparable to much larger quantum dot cross sections. With some of the largest water-soluble TPE action cross sections known, the single point of attachment, small size, and excellent one- and two-photon brightness, metal clusters hold great promise as high sensitivity biolabels.
Supplementary Material
Acknowledgments
The authors greatly acknowledge financial support by NIH R01-GM068732, NIH P20-GM072021 and NIH R. Kirchenstein NRSA F31EB008324.
Footnotes
Supporting Information Available: Full author lists for references 3 and 4. This material is available free of charge via the Internet at http://pubs.acs.org
References
- 1.Xu C, Zipfel W, Shear JB, Williams RM, Webb WW. Proc Natl Acad Sci USA. 1996;93:10763–10768. doi: 10.1073/pnas.93.20.10763. [DOI] [PMC free article] [PubMed] [Google Scholar]
- 2.Zipfel WR, Williams RM, Webb WW. Nature Biotech. 2003;21:1368–1376. doi: 10.1038/nbt899. [DOI] [PubMed] [Google Scholar]
- 3.Albota M, et al. Science. 1998;281:1653–1656. doi: 10.1126/science.281.5383.1653. [DOI] [PubMed] [Google Scholar]
- 4.Chung SJ, et al. J Am Chem Soc. 2006;128:14444–14445. doi: 10.1021/ja065556m. [DOI] [PubMed] [Google Scholar]
- 5.Rubart M. Circ Res. 2004;95:1154–1166. doi: 10.1161/01.RES.0000150593.30324.42. [DOI] [PubMed] [Google Scholar]
- 6.Larson DR, Zipfel WR, Williams RM, Clark SW, Bruchez MP, Wise FW, Webb WW. Science. 2003;300:1434–1436. doi: 10.1126/science.1083780. [DOI] [PubMed] [Google Scholar]
- 7.Derfus AM, Chan WCW, Bhatia SN. Nano letters. 2004;4:11–18. doi: 10.1021/nl0347334. [DOI] [PMC free article] [PubMed] [Google Scholar]
- 8.Kirchner C, Liedl T, Kudera S, Pellegrino T, Javier AM, Gaub HE, Stolzle S, Fertig N, Parak WJ. Nano Lett. 2005;5:331–338. doi: 10.1021/nl047996m. [DOI] [PubMed] [Google Scholar]
- 9.Ramakrishna G, Varnavski O, Kim J, Lee D, Goodson T. J Am Chem Soc. 2008;130:5032–5033. doi: 10.1021/ja800341v. [DOI] [PubMed] [Google Scholar]
- 10.Richards CI, Choi S, Hsiang JC, Antoku Y, Vosch T, Bongiorno A, Tzeng YL, Dickson RM. J Amer Chem Soc. 2008;130:5038–5039. doi: 10.1021/ja8005644. [DOI] [PMC free article] [PubMed] [Google Scholar]
- 11.Yu J, Choi S, Richards CI, Antoku Y, Dickson RM. Photochem and Photobiol. 2008 doi: 10.1111/j.1751-1097.2008.00434.x. In Press. [DOI] [PMC free article] [PubMed] [Google Scholar]
- 12.Yu J, Patel SA, Dickson RM. Angew Chemie-Int Ed. 2007;46:2028–2030. doi: 10.1002/anie.200123456. [DOI] [PMC free article] [PubMed] [Google Scholar]
- 13.Xu C, Webb WW. J Opt Soc Am B. 1996;13:481–491. [Google Scholar]
- 14.Lukomska J, Gryczynski I, Malicka J, Makowiec S, Lakowicz JR, Gryczynski Z. Biochem Biophys Res Commun. 2005;328:78–84. doi: 10.1016/j.bbrc.2004.12.148. [DOI] [PMC free article] [PubMed] [Google Scholar]
- 15.Lakowicz JR. Principles of fluorescence spectroscopy. 3rd. Springer; 2006. [Google Scholar]
- 16.Kuzyk MG. J Chem Phys. 2003;119:8327–8334. [Google Scholar]
- 17.Benesch J, Askendal A, Tengvall P. J Colloid Interface Sci. 2002;249:84–90. doi: 10.1006/jcis.2002.8247. [DOI] [PubMed] [Google Scholar]
- 18.Petty JT, Zheng J, Hud NV, Dickson RM. J Amer Chem Soc. 2004;126:5207–5212. doi: 10.1021/ja031931o. [DOI] [PubMed] [Google Scholar]
- 19.Ritchie CM, Johnsen KR, Kiser JR, Antoku Y, Dickson RM, Petty JT. J Phys Chem C. 2007;111:175–181. doi: 10.1021/jp0648487. [DOI] [PMC free article] [PubMed] [Google Scholar]
- 20.de Heer WA. Rev Mod Phys. 1993;65:611–676. [Google Scholar]
- 21.Tiggesbaumker J, Koller L, Lutz HO, Meiwes-Broer KH. Chem Phys Lett. 1992;190:42–47. [Google Scholar]
Associated Data
This section collects any data citations, data availability statements, or supplementary materials included in this article.


