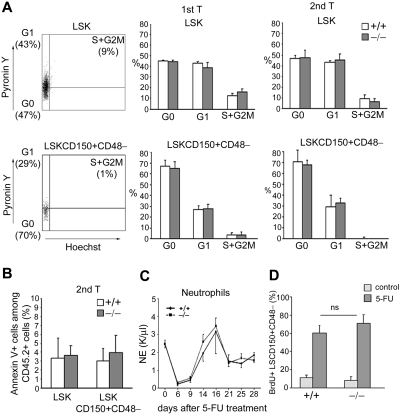
Figure 5.
p190-B−/− HSC/P exhibit normal cell-cycle rate and survival during serial transplantation. (A) Cell-cycle status of WT and p190-B−/− LSKCD150+CD48− cells. BM LSKCD150+CD48− cells of primary and secondary recipients were stained with Hoechst 33342 dye and Pyronin Y. Histograms represent the percentage of CD45.2+ LSKCD150+CD48− cells and LSK cells in G0, G1, and S/G2M phases of the cell cycle (mean ± SD; n = 5). (B) Apoptosis analysis of LSKCD150+CD48− cells. BM cells from secondary transplantation recipients were stained with annexin V and analyzed by flow cytometry. Data represent the percentage of CD45.2+ LSKCD150+CD48− and LSK annexin V+ cells (mean ± SD; n = 5). (C) PB recovery after a single dose of 5-FU. Kinetics of neutrophil PB counts are shown (mean ± SEM; n = 3 independent experiments, n = 5 mice per group and experiment). (D) The proliferation of LSCD150+CD48− cells was measured by in vivo BrdU incorporation over 15 hours. Histogram is percentage of LSCD150+CD48−, which incorporated BrdU (mean ± SD; n = 3).

