

Abstract
Background
Preoperative chemoradiotherapy is recommended for locally advanced rectal cancer (UICC stage II/III). We recently demonstrated that responsive and non-responsive tumors showed differential expression levels of 54 genes. In this follow-up study, we investigated the relationship between this gene-set and disease-free (DFS) and overall survival (OS).
Methods
Pre-therapeutic biopsies from 30 participants in the CAO/ARO/AIO-94 trial of the German Rectal Cancer Study Group were analyzed using gene expression microarrays. Statistical analysis was performed to identify differentially expressed genes between recurrent and non-recurrent tumors and to correlate these changes with disease recurrence and outcome.
Results
After a median follow-up of 59 months, seven of eight patients with recurrent disease belonged to the group of non-responders, while one responsive tumor recurred. Response to chemoradiotherapy was significantly correlated with an improved DFS (log rank p=0.028), while the OS did not differ significantly (p=0.11). Applying a class comparison analysis we identified 20 genes that were differentially expressed between recurrent and non-recurrent tumors at p<0.001. Analyzing the first two principal components of the 54 genes previously identified to predict response, we observed that this response signature correlated with an increased risk of cancer recurrence.
Conclusions
These data suggest that the genetic basis of local response also affects the genetic basis of tumor recurrence, and we demonstrated that genes that are indicative of non-response to preoperative chemoradiotherapy might also be linked to an increased risk of tumor recurrence.
Keywords: Rectal cancer, gene expression profiling, 5-FU-based preoperative chemoradiotherapy, recurrence, prognosis
1. Introduction
Gene expression profiling has been extensively applied to study colorectal tumors, and comparisons of primary tumors with associated mucosa samples or precursor lesions have been published [1-7]. Subsequently, stage-specific signatures were described [8-12], and profiles of recurrence and prognosis [13-18] or response to chemotherapy [19, 20] were derived for colon cancers. Since prognostic or predictive signatures are still lacking for locally advanced rectal cancers (UICC stage II/III) [21], we explored whether transcriptional profiling might unveil signatures indicative of therapeutic response to preoperative chemoradiotherapy (CT/RT) and survival.
As a result of the recently published CAO/ARO/AIO-94 trial of the German Rectal Cancer Study Group [22], preoperative 5-fluorouracil (5-FU) based CT/RT is now recommended for UICC stage II/III rectal cancer in Germany, large parts of Europe and the USA [23]. However, tumor response is very heterogeneous, ranging from complete response to resistance [24]. We recently demonstrated for a subset of patients treated within this clinical trial that pre-therapeutic gene expression profiling might be useful for prediction of response to preoperative CT/RT [25]. Yet, from a clinical perspective, there is considerable discussion on how to reliably assess and define response, and it remains to be determined how tumor response relates to the individual patient's prognosis. Clinicians agree, however, that it is of considerable relevance to establish predictive markers for response, and ultimately, survival.
After a median follow-up of 59 months, we therefore correlated CT/RT-induced T-level downsizing with disease-free survival (DFS) and overall survival (OS). Additionally, we evaluated the relationship of expression changes of the identified set of 54 genes and disease recurrence.
2. Materials and Methods
2.1. Patient Samples and Clinical Treatment
All 30 patients (age: 60.7 ± 8.2 years) participated in the CAO/ARO/AIO-94 trial of the German Rectal Cancer Study Group [22], and were treated at the Department of General and Visceral Surgery, University Medicine, Göttingen, Germany. Preoperative CT/RT, surgical treatment – including total mesorectal excision (TME) [26] - and histopathologic workup were standardized as part of the clinical trial. Only patients with uT3 (n=29) and uT4 (n=1) adenocarcinomas located within 16 cm from the anocutaneous verge were included in this study. The experimental design is summarized in Figure 1, and the clinical data are summarized in Table 1.
Fig. 1.
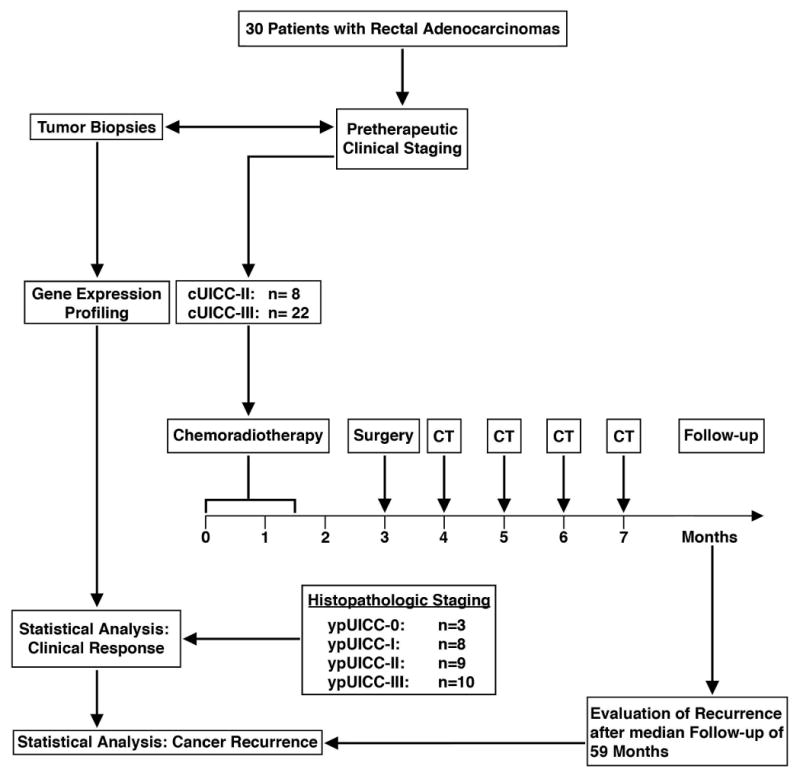
Presentation of study design, clinical treatment and follow-up. cUICC refers to pre-therapeutic clinical staging of locally advanced rectal cancers, ypUICC to histopathological assessment of the resected specimens after preoperative chemoradiotherapy; CT, postoperative chemotherapy.
Table 1.
Clinical data of 30 patients. uT, pre-therapeutic T-category determined by endorectal ultrasound; ypT, T-level determined by histopathological assessment after preoperative chemoradiotherapy; ypN, lymph node status by histopathological assessment; ypN total, total number of analyzed lymph nodes; ypN infiltrated, number of infiltrated lymph nodes; cUICC, clinical UICC stage; ypUICC, post-treatment UICC stage; UICC, International Union Against Cancer; Tis, tumor in situ; DFS, disease-free survival in months reflecting the interval from R0 resection to cancer recurrence; OS, overall survival in months reflecting the interval between surgery and any death including cancer-specific survival.
| Tumor Samples |
uT | ypT | T-level downsizing |
ypN | ypN total |
ypN infiltrated |
cUICC stage |
ypUICC stage |
UICC downstagin g |
Regression grading |
Recurrence | DFS | OS | Status |
|---|---|---|---|---|---|---|---|---|---|---|---|---|---|---|
| P1 | 3 | 0 | + | 0 | 18 | 0 | II | 0 | + | 4 | - | 64 | 64 | alive |
| P2 | 3 | 0 | + | 0 | 27 | 0 | III | 0 | + | 4 | - | 58 | 58 | alive |
| P3 | 3 | 0 | + | 0 | 16 | 0 | II | 0 | + | 4 | - | 54 | 54 | alive |
| P4 | 3 | 2 | + | 0 | 22 | 0 | III | I | + | 3 | - | 74 | 74 | alive |
| P5 | 3 | 1 | + | 0 | 20 | 0 | II | I | + | 3 | - | 65 | 65 | alive |
| P6 | 3 | 2 | + | 0 | 24 | 0 | III | I | + | 3 | - | 60 | 60 | alive |
| P7 | 3 | 1 | + | 0 | 18 | 0 | II | I | + | 3 | - | 58 | 58 | alive |
| P8 | 4 | 3c | + | 1 | 19 | 3 | III | III | - | 3 | - | 74 | 74 | alive |
| P9 | 3 | 2 | + | 0 | 16 | 0 | II | I | + | 2 | - | 68 | 68 | alive |
| P10 | 3 | 3b | - | 1 | 30 | 1 | III | III | - | 3 | - | 66 | 66 | alive |
| P11 | 3 | 3b | - | 0 | 15 | 0 | III | II | + | 3 | liver + peritoneum | 3 | 7 | dead |
| P12 | 3 | 3b | - | 0 | 8 | 1 | II | III | - | 3 | - | 78 | 78 | alive |
| P13 | 3 | 3b | - | 1 | 27 | 1 | III | III | - | 3 | - | 53 | 53 | alive |
| P14 | 3 | 4a | - | 1 | 19 | 1 | III | III | - | 2 | lung | 35 | 66 | alive |
| P15 | 3 | 3b | - | 0 | 28 | 0 | III | II | + | 2 | - | 65 | 65 | alive |
| P16 | 3 | 3a | - | 0 | 21 | 0 | III | II | + | 2 | - | 59 | 59 | alive |
| P17 | 3 | 3b | - | 1 | 19 | 2 | III | III | - | 2 | lung | 51 | 74 | alive |
| P18 | 3 | 4a | - | 1 | 21 | 2 | III | III | - | 3 | local + peritoneum | 35 | 57 | dead |
| P19 | 3 | 3c | - | 0 | 24 | 0 | III | II | + | 1 | - | 74 | 74 | alive |
| P20 | 3 | 3c | - | 0 | 16 | 0 | II | II | - | 1 | liver + cerebrum | 5.5 | 21 | dead |
| P21 | 3 | 3c | - | 0 | 17 | 0 | III | II | + | 1 | - | 59 | 59 | alive |
| P22 | 3 | 3a | - | 0 | 14 | 0 | III | II | + | 1 | lung | 12 | 68 | alive |
| P23 | 3 | 4a | - | 1 | 22 | 1 | III | III | - | 1 | - | 74 | 74 | alive |
| P24 | 3 | 2 | + | 0 | 16 | 0 | II | I | + | 3 | - | 52 | 52 | alive |
| P25 | 3 | 2 | + | 0 | 17 | 0 | III | I | + | 2 | - | 50 | 50 | alive |
| P26 | 3 | 3 | - | 0 | 20 | 0 | III | II | + | 2 | liver | 17 | 48 | alive |
| P27 | 3 | 2 | + | 2 | 14 | 5 | III | III | - | 3 | - | 48 | 48 | alive |
| P28 | 3 | Tis | + | 1 | 17 | 1 | III | III | - | 3 | lymph node metastasis | 49 | 53 | alive |
| P29 | 3 | 3c | - | 0 | 15 | 0 | III | II | + | 2 | - | 53 | 53 | alive |
| P30 | 3 | 2 | + | 0 | 12 | 0 | II | I | + | 2 | - | 41 | 41 | alive |
2.2. Histopathological Staging
Histopathological staging was performed according to the TNM classification of the UICC [27], and resected specimens were assessed according to established protocols [28, 29]. Cases with resection margins (oral, aboral, lateral, and circumferential) free of vital tumor cells within a minimum distance of 1 mm were classified as R0 tumor resection.
2.3. Response Classification
Response to preoperative CT/RT was previously defined as downsizing of the primary rectal cancer by comparing the uT-category (determined by endorectal ultrasound) with the histopathologically assessed ypT-status [25]. Previously, we had demonstrated that the endoscopic assessment of the T-category correlated very well with the histopathological diagnosis [30]. A reduction of tumor infiltration by at least one T-category resulted in classification as responsive (T-level downsizing). Furthermore, a reduction of the pre-therapeutic UICC-category compared to the histopathologic UICC-category by at least one category was defined as UICC downstaging. Histopathologic tumor regression grading was determined based on a semi-quantitative five-point classification system as proposed earlier [31].
2.4. Clinical Follow-up
All patients were followed at three-month intervals for the first two years, and then at six-month intervals, according to the CAO/ARO/AIO-94 trial design [22]. Disease-free survival was defined as the interval between potentially curative (R0) tumor resection and local or distant cancer recurrence. Data of patients who were alive and remained without local and/or distant cancer recurrence at the last observation as well as patients who died without relapse were censored for the survival analysis. Overall survival was defined as the interval between R0-resection and death due to any cause including cancer-specific death.
2.5. Gene Expression Profiling
Gene expression profiling was performed as previously described [25]. An initial set of 23 tumors was hybridized to cDNA microarrays (9,984 features), while an additional set of seven tumors was hybridized to oligonucleotide microarrays (22,231 features).
2.6. Statistical Analysis: Disease-free Survival and Overall Survival
The Kaplan-Meier survival estimates method was applied to calculate OS and DFS. The differences in DFS and OS between patients with and without T-level downsizing were determined by the log-rank test; results with a p-value less than 0.05 were considered significant. The analyses were performed using the statistical software R, version 2.3.0 (http://www.r-project.org).
2.7. Statistical Analysis: Class Comparison
In order to determine genes differentially expressed between patients with disease recurrence and those without, we performed a Class Comparison analysis using the BRBArrayTools package developed at the Biometric Research Branch of the National Cancer Institute (Bethesda, MD) [32]. The two-sample T-test with a randomized variance model [33], and a stringent statistical significance threshold of p<0.001 was applied. A permutation test was performed to obtain the significance of finding a given number of genes satisfying the p-value criteria if there was no relationship between recurrence and gene expression [32].
2.8. Statistical Analysis: Gene Expression Signatures and Risk of Recurrence
To test the hypothesis that the previously identified set of genes is correlated with disease-free survival and overall survival, we used the first and second Principal Components of the expression of these 54 genes to create a two-dimensional plot of the variations in the molecular signatures of the different samples. The Principal Components are weighted sums of the expression levels of these differentially expressed genes, which are chosen to maximize the variance. For consistency, we only analyzed those 23 tumors that were hybridized to cDNA arrays.
3. Results
3.1. Patient Characteristics
Twenty-two patients with rectal adenocarcinomas were diagnosed with cUICC stage III, and eight patients with cUICC stage II (Table 1). According to the clinical trial design, all operations were performed by four experienced and well-trained surgeons. Locally curative (R0) tumor resection was achieved for all patients. Surgical procedures included 13 low anterior resections (43.3%) for tumors with a median pre-therapeutic tumor location within 9 cm above the anocutaneous verge (mean 8.8 cm ± 3.2 cm). Seventeen abdominoperineal resections (56.7%) were performed due to a median tumor location within 3 cm above the anocutaneous verge (mean 3.4 cm ± 2.3 cm). In median, 18.5 lymph nodes (mean: 19.1 ± 4.9 lymph nodes) were investigated to determine the nodal status (ypN0, n=20; ypN1, n=9; and ypN2, n=1) and the UICC stage (ypUICC stage 0, n=3; ypUICC I, n=7; ypUICC II, n=10; and ypUICC III, n=10).
Comparison of the pre- and post-therapeutic staging revealed that T-level downsizing was achieved in 14 of 30 patients (46.7%); eight cases were downsized by one T-level, two cases by two T-levels and four cases by three T-levels (Table 1). Only patients who showed at least one T-level reduction were considered responders (P1-P9, P24, P25, P27, P28 and P30). UICC downstaging was achieved in 19 of 30 patients (63%): in 13 cases by one UICC-stage, in five cases by two UICC-stages, and in one case by three UICC-stages. All tumors showed a certain degree of tumor regression, and we observed three tumors with a TRG 4 (complete regression), 13 tumors with a TRG 3, nine tumors with a TRG 2, and five tumors with a TRG 1. We believe that the most reasonable stratification would be to divide the tumors into complete responders (TRG 4) and non-responders or partial responders (TRG 0 to 3). Since this was not possible due to unequal sample distribution, no further analysis was attempted.
3.2. Recurrence Rate, Disease-free Survival and Overall Survival
After a median follow-up of 59 months (mean: 58 ± 29.4 months, 95% confidence interval), eight patients developed recurrent disease (P11, P14, P17, P18, P20, P22, P26, and P28). One patient (P18) developed local recurrence (3.3%) associated with simultaneous peritoneal metastases (35 months after R0 resection of the primary tumor). While no patient died during application of preoperative CT/RT or within the first 30 days postoperatively, three patients (10%) died due to distant metastatic cancer progression at seven months (P11), 21 months (P18) and 57 months (P20) after tumor resection (Table 1). We therefore calculated a disease-free survival of 73% (22/30), and an overall survival of 90% (27/30; data not shown). Figures 2a and b show the Kaplan-Meier curves for DFS and OS, respectively, with T-level downsizing used as the surrogate endpoint for response. Response to CT/RT was significantly correlated with DFS (p=0.028), but not with OS (p=0.11). However, UICC-downstaging was not associated with DFS (p=0.11) or OS (p=0.29) (data not shown). Furthermore, TME quality assessment did not correlate with survival data (data not shown).
Fig. 2.
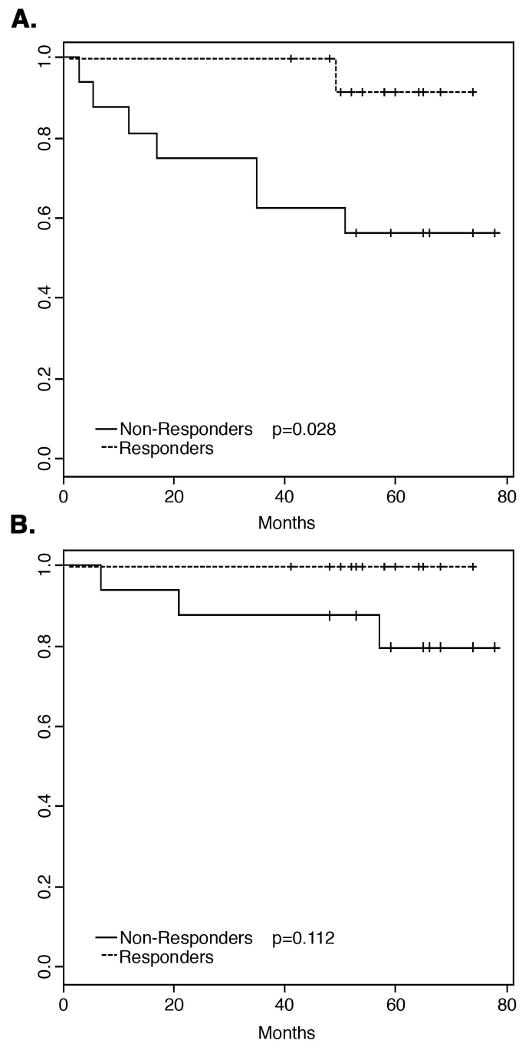
Survival data for all 30 patients treated with preoperative chemoradiotherapy. A: Responders as measured by T-level downsizing showed a significantly better disease-free survival (DFS) compared to non-responders (p=0.028). B: No statistically significant difference in overall survival (OS) was observed between responders and non-responders (p=0.11).
3.3 Comparison of Clinical Response and Recurrence
When we observed that seven out of eight patients who developed recurrent disease belonged to the non-responsive group, we interpreted this as strong indication that recurrence is intimately connected to the absence of T-level downsizing. To quantify this relationship, the right tailed Fisher's exact test was used to compute the probability of all patients with recurrence belonging to the non-response group if recurrence and response were independently distributed, i.e., not connected to each other. Because we observed a p-value of 0.030 for the null hypothesis that response and recurrence are not connected, it can be rejected. We therefore concluded that there is a positive correlation between response to CT/RT, defined as downsizing of the T-category, and recurrence.
3.4 Class Comparison Analysis
The Class Comparison analysis between recurrent and non-recurrent cancer samples revealed 20 genes that were differentially expressed at a p-value of <0.001 (Table 2). Interestingly, seven of these 20 genes were also present in the list of 54 genes that we identified to be differentially expressed between responsive and non-responsive tumors [25]. However, the probability of finding 20 genes by chance at this level of significance is high (p=0.079), which might be further complicated by the fact that the numbers of patients in the two groups (recurrence and non-recurrence) are unequal (Table 1).
Table 2.
List of 20 differentially expressed genes (P < 0.001) between recurrent and non-recurrent rectal adenocarcinomas. Asterisks (*) indicate those genes overlapping with the 54 gene-set.
| Parametric p-value | Geometric Mean of Ratios for Recurrence | Geometric Mean of Ratios for Non-Recurrence | Fold Difference of Geometric Means | Gene symbol | Description | Clone | UG cluster | Map |
|---|---|---|---|---|---|---|---|---|
| 4.96E-05 | 1.144 | 0.523 | 2.188 | KIAA0295 | KIAA0295 protein | IncytePD:3520727 | Hs.155979 | 15q22.1 |
| 7.44E-05 | 1.686 | 0.791 | 2.133 | ESTs | IncytePD:1398814 | Hs.355960 | 12 | |
| 8.69E-05 | 2.070 | 0.951 | 2.178 | ZFP106* | zinc finger protein 106 | IncytePD:2757735 | Hs.15220 | 15q14 |
| 0.0001145 | 1.215 | 0.451 | 2.693 | ELL2 | ELL-related RNA polymerase II, elongation factor | IncytePD:1281473 | Hs.98124 | 5q14.3 |
| 0.0001212 | 1.272 | 0.640 | 1.989 | KIAA0857 | KIAA0857 protein | IncytePD:3770939 | Hs.24557 | 2p13-p12 |
| 0.0001301 | 3.497 | 1.202 | 2.909 | ESTs | IncytePD:4003773 | Hs.131511 | 2 | |
| 0.0001412 | 2.208 | 1.035 | 2.132 | KTN1* | kinectin 1 (kinesin receptor) | IncytePD:3736760 | Hs.211577 | 14q22.1 |
| 0.0001665 | 3.817 | 1.112 | 3.431 | ITGA8 | integrin, alpha 8 | IncytePD:3085610 | Hs.91296 | 10p13 |
| 0.0001678 | 3.584 | 1.597 | 2.244 | AKAP13 | A kinase (PRKA) anchor protein 13 | IncytePD:1563055 | Hs.301946 | 15q24-q25 |
| 0.0001925 | 1.942 | 0.804 | 2.416 | DDX17 | DEAD/H box polypeptide 17 | IncytePD:1750553 | Hs.349121 | 22q13.1 |
| 0.0001981 | 1.529 | 0.664 | 2.303 | S164 (RED120)* | S164 protein | IncytePD:2047730 | Hs.180789 | 14q24.3 |
| 0.0003126 | 1.477 | 0.714 | 2.068 | CHD2 | chromodomain helicase DNA binding protein 2 | IncytePD:523797 | Hs.36787 | 15q26 |
| 0.0004637 | 1.456 | 0.585 | 2.488 | AP3D1* | adaptor-related protein complex 3, delta 1 subunit | IncytePD:1301192 | Hs.75056 | 19p13.3 |
| 0.0004843 | 2.198 | 1.159 | 1.897 | PAK1* | p21/Cdc42/Rac1-activated kinase 1 | IncytePD:2632434 | Hs.64056 | 11q13-q14 |
| 0.0006413 | 2.004 | 0.866 | 2.315 | Homo sapiens, clone IMAGE:3458340, mRNA | IncytePD:2208874 | Hs.405949 | 17 | |
| 0.0006743 | 3.333 | 1.739 | 1.917 | Homo sapiens cDNA FLJ10158 fis, clone HEMBA1003463 | IncytePD:3144018 | Hs.104627 | 3 | |
| 0.0007382 | 1.047 | 0.540 | 1.939 | MLL* | myeloid/lymphoid or mixed-lineage leukemia | IncytePD:1692195 | Hs.199160 | 11q23 |
| 0.000778 | 1.330 | 0.678 | 1.963 | PPP1R10* | protein phosphatase 1, regulatory subunit 10 | IncytePD:2314555 | Hs.106019 | 6p21.3 |
| 0.0008452 | 1.364 | 0.726 | 1.880 | ESTs | IncytePD:2382190 | |||
| 0.0009194 | 1.764 | 1.075 | 1.640 | ELF2 | E74-like factor 2 | IncytePD:2834326 | Hs.82143 | 4q28 |
3.5 Correlation of Gene Expression Signatures and Risk of Recurrence
We previously used cDNA microarrays to demonstrate that a set of 54 genes was differentially expressed between responsive and non-responsive rectal cancers (set 1, n=23). This was further validated for an independent set of tumor samples using oligonucleotide microarrays (set 2, n=7).
In the present investigation, for consistency, we only analyzed those 23 tumors that were hybridized to the cDNA microarrays. In this set data set, all six patients with recurrence belonged to the group of non-responders. When we displayed the molecular signature of these 54 genes in a Principal Component plot (Fig. 3), it became obvious that all recurrent tumors (P11, P14, P17, P18, P20, and P22; red) were positioned farther away from the responsive, non-recurrent tumors (P1-P9; blue) than from the non-responsive, non-recurrent tumors (P10, P12, P13, P15, P16, P19, P21, and P23; yellow). This demonstrated that recurrence only occurred in patients whose tumors were (correctly) classified to be the most distant from the boundary between responders and non-responder to preoperative chemoradiotherapy when response was measured as T-level downsizing.
Fig. 3.
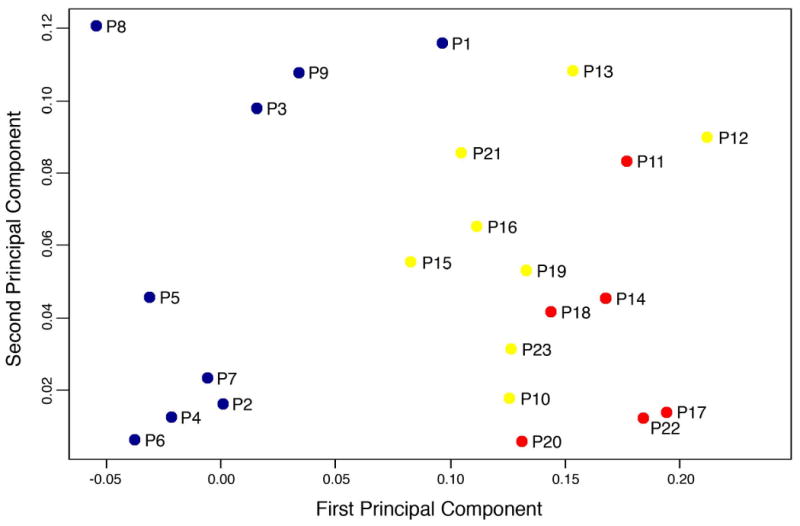
Principal Component plot of the 54 genes that were previously identified using cDNA microarrays to be differentially expressed between nine responsive and 14 non-responsive tumors. All responders, illustrated in blue (P1-P9), did not develop disease recurrence, while the red dots indicate those six non-responders who showed tumor recurrence (P11, P14, P17, P18, P20, and P22). The yellow dots display the remaining eight non-responders who did not develop metastatic disease (P10, P12, P13, P15, P16, P19, P21 and P23).
Discussion
The CAO/ARO/AIO-94 trial of the German Rectal Cancer Study Group demonstrated that preoperative 5-FU based CT/RT is superior to postoperative CT/RT in UICC stage II/III rectal cancer in terms of local control, and acute and long-term toxicity [22]. This study showed that the 5-year cumulative incidence of local cancer recurrence was 6% for patients randomly assigned to preoperative CT/RT, compared to 13% in the group of patients treated with postoperative CT/RT (p=0.006). Interestingly, the 5-year overall survival rates did not differ significantly. Furthermore, two recent phase III trials demonstrated that preoperative 5-FU based CT/RT is more effective than radiotherapy alone with respect to local control, but not in 3-years DFS and OS [34, 35]. Based on these studies, preoperative CT/RT is now considered standard of care in most countries in Europe and in large parts of the U.S. [23].
Recently, we demonstrated for a subset of the patients treated within the CAO/ARO/AIO-94 trial, that gene expression profiling might be useful for pre-therapeutic prediction of local response to preoperative CT/RT [25]. Fifty-four genes showed significantly different expression levels (p<0.001) between responders and non-responders (measured by T-level downsizing). However, there is considerable debate with respect to the most meaningful method for the assessment of tumor response. While response actually correlated with clinical outcome in the data set presented here, a recent investigation concluded that response to preoperative 5-FU based chemoradiotherapy does not linearly translate into improved survival [24].
In the present study, we therefore investigated whether the expression pattern of these 54 genes also correlated with clinical outcome (DSF and OS). This allowed an assessment of the relationship between gene expression signatures and survival data from patients treated within a phase-III clinical trial. We observed that T-level downsizing was significantly correlated with DFS (Fig. 2), because seven of eight patients with metastatic disease belonged to the group of non-responders (p=0.028). We therefore concluded that T-level downsizing actually represents a surrogate clinical endpoint that might allow response prediction for a subset of rectal cancer patients receiving preoperative 5-FU based CT/RT, followed by postoperative chemotherapy. However, T-level downsizing did not correlate with OS (p=0.11), which might be due to the low rate of cancer related deaths (10%) within the follow-up period of 59 months.
We then applied a Class Comparison analysis to identify genes that were differentially expressed between patients with recurrence and those without. For consistency, we only included data from those 23 tumors that were previously hybridized to cDNA arrays, since the 54-gene signature was derived from these samples. This analysis revealed 20 genes that were differentially expressed at a p-value of <0.001 (Table 2). However, the probability of finding 20 genes by chance at this level of significance is high (p=0.079). A plausible explanation for this discrepancy may be the uneven distribution of recurrent and non-recurrent patients (six versus 17 tumors, respectively).
Interestingly, seven genes of this “recurrence signature” overlap with our previously established “response signature”. The probably most interesting gene in the context of therapy resistance is PAK1, also known as p21/Cdc42/Rac1-activated kinase 1. PAK 1 represents a target for the small GTP binding proteins Cdc42 and Rac, and functions as regulator of cell motility, cell morphology and cell proliferation, and nuclear signaling. Recent data indicate that amplification of PAK1, which activates the estrogen receptor, is a predictor of recurrence and tamoxifen resistance in breast cancers [36, 37]. Furthermore, abrogation of PAK1 function restored sensitivity of renal cell cancer cells to chemotherapy [38]. The mixed lineage leukaemia (MLL) gene encodes a DNA-binding protein. It is involved in recurrent chromosomal translocations in acute leukaemias, and, interestingly, often predicts a poor prognosis [39]. A recent study identified specific miRNAs that were up-regulated as a consequence of this translocation [40].
A possible connection of most of the other genes to resistance of cancer cells to chemoradiotherapy and, subsequently, tumor recurrence, needs to be determined. ZFP106 encodes for the zinc finger protein 106, which has been shown to play a role in testis development [41]. Kinectin 1 represents an endoplasmic reticulum membrane protein. Interacting with other microtubule-associated proteins such as the ATPase Kinesin, it helps to move vesicles along the microtubules. Recent studies indicated that Kinectin might be involved in the regulation of protein synthesis [42, 43]. S164, also known as RED120, encodes for an SRm-interacting protein. It is supposed to bridge ribonucleoprotein complexes and represents a splicing coactivator [44]. The gene for delta 1 subunit of the adaptor-related protein complex 3, AP3D1, has been shown to be a key component required for transporting enveloped viral particles from the Golgi apparatus to the cell surface [45]. PPP1R10 represents a protein that regulates the protein phosphatase-1, which is involved in mitosis exit and chromosome decondensation [46].
In summary, these data suggest that the genetic basis of local response to preoperative CT/RT is not independent of the genetic basis of tumor recurrence. Our results therefore indicate that pre-therapeutic profiling may not only separate responders and non-responders, but also that the set of 54 genes might be representative of local response as well as an increased risk for recurrence.
We are very well aware of the fact that these preliminary results require validation in an independent and larger patient population [47]. Being integrated into a Clinical Research Unit entitled “Biological Basis of Individual Tumor Response in Patients with Rectal Cancer” (KFO 179), we have initiated prospective profiling of tumor samples from patients enrolled in the ongoing CAO/ARO/AIO-04 trial of the German Rectal Cancer Study Group, which compares standard preoperative 5-FU based CT/RT against an intensified protocol (5-FU + Oxaliplatin + radiation).
Acknowledgments
The authors would like to thank Ms. Jessica Eggert for excellent technical assistance, Buddy Chen for help with the illustrations, and Joseph Cheng for IT-support. We are grateful to the investigators of the CAO/ARO/AIO-94 and CAO/ARO/AIO-04 trial, in particular to Drs. Rolf Sauer and Claus Rödel.
Funding/Support: This research was in part supported by the Intramural Research Program of the NIH, National Cancer Institute, the Deutsche Forschungsgemeinschaft (KFO 179), and the Deutsche Krebshilfe (M.G.).
Footnotes
Publisher's Disclaimer: This is a PDF file of an unedited manuscript that has been accepted for publication. As a service to our customers we are providing this early version of the manuscript. The manuscript will undergo copyediting, typesetting, and review of the resulting proof before it is published in its final citable form. Please note that during the production process errors may be discovered which could affect the content, and all legal disclaimers that apply to the journal pertain.
References
- 1.Alon U, Barkai N, Notterman DA, et al. Broad patterns of gene expression revealed by clustering analysis of tumor and normal colon tissues probed by oligonucleotide arrays. Proc Natl Acad Sci U S A. 1999;96(12):6745–50. doi: 10.1073/pnas.96.12.6745. [DOI] [PMC free article] [PubMed] [Google Scholar]
- 2.Notterman DA, Alon U, Sierk AJ, Levine AJ. Transcriptional gene expression profiles of colorectal adenoma, adenocarcinoma, and normal tissue examined by oligonucleotide arrays. Cancer Res. 2001;61(7):3124–30. [PubMed] [Google Scholar]
- 3.Kitahara O, Furukawa Y, Tanaka T, et al. Alterations of gene expression during colorectal carcinogenesis revealed by cDNA microarrays after laser-capture microdissection of tumor tissues and normal epithelia. Cancer Res. 2001;61(9):3544–9. [PubMed] [Google Scholar]
- 4.Zou TT, Selaru FM, Xu Y, et al. Application of cDNA microarrays to generate a molecular taxonomy capable of distinguishing between colon cancer and normal colon. Oncogene. 2002;21(31):4855–62. doi: 10.1038/sj.onc.1205613. [DOI] [PubMed] [Google Scholar]
- 5.Lechner S, Muller-Ladner U, Renke B, Scholmerich J, Ruschoff J, Kullmann F. Gene expression pattern of laser microdissected colonic crypts of adenomas with low grade dysplasia. Gut. 2003;52(8):1148–53. doi: 10.1136/gut.52.8.1148. [DOI] [PMC free article] [PubMed] [Google Scholar]
- 6.Sugiyama Y, Farrow B, Murillo C, et al. Analysis of differential gene expression patterns in colon cancer and cancer stroma using microdissected tissues. Gastroenterology. 2005;128(2):480–6. doi: 10.1053/j.gastro.2004.11.010. [DOI] [PubMed] [Google Scholar]
- 7.Grade M, Ghadimi BM, Varma S, et al. Aneuploidy-dependent massive deregulation of the cellular transcriptome and apparent divergence of the Wnt/beta-catenin signaling pathway in human rectal carcinomas. Cancer Res. 2006;66(1):267–82. doi: 10.1158/0008-5472.CAN-05-2533. [DOI] [PMC free article] [PubMed] [Google Scholar]
- 8.Kwon HC, Kim SH, Roh MS, et al. Gene expression profiling in lymph node-positive and lymph node-negative colorectal cancer. Dis Colon Rectum. 2004;47(2):141–52. doi: 10.1007/s10350-003-0032-7. [DOI] [PubMed] [Google Scholar]
- 9.Koehler A, Bataille F, Schmid C, et al. Gene expression profiling of colorectal cancer and metastases divides tumours according to their clinicopathological stage. J Pathol. 2004;204(1):65–74. doi: 10.1002/path.1606. [DOI] [PubMed] [Google Scholar]
- 10.Croner RS, Peters A, Brueckl WM, et al. Microarray versus conventional prediction of lymph node metastasis in colorectal carcinoma. Cancer. 2005;104(2):395–404. doi: 10.1002/cncr.21170. [DOI] [PubMed] [Google Scholar]
- 11.D'Arrigo A, Belluco C, Ambrosi A, et al. Metastatic transcriptional pattern revealed by gene expression profiling in primary colorectal carcinoma. Int J Cancer. 2005;115(2):256–62. doi: 10.1002/ijc.20883. [DOI] [PubMed] [Google Scholar]
- 12.Grade M, Hormann P, Becker S, et al. Gene expression profiling reveals a massive, aneuploidy-dependent transcriptional deregulation and distinct differences between lymph node-negative and lymph node-positive colon carcinomas. Cancer Res. 2007;67(1):41–56. doi: 10.1158/0008-5472.CAN-06-1514. [DOI] [PMC free article] [PubMed] [Google Scholar]
- 13.Wang Y, Jatkoe T, Zhang Y, et al. Gene expression profiles and molecular markers to predict recurrence of Dukes' B colon cancer. J Clin Oncol. 2004;22(9):1564–71. doi: 10.1200/JCO.2004.08.186. [DOI] [PubMed] [Google Scholar]
- 14.Arango D, Laiho P, Kokko A, et al. Gene-expression profiling predicts recurrence in Dukes' C colorectal cancer. Gastroenterology. 2005;129(3):874–84. doi: 10.1053/j.gastro.2005.06.066. [DOI] [PubMed] [Google Scholar]
- 15.Eschrich S, Yang I, Bloom G, et al. Molecular staging for survival prediction of colorectal cancer patients. J Clin Oncol. 2005;23(15):3526–35. doi: 10.1200/JCO.2005.00.695. [DOI] [PubMed] [Google Scholar]
- 16.Barrier A, Boelle PY, Roser F, et al. Stage II colon cancer prognosis prediction by tumor gene expression profiling. J Clin Oncol. 2006;24(29):4685–91. doi: 10.1200/JCO.2005.05.0229. [DOI] [PubMed] [Google Scholar]
- 17.Barrier A, Roser F, Boelle PY, et al. Prognosis of stage II colon cancer by non-neoplastic mucosa gene expression profiling. Oncogene. 2007;26(18):2642–8. doi: 10.1038/sj.onc.1210060. [DOI] [PubMed] [Google Scholar]
- 18.Lin YH, Friederichs J, Black MA, et al. Multiple gene expression classifiers from different array platforms predict poor prognosis of colorectal cancer. Clin Cancer Res. 2007;13(2 Pt 1):498–507. doi: 10.1158/1078-0432.CCR-05-2734. [DOI] [PubMed] [Google Scholar]
- 19.Mariadason JM, Arango D, Shi Q, et al. Gene expression profiling-based prediction of response of colon carcinoma cells to 5-fluorouracil and camptothecin. Cancer Res. 2003;63(24):8791–812. [PubMed] [Google Scholar]
- 20.Del Rio M, Molina F, Bascoul-Mollevi C, et al. Gene expression signature in advanced colorectal cancer patients select drugs and response for the use of leucovorin, fluorouracil, and irinotecan. J Clin Oncol. 2007;25(7):773–80. doi: 10.1200/JCO.2006.07.4187. [DOI] [PMC free article] [PubMed] [Google Scholar]
- 21.Smith FM, Reynolds JV, Miller N, Stephens RB, Kennedy MJ. Pathological and molecular predictors of the response of rectal cancer to neoadjuvant radiochemotherapy. Eur J Surg Oncol. 2006;32(1):55–64. doi: 10.1016/j.ejso.2005.09.010. [DOI] [PubMed] [Google Scholar]
- 22.Sauer R, Becker H, Hohenberger W, et al. Preoperative versus postoperative chemoradiotherapy for rectal cancer. N Engl J Med. 2004;351(17):1731–40. doi: 10.1056/NEJMoa040694. [DOI] [PubMed] [Google Scholar]
- 23.Kachnic LA. Should preoperative or postoperative therapy be administered in the management of rectal cancer? Semin Oncol. 2006;33(6 Suppl 11):S64–9. doi: 10.1053/j.seminoncol.2006.10.018. [DOI] [PubMed] [Google Scholar]
- 24.Rödel C, Martus P, Papadoupolos T, et al. Prognostic significance of tumor regression after preoperative chemoradiotherapy for rectal cancer. J Clin Oncol. 2005;23(34):8688–96. doi: 10.1200/JCO.2005.02.1329. [DOI] [PubMed] [Google Scholar]
- 25.Ghadimi BM, Grade M, Difilippantonio MJ, et al. Effectiveness of gene expression profiling for response prediction of rectal adenocarcinomas to preoperative chemoradiotherapy. J Clin Oncol. 2005;23(9):1826–38. doi: 10.1200/JCO.2005.00.406. [DOI] [PMC free article] [PubMed] [Google Scholar]
- 26.Heald RJ, Ryall RD. Recurrence and survival after total mesorectal excision for rectal cancer. Lancet. 1986;1(8496):1479–82. doi: 10.1016/s0140-6736(86)91510-2. [DOI] [PubMed] [Google Scholar]
- 27.Sobin LH, Wittekind C. UICC: TNM classification of malignant tumors. 5. New York: John Wiley & Sons; 1997. [Google Scholar]
- 28.Quirke P, Durdey P, Dixon MF, Williams NS. Local recurrence of rectal adenocarcinoma due to inadequate surgical resection. Histopathological study of lateral tumour spread and surgical excision. Lancet. 1986;2(8514):996–9. doi: 10.1016/s0140-6736(86)92612-7. [DOI] [PubMed] [Google Scholar]
- 29.Quirke P, Dixon MF. The prediction of local recurrence in rectal adenocarcinoma by histopathological examination. Int J Colorectal Dis. 1988;3(2):127–31. doi: 10.1007/BF01645318. [DOI] [PubMed] [Google Scholar]
- 30.Liersch T, Langer C, Jakob C, et al. Preoperative diagnostic procedures in locally advanced rectal carcinoma (> or =T3 or N+). What does endoluminal ultrasound achieve at staging and restaging (after neoadjuvant radiochemotherapy) in contrast to computed tomography? Chirurg. 2003;74(3):224–34. doi: 10.1007/s00104-002-0609-z. [DOI] [PubMed] [Google Scholar]
- 31.Liersch T, Langer C, Ghadimi BM, et al. Lymph node status and TS gene expression are prognostic markers in stage II/III rectal cancer after neoadjuvant fluorouracil-based chemoradiotherapy. J Clin Oncol. 2006;24(25):4062–8. doi: 10.1200/JCO.2005.04.2739. [DOI] [PubMed] [Google Scholar]
- 32.Simon R, Peng A. BRB ArrayTools v. 3.5.0 ed. Bethesda: National Cancer Institute; 2007. [Google Scholar]
- 33.Wright GW, Simon RM. A random variance model for detection of differential gene expression in small microarray experiments. Bioinformatics. 2003;19(18):2448–55. doi: 10.1093/bioinformatics/btg345. [DOI] [PubMed] [Google Scholar]
- 34.Bosset JF, Collette L, Calais G, et al. Chemotherapy with preoperative radiotherapy in rectal cancer. N Engl J Med. 2006;355(11):1114–23. doi: 10.1056/NEJMoa060829. [DOI] [PubMed] [Google Scholar]
- 35.Gerard JP, Conroy T, Bonnetain F, et al. Preoperative radiotherapy with or without concurrent fluorouracil and leucovorin in T3-4 rectal cancers: results of FFCD 9203. J Clin Oncol. 2006;24(28):4620–5. doi: 10.1200/JCO.2006.06.7629. [DOI] [PubMed] [Google Scholar]
- 36.Rayala SK, Kumar R. Sliding p21-activated kinase 1 to nucleus impacts tamoxifen sensitivity. Biomed Pharmacother. 2007;61(7):408–11. doi: 10.1016/j.biopha.2007.05.006. [DOI] [PubMed] [Google Scholar]
- 37.Bostner J, Ahnstrom Waltersson M, Fornander T, Skoog L, Nordenskjold B, Stal O. Amplification of CCND1 and PAK1 as predictors of recurrence and tamoxifen resistance in postmenopausal breast cancer. Oncogene. 2007;26(49):6997–7005. doi: 10.1038/sj.onc.1210506. [DOI] [PubMed] [Google Scholar]
- 38.O'Sullivan GC, Tangney M, Casey G, Ambrose M, Houston A, Barry OP. Modulation of p21-activated kinase 1 alters the behavior of renal cell carcinoma. Int J Cancer. 2007;121(9):1930–40. doi: 10.1002/ijc.22893. [DOI] [PubMed] [Google Scholar]
- 39.Krivtsov AV, Armstrong SA. MLL translocations, histone modifications and leukaemia stem-cell development. Nat Rev Cancer. 2007;7(11):823–33. doi: 10.1038/nrc2253. [DOI] [PubMed] [Google Scholar]
- 40.Nakamura T, Canaani E, Croce CM. Oncogenic All1 fusion proteins target Drosha-mediated microRNA processing. Proc Natl Acad Sci U S A. 2007;104(26):10980–5. doi: 10.1073/pnas.0704559104. [DOI] [PMC free article] [PubMed] [Google Scholar]
- 41.Grasberger H, Bell GI. Subcellular recruitment by TSG118 and TSPYL implicates a role for zinc finger protein 106 in a novel developmental pathway. Int J Biochem Cell Biol. 2005;37(7):1421–37. doi: 10.1016/j.biocel.2005.01.013. [DOI] [PubMed] [Google Scholar]
- 42.Ong LL, Er CP, Ho A, Aung MT, Yu H. Kinectin anchors the translation elongation factor-1 delta to the endoplasmic reticulum. J Biol Chem. 2003;278(34):32115–23. doi: 10.1074/jbc.M210917200. [DOI] [PubMed] [Google Scholar]
- 43.Ong LL, Lin PC, Zhang X, Chia SM, Yu H. Kinectin-dependent assembly of translation elongation factor-1 complex on endoplasmic reticulum regulates protein synthesis. J Biol Chem. 2006;281(44):33621–34. doi: 10.1074/jbc.M607555200. [DOI] [PubMed] [Google Scholar]
- 44.Fortes P, Longman D, McCracken S, et al. Identification and characterization of RED120: a conserved PWI domain protein with links to splicing and 3′-end formation. FEBS Lett. 2007;581(16):3087–97. doi: 10.1016/j.febslet.2007.05.066. [DOI] [PubMed] [Google Scholar]
- 45.Nishimura N, Plutner H, Hahn K, Balch WE. The delta subunit of AP-3 is required for efficient transport of VSV-G from the trans-Golgi network to the cell surface. Proc Natl Acad Sci U S A. 2002;99(10):6755–60. doi: 10.1073/pnas.092150699. [DOI] [PMC free article] [PubMed] [Google Scholar]
- 46.Kim YM, Watanabe T, Allen PB, et al. PNUTS, a protein phosphatase 1 (PP1) nuclear targeting subunit. Characterization of its PP1- and RNA-binding domains and regulation by phosphorylation. J Biol Chem. 2003;278(16):13819–28. doi: 10.1074/jbc.M209621200. [DOI] [PubMed] [Google Scholar]
- 47.Simon R. New challenges for 21st century clinical trials. Clin Trials. 2007;4(2):167–9. 73–7. doi: 10.1177/1740774507076800. discussion. [DOI] [PubMed] [Google Scholar]