

Abstract
Magnetic Resonance (MR)- based volume measurements of atrophy are potential markers of disease progression in patients with amnestic mild cognitive impairment (aMCI) and Alzheimer’s disease (AD). Longitudinal changes in 1H MR spectroscopy (1H MRS) metabolite markers have not been characterized in aMCI subjects. Our objective was to determine the longitudinal 1H MRS metabolite changes in patients with aMCI, and AD, and to compare 1H MRS metabolite ratios and ventricular volumes in tracking clinical disease progression in AD. The neuronal integrity marker N-acetylaspartate/Creatine ratio declined in aMCI and AD patients compared to cognitively normal elderly. The changein 1H MRS metabolite ratios correlated with clinical progression about as strongly as the rate of ventricular expansion, suggesting that 1H MRS metabolite ratios may be useful markers for the progression of AD. Choline/Creatine ratio declined in stable aMCI, compared to converter aMCI patients and cognitively normal elderly, which may be related to a compensatory mechanism in aMCI patients who did not to progress to AD.
Keywords: 1H MR spectroscopy, 1H MRS, imaging, Alzheimer’s disease, mild cognitive impairment, serial, longitudinal, N-acetylaspartate, choline
1. Introduction
Current standards for assessing the progression of Alzheimer’s disease (AD) are clinical and neuropsychological measures. The search for potential disease-modifying treatments however, has created a need for non-invasive markers that can measure the therapeutic effectiveness on biological disease progression. Disease-modifying treatments will be most beneficial for patients who are at the earliest stages of the neurodegenerative process. An important clinically characterized group for early diagnosis and treatment of AD is people with amnestic mild cognitive impairment (aMCI). Because a majority of people with aMCI progress to AD in the future [39], aMCI is an appropriate clinical group for evaluating neuroimaging markers of early AD pathology.
The most widely investigated neuroimaging technique for tracking disease progression in aMCI and AD is MR-based volume measurements of the brain [19]. The longitudinal change in MR- based regional (hippocampal and entorhinal cortex) and global (whole brain and ventricles) brain volumes correlate with the clinical disease progression in AD starting from the preclinical stages [16]. Regional decline in brain glucose metabolism on [33]fluorodeoxyglucose (FDG) PET also correlates with the disease progression in AD [2,45]. Both MR-based volume measurements and FDG PET are being evaluated as imaging markers for disease progression in aMCI and AD in a multi-center project supported by the National Institutes of Health [35]. On the other hand, longitudinal changes in 1H MR spectroscopy (1H MRS), a technique that is sensitive to biologically relevant chemical changes in the brain, has received minimal evaluation in AD.
The neuronal integrity marker N-acetylaspartartate (NAA) and NAA/creatine (Cr) levels on 1H MRS are lower in AD compared to normal elderly subjects [46], and decreased NAA/Cr levels predict future conversion to AD in aMCI [6,30,34]. Furthermore, decreased NAA levels in other neurological disorders such as epilepsy [15], head trauma [3], and multiple sclerosis [25,36] may recover after successful treatment. The responsiveness of NAA to improved neuron “health” suggests similar measures of NAA as a potential surrogate for therapeutic efficacy in aMCI and AD. There are few longitudinal 1H MRS studies in AD that have measured the longitudinal change in NAA levels [1,10,17]. One 1H MRS imaging study showed that NAA declines in the cortical grey matter of people with AD with respect to normal [1], and another single voxel 1H MRS study showed that the decline in NAA/Cr correlates with the decline in Mini-Mental state examination (MMSE) scores in the medial temporal lobe [17]. Cross-sectional studies indicate an elevation in the choline (Cho)/Cr and myoinositol (mI)/Cr ratio in AD [46]. We previously showed that Cho/Cr and mI/Cr levels are also elevated in a paralimbic cortical region, the posterior cingulate gyri in aMCI [20]. Although serial MRS studies did not identify any longitudinal change in Cho, mI,, Cho/Cr or mI/Cr, levels in people with AD [1,10,18], Cho/Cr levels decreased with cholinergic agonist treatment in AD with respect to the placebo [44]. To our knowledge, no serial 1H MRS study has been published in aMCI.
The objectives of this study were; 1) to test the hypothesis that the annual change in 1H MRS metabolite ratios in people with aMCI and AD is greater than cognitively stable elderly, 2) to test the hypothesis that the annual change in 1H MRS metabolite ratios correlate with the decline in cognitive function in aMCI and AD, 3) to compare 1H MRS metabolite ratios, and ventricular volumes in tracking cognitive decline in people with aMCI, and AD.
2. Methods
2.1. Subjects
We identified 88 cognitively normal elderly subjects, 49 patients with aMCI, and 60 patients with AD from the AD Research Center (ADRC)/AD Patient Registry (ADPR) at the Mayo Clinic Rochester [40], who participated in a longitudinal-serial MRI/1H MRS study during September 1998- March 2004. This study was approved by the Mayo Institutional Review Board, and informed consent for participation was obtained from every subject and/or an appropriate surrogate. Individuals participating in the ADRC/ADPR studies undergo approximately annual clinical examinations, structural brain MRI/1H MRS and routine laboratory tests, and a battery of neuropsychological tests. For inclusion in this study, subjects had to be diagnosed as either cognitively normal, aMCI, or AD at baseline and during follow-up. Subjects with structural abnormalities that could produce dementia, such as cortical infarction, tumor, subdural hematoma, or who had treatments or concurrent illnesses interfering with cognitive function other than AD either at baseline or during follow-up were not included in this study. Subjects were not excluded for the presence of leukoaraiosis.
The diagnosis of probable AD was made according to the Diagnostic and Statistical Manual for Mental Disorders 3rd edition revised (DSM-III-R) [28] criteria for dementia, and the National Institute of Neurological and Communicative Disorders and Stroke/Alzheimer’s Disease and Related Disorder’s Association (NINCDS/ADRDA) [29] criteria for AD. The operational definition of aMCI was clinical. People with aMCI met the following criteria [39]: 1) memory complaint preferably corroborated by an informant, 2) objective memory impairment, 3) normal general cognitive function, 4) intact activities of daily living, and 5) not demented. Cognitively normal elderly were independently functioning community dwellers with no neurological or major psychiatric conditions. Clinical group membership determined at baseline and after follow-up created five clinical groups: controls, control-converters to aMCI or AD, aMCI-stables, aMCI-converters to AD, and AD. Only three of the controls progressed to aMCI during follow-up; we excluded these subjects from the statistical analysis because of limited number.
2.2. MRI and 1H MRS
All subjects underwent MRI and 1H MRS studies within 110 days of the clinical evaluation. MRI and single voxel (SV) 1H MRS studies were performed on a 1.5 T (Signa; General Electric Medical Systems, Milwaukee, WI) scanner. Volume measurements were derived from a T1 weighted three-dimensional volumetric spoiled gradient-recalled echo sequence with 124 continuous partitions, 1.6 mm slice thickness, a 22× 16.5 cm. field of view, 192 views, and 25° flip angle. T1 weighted images in sagittal plane were obtained for localizing the 1H MRS voxel.
1H MRS studies were performed with the automated single voxel MRS package: Proton Brain Examination/Single Voxel (PROBE/SV) [48]. Point resolved spectroscopy (PRESS) pulse sequence with TR = 2000 ms, TE = 30 ms, 2048 data points and 128 excitations were used for the examinations. An 8 cm3 (2×2×2cm) voxel, prescribed on a mid-sagittal T1 weighted image, included right and left posterior cingulate gyri and inferior precunei (Figure 1). The anterior border of splenium, the superior border of corpus callosum and the cingulate sulcus were the anatomical landmarks to define the anterior inferior and the anterior superior border of the 8 cm3 voxel. The prescan algorithm of PROBE automatically adjusts the transmitter and receiver gains and center frequency. The local magnetic field homogeneity is optimized with the three-plane auto-shim procedure, and the flip angle of the third water suppression pulse is adjusted for chemical-shift-water suppression (CHESS) prior to PRESS acquisition. We analyzed the metabolite intensity ratios, which were automatically calculated at the end of each PROBE/SV acquisition, using creatine (Cr) as an internal reference metabolite [48].
Figure 1.
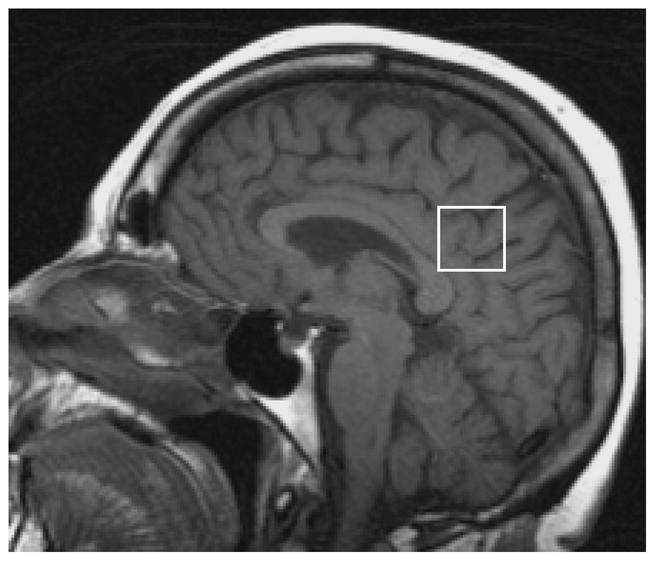
The 1H MRS voxel included right and left posterior cingulate gyri and inferior precunei. The superior border of corpus callosum and the cingulate sulcus were the anatomical landmarks to define the anterior inferior and the anterior superior border of the 8 cm3 voxel.
Rates of change in ventricles were determined using a home built software algorithm, described in detail else-where [14]. Inputs for this algorithm are two or more three-dimensional volumetric MRI scans obtained at different times. The algorithm begins with a series of data processing steps including extracting the brain from the overlying skull and scalp, creating binary masks of brain and ventricle, correcting brain B1 field nonuniformity, spatial alignment of the two image volumes, scaling correction, and intensity normalization. The processed brain volumes are then entered into a module that computes change in ventricular volume from baseline to follow-up MRI exam. Volume change was determined at the brain-CSF interface over the entire three-dimensional surface of the registered brain volumes. Computation of volume change is conceptually very similar to the boundary shift integral method of Freebrough and Fox [13].
Leukoaraiosis was rated using a previously validated four point scale (0–3; 0= no leukoaraiosis, 3= extensive leukoaraiosis) [47]. We rated periventricular white matter and basal ganglia leukoaraiosis separately on fluid attenuated inversion recovery (FLAIR) images, acquired as part of the MRI exam at baseline. The radiologist (KK) who rated leukoaraiosis was blinded to the clinical diagnosis.
2.3. Correlations with cognitive function
We tested for correlations between the change in volumetric and 1H MRS metabolite measurements with the change in global measurements of cognitive function. We chose to analyze the change in Mini Mental State Examination (MMSE) because it is widely used in the field. We also chose Dementia Rating Scale (DRS) as a measure of general cognitive function because DRS is less susceptible to ceiling effects in normal elderly than MMSE. As a third measure, we chose to study the correlations with the change in Clinical Dementia Rating Sum of Boxes (CDR), designed to stage dementia severity in aMCI and AD groups only.
2.4. Statistical Analysis
Our statistical analysis consisted of (1) pairwise clinical group comparisons of baseline and serial change in MR measures, (2) evaluating the rank correlation between changes in cognitive scores and changes in MR measurements within clinical groups, and (3) comparing the magnitudes of the observed correlations. Because the inter-scan duration varied by subject, the change in MR measures was analyzed as annual percent change using the formula [100 × (MR measure on the second exam − MR measure on the first exam)/MR measure on the first exam]/follow-up length in years. The change in MMSE, DRS, and CDR test scores was analyzed as annual change using the formula (score on the second exam −score on the first exam)/follow-up length in years.
To evaluate whether clinical groups were balanced on baseline characteristics, we examined differences in mean age, education and leukoaraiosis ratings across the control, aMCI, and AD groups using ANOVA. Group differences in gender, APOE ε4 carrier status, and rates of treatment with cholinesterase inhibitors were evaluated with chi-squared tests.
Each of these baseline characteristics was also tested for an association with the MR measures. This was done in order to assess whether it was necessary to control for the baseline characteristic in our pairwise group comparisons. Using linear regression models, only age was found to be strongly associated with baseline and longitudinal change in MR measures. Therefore we did not find it necessary to adjust for other baseline covariates once age was included in the models. Pairwise analyses were performed using a linear regression model including only subjects from the two groups being compared and having the MR measure as the response and group and age as the predictors.
The correlation between the annual percent change in MR measurements and annual change in clinical test scores was estimated with Spearman’s rank correlation due to skewness in the test scores. When the annual percent change in two imaging measures correlated significantly with the annual change in a clinical test score, we compared the strengths of the two dependent correlations with Choi’s test [8]. This test compares the strength of the correlation between the annual change in a clinical measure (eg. DRS) and annual percent change in an MR measure (eg. NAA/Cr) versus the correlation between the annual change in the same clinical measure (eg. DRS) and annual percent change in a different MR measure (eg. ventricular volume). When one correlation estimate was positive and another negative, we changed the sign of one measure so that the estimates had the same sign; this is equivalent to testing whether the correlations were equal in absolute value.
Because each hypothesis test addresses a distinct, albeit related, clinical question of interest, we do not adjust reported P values for multiple comparisons [37,38]. All statistical analyses were performed using R version 2.2.1 [42].
3. Results
Eighteen of the patients with aMCI progressed to AD during follow-up. Demographic aspects, baseline 1H MRS metabolite ratios, DRS, CDR and MMSE scores of the study group are listed in table 1. The median follow-up period between the first and the second MRI/1H MRS exam was 13 months (range 9–45 months). Controls were followed longer than all other clinical groups. The control, aMCI, and AD groups were all similar in terms of gender distribution, average age, average years of education, and with respect to periventricular white matter and basal ganglia leukoaraiosis ratings (p>0.30, ANOVA). During the course of follow-up, a greater proportion of aMCI-converter (44%) and AD subjects (75%) were taking cholinesterase inhibitors than aMCI-stables (19%) (p<0.001, chi-square test). There were fewer APOE ε4 carriers in the control group than all other clinical groups and also fewer APOE ε4 carriers in the aMCI-stable group than the aMCI-converter group (p<0.001, chi-square test). After adjusting for age and group, we did not find evidence of an association between change in metabolite ratios and inter-scan duration, APOE status, treatment with acetecholinesterase inhibitors (excluding controls), or periventricular white matter leukoaraiosis ratings.
Table 1.
Demographic aspects, MMSE, DRS, CDR scores, and 1H MRS metabolite ratios at baseline*
| Control | All aMCI | aMCI-stable | aMCI-converter | AD | |
|---|---|---|---|---|---|
| N | 85 | 49 | 31 | 18 | 60 |
| Age mean (SD) | 79.1 (7.2) | 78.0 (8.5) | 77.5 (9.2) | 78.9 (7.1) | 77.1 (7.2) |
| N Females (percent) | 47 (55) | 27 (55) | 15 (48) | 12 (67) | 33 (55) |
| Education mean (SD) years | 13.9 (2.6) | 13.7 (3.4) | 13.9 (3.4) | 13.3 (3.5) | 14.2 (2.6) |
| AChE-I therapy +/− (%+) | 0/85 (0) | 14/35 (29) | 6/25 (19)† | 8/10 (44) | 45/15 (75) |
| APOE, ε4 carrier/noncarrier (% carrier)‡ | 15/69 (18) | 25/24 (51) | 13/18 (42) | 12/6 (67) | 36/24 (60) |
| Periventricular leukoaraiosis rating mean (SD) | 1.29 (0.81) | 1.37 (0.91) | 1.39 (0.95) | 1.33 (0.84) | 1.38 (0.83) |
| Basal Ganglia leukoaraiosis rating mean (SD) | 0.40 (0.83) | 0.65 (0.93) | 0.65 (0.91) | 0.67 (0.97) | 0.50 (0.85) |
| Time between two MRS Median (IQR) years | 1.5 (1.1, 2.0)§ | 1.0 (1.0, 1.2) | 1.0 (1.0, 1.1) | 1.0 (1.0, 1.5) | 1.0 (1.0, 1.1) |
| NAA/Cr Mean (SD) | 1.53 (0.11) | 1.49 (0.09)|| | 1.48 (0.10) | 1.50 (0.08) | 1.43 (0.10)|| |
| Cho/Cr Mean (SD) | 0.61 (0.08) | 0.67 (0.06)|| | 0.67 (0.07) | 0.67 (0.04) | 0.68 (0.07)|| |
| mI/Cr Mean (SD) | 0.63 (0.07) | 0.69 (0.07)|| | 0.69 (0.06) | 0.69 (0.09) | 0.72 (0.07)|| |
| MMSE Median (IQR) | 29 (28,30) | 27 (25,29) | 27 (26,29) | 26 (25,28) | 23 (21,25) |
| DRS Median (IQR) | 140 (137, 141) | 129 (125, 135) | 134 (127, 135) | 126 (120, 129) | 117 (107, 124) |
| CDR Median (IQR) | 0.0 (0.0, 0.0) | 1.0 (1.0, 2.0) | 1.0 (1.0, 1.2) | 1.5 (1.0, 2.4) | 4 (3.5, 5.5) |
Variables that were normally distributed are presented as mean (standard deviation (SD)), variables that were not normally distributed are presented as median (interquartile range (IQR)). APC: annual percent change, IQR: interquartile range, MMSE: Mini Mental State Examination, DRS: Dementia Rating Scale, CDR: Clinical Dementia Rating Sum of Boxes, aMCI: amnestic mild cognitive impairment, AD: Alzheimer’s Disease.
1H MRS metabolite ratios at baseline are reported at the mean age of 78 yrs.
During follow-up, more aMCI-converter and AD subjects were taking acetylcholine esterase (AChE-I) inhibitors than aMCI-stables.
Subjects with a genotype of ε3/4 and ε2/4 were grouped as ε4 carriers and subjects with ε2/3 and ε3/3 are grouped as noncarriers. There were more APOE, ε4 carriers in the patient groups than controls (p<0.001 Chi-square test)
Controls were followed longer than all other clinical groups (p<0.05)
Baseline 1H MRS metabolite values were different from controls (p<0.05)
1H MRS acquisitions from the posterior cingulate voxel were successful for the quantification of NAA/Cr ratio in all subjects. The automated spectroscopy quantification algorithm (PROBE-Quant) failed to quantify mI/Cr in six control and one aMCI-stable subject, and failed to quantify Cho/Cr in one aMCI-stable, one aMCI-converter and one AD subject because of poor quality.
In patients with aMCI, after adjusting for age, baseline NAA/Cr ratios were lower (p=0.024), and Cho/Cr and mI/Cr ratios were higher than controls (p<0.001). Similarly, in patients with AD, baseline NAA/Cr ratios were lower, Cho/Cr and mI/Cr ratios were higher than controls (each p<0.001). There were no baseline 1H MRS differences between aMCI-stable and aMCI-converter clinical groups (p>0.3 for each measurement).
Table 2 and 3 lists the results of the pair-wise between-group comparisons of annual percent change in imaging measures adjusted for age. In patients with aMCI (all) and AD, the decline in NAA/Cr ratio and the expansion in ventricular volumes were greater than controls. The Cho/Cr ratio declined in aMCI-stables compared to controls, and to aMCI-converters. The annual percent change in mI/Cr ratios were not different between the clinical groups. Compared to controls, ventricular expansion was greater in aMCI-converter and AD groups (Figure 2).
Table 2.
Annualized rates of change in measures of cognitive function, 1H MRS metabolite ratios*, and ventricular volume*
| Control | All aMCI | aMCI-stable | aMCI-converter | AD | |
|---|---|---|---|---|---|
| N | 85 | 49 | 31 | 18 | 60 |
| NAA/Cr APC Mean (SD) | 0.5 (4.3) | −1.4 (6.1) | −1.1 (5.5) | −2.0 (7.3) | −1.8 (7.0) |
| Cho/Cr APC Mean (SD) | 2.6 (8.0) | −1.3 (10.9) | −3.7 (10.6) | 2.8 (10.7) | 1.2 (9.8) |
| mI/Cr APC Mean (SD) | 1.9 (8.0) | 0.7 (10.0) | 0.0 (10.2) | 2.6 (8.7) | 0.8 (7.7) |
| Ventricular volume APC Mean (SD) | 2.4 (1.9) | 3.5 (2.8) | 2.8 (2.8) | 4.8 (2.5) | 5.8 (3.5) |
| MMSE annualized change Median (IQR) | 0.0 (−0.7, 0.7) | −1.0 (−1.5, 0.0) | 0.0 (−1.0, 0.0) | −1.8 (−3.0, −1.1) | −2.2 (−4.8, 0.0) |
| DRS annualized change Median (IQR) | 0.6 (−0.8, 1.9) | −1.0 (−3.0, 1.5) | −1.0 (−2.6, 2.0) | −1.3 (−7.3, 0.7) | −6.1 (−13.8, −1.9) |
| CDR annualized change Median (IQR) | 0.00 (0.0, 0.0) | 0.4 (0.0, 1.8) | 0.0 (0.0, 0.4) | 2.2 (1.5, 3.0) | 1.6 (0.0, 3.6) |
APC: annual percent change, IQR: inter-quartile range, MMSE: Mini Mental State Examination, DRS: Dementia Rating Scale, CDR: Clinical Dementia Rating Sum of Boxes, aMCI: amnestic mild cognitive impairment, AD: Alzheimer’s Disease
Annualized rates of change in 1H MRS metabolite ratios and ventricular volume reported at a mean age of 78 yrs.
Table 3.
P values for pair wise between group comparisons of annualized rate of change in MR measurements after adjusting for age.
| Control vs. All aMCI | Control vs. aMCI-stable | Control vs. aMCI-converter | Control vs. AD | aMCI-stable vs. aMCI-converter | |
|---|---|---|---|---|---|
| NAA/Cr APC | 0.035 | 0.10 | 0.056 | 0.017 | 0.61 |
| Cho/Cr APC | 0.018 | <0.001 | 0.95 | 0.36 | 0.049 |
| mI/Cr APC | 0.41 | 0.30 | 0.95 | 0.43 | 0.48 |
| Ventricular volume APC | 0.0047 | 0.34 | <0.001 | <0.001 | 0.014 |
APC: annual percent change, aMCI: amnestic mild cognitive impairment, AD: Alzheimer’s Disease
Figure 2.

Boxplots of annual percent change (APC) in NAA/Cr, Cho/Cr, mI/Cr, and ventricular volume by group. The boxes show the median and inter-quartile range with the observed mean change indicated by a triangle. The widths of the boxes are related to sample size.
The annual percent change in NAA/Cr ratios was positively associated with the annual change in DRS and negatively associated with annual change in CDR scores in patients with AD. The annual percent elevation in Cho/Cr ratios was negatively associated with the annual change in DRS among controls and annual change in MMSE in AD. There was no correlation between the annual percent change in NAA/Cr ratios and the annual change in MMSE scores in AD subjects. The annual percent expansion in ventricular size correlated with DRS in aMCI subjects, and with DRS, CDR, and MMSE in AD subjects (Table 4).
Table 4.
Spearman rank correlations between clinical and imaging measures in controls, aMCI, and AD clinical groups.
| Control | aMCI | AD | |||||
|---|---|---|---|---|---|---|---|
| Correlation coefficient | P | Correlation coefficient | P | Correlation coefficient | P | ||
| NAA/Cr APC | DRS | −0.11 | 0.35 | −0.04 | 0.80 | 0.39 | 0.0042 |
| CDR | NA | NA | 0.08 | 0.57 | −0.30 | 0.018 | |
| MMSE | −0.05 | 0.64 | 0.08 | 0.61 | −0.16 | 0.25 | |
| Cho/Cr APC | DRS | −0.22 | 0.047 | 0.04 | 0.82 | −0.08 | 0.57 |
| CDR | NA | NA | 0.27 | 0.065 | 0.01 | 0.96 | |
| MMSE | 0.02 | 0.89 | −0.13 | 0.38 | −0.32 | 0.021 | |
| Ventricle APC | DRS | −0.19 | 0.10 | −0.34 | 0.025 | −0.34 | 0.014 |
| CDR | NA | NA | 0.26 | 0.073 | 0.39 | 0.0021 | |
| MMSE | −0.18 | 0.11 | −0.17 | 0.24 | −0.32 | 0.019 | |
NA: Not applicable, APC: annual percent change, MMSE: Mini Mental State Examination, DRS: Dementia Rating Scale, CDR: Clinical Dementia Rating Sum of Boxes, aMCI: amnestic mild cognitive impairment, AD: Alzheimer’s Disease. Bold fonts indicate p<0.05.
Because both the annual percent change in NAA/Cr and ventricular volume correlated with the annual change in DRS and CDR, and the annual percent change in Cho/Cr and ventricular volume correlated with the annual change in MMSE in AD, we used Choi’s test to determine which MR measure correlates more strongly with the change in clinical measures. We did not find evidence that any of the cognitive measures were significantly more strongly correlated with one MR measure than another (p>0.50).
4. Discussion
This serial 1H MRS study has three major findings: First, Cho/Cr ratios decline more in stable aMCIs, compared to converter aMCIs and cognitively normal elderly. Second, NAA/Cr ratios decline more in people with aMCI and AD, compared to cognitively normal elderly. Third, the changein 1H MRS metabolite ratios correlate with clinical progression of AD about as strongly as the rate of ventricular expansion.
4.1. 1H MRS Metabolite Ratios at Baseline
Baseline posterior cingulate Cho/Cr levels were elevated in aMCI-stable, aMCI-converter, and AD subjects, which is in agreement with previous cross-sectional studies showing elevated Cho/Cr levels in AD [46], and intermediate Cho/Cr levels between controls and AD in aMCI [20] [24]. Baseline posterior cingulate NAA/Cr levels were lower than normal in both aMCI and AD subjects. In an earlier study, we observed that NAA/Cr levels in people with MCI are on average positioned between normal subjects and AD patients [20,21,24]. With a larger group of aMCI and control subjects in this study, the trend we previously observed was statistically significant, which is in agreement with two other recent studies [5] [6]. Normal appearing white matter NAA/Cr is negatively associated with the volume of white matter hyperintensities in elderly subjects [12]. However, we did not find an association between the leukoaraiosis ratings and metabolite ratios in the predominantly gray matter posterior cingulate voxel after accounting for age.
4.2. Longitudinal Change in Cho/Cr Ratios
The largest amount of choline in the brain is in the choline bound membrane phospholipids. Free choline and acetylcholine have very low abundance in brain tissue, and do not contribute detectably to NMR signal [26]. Therefore the Cho peak in the 1H MRS spectra of the brain is thought to be composed of cytosolic glycerolphosphocholine and phosphocholine, which are the products of membrane phosphotidylcholine breakdown, and precursors of choline and acetylcholine synthesis. One possible explanation for the elevation of Cho in cross-sectional MRS studies of AD is increased membrane turnover due to neuronal degeneration. It has also been postulated that the elevation of Cho peak is the consequence of membrane phosphotidylcholine catabolism in order to provide free choline for the deficient acetylcholine production in AD [27,49]. Furthermore, Cho/Cr levels decrease with cholinergic agonist treatment in AD [44], suggesting that down regulation of choline acetyltransferase activity may be responsible for the elevation of the Cho peak. In our data, the change in Cho/Cr was not different among patients who were on cholinesterase inhibitor therapy and the patients who were not taking cholinesterase inhibitors in each clinical group. The change in Cho/Cr levels therefore was not influenced by cholinesterase inhibitors.
A previously unreported finding in this study is the decline in Cho/Cr levels in patients with aMCI who did not progress to AD with respect to aMCI-converters and controls. On the surface this finding is counter intuitive – i.e. an increase in Cho/Cr might be expected in stable aMCI similar to that observed in AD and aMCI converters. However, biochemical assays of autopsy specimens reveal upregulation of choline acetyl transferase in patients with MCI with respect to controls and people with mild AD [9]. A parallel interpretation of our in vivo MRS data might then be that the decline in Cho/Cr ratio in people with aMCI who remained clinically stable over the observation period may be related to this compensatory mechanism.
4.3. Longitudinal Change in NAA/Cr Ratios
We found a decline in posterior cingulate gyrus NAA/Cr levels in people with aMCI and AD compared to cognitively normal elderly. This is in agreement with a previous study showing a higher rate of gray matter NAA decline in AD subjects than controls on 1H MRS imaging [1]. NAA is a marker of neuronal integrity. The fact that we found a similar decline in NAA/Cr levels among aMCI-stable, aMCI-converter and AD subjects, suggests a steady decline in posterior cingulate gyrus NAA/Cr levels starting from the prodromal stages of AD.
In AD subjects, the decline in NAA/Cr levels correlated with the decline in cognitive function measured with DRS and CDR, consistent with an earlier report of an association between the longitudinal decline in NAA and DRS in a smaller group of AD subjects [1]. We did not find a statistically significant correlation between the decline in NAA/Cr levels and MMSE. In a previous study, the change in medial temporal lobe NAA/Cr levels in AD subjects were not different from normal, whereas there was a correlation between the decline in NAA/Cr levels and MMSE [17]. The inherent variability of the MMSE and the different 1H MRS voxel locations studied may have contributed to inconsistent findings. We studied the posterior cingulate gyrus, a paralimbic cortical region, which is affected with the early AD pathology. PET studies consistently indicate decreased glucose metabolism in this region in aMCI, preclinical, and early AD [7,11,33,43]. Because it is involved in the earliest pathologic stage of AD, the medial temporal lobe is also an appropriate target for tracking disease progression in aMCI and early AD. Furthermore, medial temporal lobe 1H MRS is sensitive to the longitudinal change in MMSE [17]. In our experience, the test-retest reproducibility and inter-subject variability of 1H MRS metabolite measurements from the posterior cingulate voxel is superior to the medial temporal voxel, which made it our choice for serial measurements [23].
4.4. Longitudinal Change in mI/Cr Ratios
In line with previous studies from our group and others [4,20], the baseline mI/Cr levels were higher in patients with aMCI and AD than the controls. The longitudinal elevation of mI/Cr ratio, however, was not different across the clinical groups. Because of this finding, we did not investigate the longitudinal NAA/mI change in this study, although cross-sectional NAA/mI measurements are the most accurate discriminator of AD from normal [24,32]. The baseline mI/Cr is elevated in patients with aMCI, thus the longitudinal elevation of mI/Cr in the course of AD possibly starts early during progression from normal cognitive function to aMCI. Because sample size limitations did not allow us to study control-converters, we could not test for a possible early elevation of mI/Cr in our data. The longitudinal change in mI/Cr levels in the aMCI and AD groups may also be affected by the lower test-retest reproducibility of mI/Cr measurements than NAA/Cr and Cho/Cr measurements, evident from serial phantom studies [21].
4.5. Test-retest reproducibility of 1H MRS Metabolite Ratios and Limitations
The test-retest reproducibility of NAA/Cr, Cho/Cr or mI/Cr in a normal person within a year may depend on both physiological and acquisition-related factors. It is difficult to elaborate on the physiological factors causing variability in metabolite peak signals, since the biological significance of these metabolite peaks is relatively unknown. Normalization of NAA levels after successful therapy in neurological disorders suggests that elevation of NAA may be a surrogate for recovering neuronal function. There is no evidence however to attribute NAA/Cr variation in a cognitively normal elderly individual to a variation in neuronal function. We used fully automated acquisition and spectroscopic quantification methods for metabolite ratio measurements, except for the anatomic localization of the voxel. Although anatomical landmarks were used for voxel localization, positioning of the voxel may have varied slightly between the two exams which would negatively impact the precision of our longitudinal measurements.
Because Cr levels are repeatedly found to be normal in patients with AD [46], Cr has been the internal standard of choice for atrophy correction, and for elimination of the variation in acquisition conditions in clinical 1H MRS studies of AD. Cr peak is composed of signals from both creatine and phosphocreatine, therefore it is stable with the varying energy state of creatine. Metabolite levels however differ in gray and white matter, and atrophy may have caused the relative gray and white matter content to change in the voxel we studied. It is not clear however, what effect this would have on metabolite ratios. For example Cr concentration is on average 30% higher in the gray matter than white matter [31]. Widening of the interhemispheric fissure would decrease the relative white matter content in the voxel, driving Cr concentration up between two serial exams. Conversely, if the concept of selective gray matter atrophy in AD is correct, then this effect would drive Cr concentration in the voxel down in longitudinal examinations.
When we designed our longitudinal study in 1998, Cr referencing with PROBE was the only commercially available, fully automated, and multi-site validated acquisition and spectroscopic quantification method available to us. We acknowledge that 1H MRS quantification methods that do not require internal Cr referencing may be preferable for longitudinal 1H MRS studies in which the voxel’s gray and white matter content may change [41]. However, technical consistency is a cardinal principle in longitudinal studies. Consequently, we chose to keep our methods constant during this longitudinal study in order to avoid the loss of valuable data.
4.6. Comparing MR Markers in Tracking Clinical Progression of AD
A recent study by our group showed that among the rates of change in regional (hippocampal and entorhinal cortex) and global (whole brain and ventricular) volumes on MRI, the global measures correlated better with disease progression in aMCI and AD [16]. We chose to study the rate of change in ventricular volume as a standard to determine if the change in 1H MRS metabolites can track clinical disease progression better than ventricular volume change in aMCI and AD. Our data indicates that the decline in NAA/Cr correlates with the increase in CDR and the decline in DRS about as strongly as the expansion of ventricular volumes in AD. Similarly, the elevation of Cho/Cr correlates with the decline in MMSE about as strongly as the expansion of ventricular volumes. We feel that both 1H MRS and MR volumetric markers may be equally useful in monitoring drug effects in patients with AD.
This study showed for the first time that Cho/Cr levels decline in patients with aMCI who remain stable, but not in patients with aMCI who progress to AD, suggesting the presence of a compensatory cholinergic mechanism that may be failing in those aMCI patients who progress to AD. Understanding the possible relationship between the compensatory cholinergic mechanisms and the decline in Cho/Cr in stable aMCI patients may have important implications for monitoring early progression of AD as well as other neurodegenerative syndromes such as dementia with Lewy bodies, characterized by cholinergic deficit and elevation of Cho/Cr ratio [22].
Figure 3.


Examples 1H MR spectra from a control (a), MCI-stable (b), MCI-converter (c), and an AD (d) subject at baseline and during follow-up. The follow-up spectra are scaled to the baseline spectra in each subject taking Cr peak as reference. All 1H MRS metabolite ratios are fairly stable over time in the control subject (a). NAA/Cr ratios are declining in the MCI-stable, MCI-converter, and the AD patient (b,c,d), MCI-stable patient also has declining Cho/Cr ratio (b).
Acknowledgments
Supported by NIH Roadmap Multidisciplinary Clinical Research Career Development Award (K12/NICHD)-HD049078, Alzheimer’s Association New Investigator Research Grant NIRG-03-4842, NIH/NIA-AG11378, AG06786, and AG16574, and by the Robert H. and Clarince Smith and Abigail Van Buren Alzheimer’s Disease Research program.
Footnotes
Disclosure Statements
The authors do not have any actual or potential conflicts of interests to disclose. This study was approved by the Mayo Clinic Institutional Review Board, and informed consent for participation was obtained from every subject and/or an appropriate surrogate.
References
- 1.Adalsteinsson E, Sullivan EV, Kleinhans N, Spielman DM, Pfefferbaum A. Longitudinal decline of the neuronal marker N-acetyl aspartate in Alzheimer’s disease. Lancet. 2000;355(9216):1696–7. doi: 10.1016/s0140-6736(00)02246-7. [DOI] [PubMed] [Google Scholar]
- 2.Alexander GE, Chen K, Pietrini P, Rapoport SI, Reiman EM. Longitudinal PET Evaluation of Cerebral Metabolic Decline in Dementia: A Potential Outcome Measure in Alzheimer’s Disease Treatment Studies. American Journal of Psychiatry. 2002;159(5):738–45. doi: 10.1176/appi.ajp.159.5.738. [DOI] [PubMed] [Google Scholar]
- 3.Brooks WM, Stidley CA, Petropoulos H, Jung RE, Weers DC, Friedman SD, Barlow MA, Sibbitt WL, Jr, Yeo RA. Metabolic and cognitive response to human traumatic brain injury: a quantitative proton magnetic resonance study. Journal of Neurotrauma. 2000;17(8):629–40. doi: 10.1089/089771500415382. [DOI] [PubMed] [Google Scholar]
- 4.Catani M, Cherubini A, Howard R, Tarducci R, Pelliccioli GP, Piccirilli M, Gobbi G, Senin U, Mecocci P. (1)H-MR spectroscopy differentiates mild cognitive impairment from normal brain aging. Neuroreport. 2001;12(11):2315–7. doi: 10.1097/00001756-200108080-00007. [DOI] [PubMed] [Google Scholar]
- 5.Chantal S, Braun CM, Bouchard RW, Labelle M, Boulanger Y. Similar 1H magnetic resonance spectroscopic metabolic pattern in the medial temporal lobes of patients with mild cognitive impairment and Alzheimer disease. Brain Research. 2004a;1003(1–2):26–35. doi: 10.1016/j.brainres.2003.11.074. [DOI] [PubMed] [Google Scholar]
- 6.Chao LLSN, Kramer JH, et al. Reduced medial temporal lobe N-acetylaspartate in cognitively impaired not demented individuals. Neurology. 2005;64:282–9. doi: 10.1212/01.WNL.0000149638.45635.FF. [DOI] [PMC free article] [PubMed] [Google Scholar]
- 7.Chetelat G, Desgranges B, de la Sayette V, Viader F, Eustache F, Baron JC. Mild cognitive impairment: Can FDG-PET predict who is to rapidly convert to Alzheimer’s disease? Neurology. 2003;60(8):1374–7. doi: 10.1212/01.wnl.0000055847.17752.e6. [DOI] [PubMed] [Google Scholar]
- 8.Choi S. Tests of equality of dependent correlations. Biometrika. 1977;64:645–647. [Google Scholar]
- 9.DeKosky ST, Ikonomovic MD, Styren SD, Beckett L, Wisniewski S, Bennett DA, Cochran EJ, Kordower JH, Mufson EJ. Upregulation of choline acetyltransferase activity in hippocampus and frontal cortex of elderly subjects with mild cognitive impairment. Annals of Neurology. 2002;51(2):145–55. doi: 10.1002/ana.10069. [see comment] [DOI] [PubMed] [Google Scholar]
- 10.Dixon RM, Bradley KM, Budge MM, Styles P, Smith AD. Longitudinal quantitative proton magnetic resonance spectroscopy of the hippocampus in Alzheimer’s disease. Brain. 2002;125(Pt 10):2332–41. doi: 10.1093/brain/awf226. [DOI] [PubMed] [Google Scholar]
- 11.Drzezga A, Lautenschlager N, Siebner H, Riemenschneider M, Willoch F, Minoshima S, Schwaiger M, Kurz A. Cerebral metabolic changes accompanying conversion of mild cognitive impairment into Alzheimer’s disease: a PET follow-up study. European Journal of Nuclear Medicine & Molecular Imaging. 2003;30(8):1104–13. doi: 10.1007/s00259-003-1194-1. [DOI] [PubMed] [Google Scholar]
- 12.Firbank MJ, Minett T, O’Brien JT. Changes in DWI and MRS associated with white matter hyperintensities in elderly subjects. Neurology. 2003;61(7):950–4. doi: 10.1212/01.wnl.0000086375.33512.53. [DOI] [PubMed] [Google Scholar]
- 13.Freeborough PA, Fox NC. The boundary shift integral: an accurate and robust measure of cerebral volume changes from registered repeat MRI. IEEE Transactions on Medical Imaging. 1997;16(5):623–9. doi: 10.1109/42.640753. [DOI] [PubMed] [Google Scholar]
- 14.Gunter JL, Shiung MM, Manduca A, Jack CR., Jr Methodological considerations for measuring rates of brain atrophy. Journal of Magnetic Resonance Imaging. 2003;18(1):16–24. doi: 10.1002/jmri.10325. [DOI] [PMC free article] [PubMed] [Google Scholar]
- 15.Hugg JW, Kuzniecky RI, Gilliam FG, Morawetz RB, Fraught RE, Hetherington HP. Normalization of contralateral metabolic function following temporal lobectomy demonstrated by 1H magnetic resonance spectroscopic imaging. Annals of Neurology. 1996;40(2):236–9. doi: 10.1002/ana.410400215. [DOI] [PubMed] [Google Scholar]
- 16.Jack CR, Jr, Shiung MM, Gunter JL, O’Brien PC, Weigand SD, Knopman DS, Boeve BF, Ivnik RJ, Smith GE, Cha RH, Tangalos EG, Petersen RC. Comparison of different MRI brain atrophy rate measures with clinical disease progression in AD. Neurology. 2004;62(4):591–600. doi: 10.1212/01.wnl.0000110315.26026.ef. [DOI] [PMC free article] [PubMed] [Google Scholar]
- 17.Jessen F, Block W, Traber F, Keller E, Flacke S, Lamerichs R, Schild HH, Heun R. Decrease of N-acetylaspartate in the MTL correlates with cognitive decline of AD patients. Neurology. 2001;57(5):930–2. doi: 10.1212/wnl.57.5.930. [DOI] [PubMed] [Google Scholar]
- 18.Jessen F, Block W, Traber F, Keller E, Flacke S, Papassotiropoulos A, Lamerichs R, Heun R, Schild HH. Proton MR spectroscopy detects a relative decrease of N-acetylaspartate in the medial temporal lobe of patients with AD. Neurology. 2000;55(5):684–8. doi: 10.1212/wnl.55.5.684. [DOI] [PubMed] [Google Scholar]
- 19.Kantarci K, Jack C., Jr Quantitative magnetic resonance techniques as surrogate markers in Alzheimer’s disease. NeuroRx: The Journal of the American Society for Experimental Neurotherapeutics. 2004;1:196–205. doi: 10.1602/neurorx.1.2.196. [DOI] [PMC free article] [PubMed] [Google Scholar]
- 20.Kantarci K, Jack CR, Jr, Xu YC, Campeau NG, O’Brien PC, Smith GE, Ivnik RJ, Boeve BF, Kokmen E, Tangalos EG, Petersen RC. Regional metabolic patterns in mild cognitive impairment and Alzheimer’s disease: A 1H MRS study. Neurology. 2000;55(2):210–7. doi: 10.1212/wnl.55.2.210. [DOI] [PMC free article] [PubMed] [Google Scholar]
- 21.Kantarci K, Petersen R, Boeve B, Knopman D, Edland S, Smith G, Ivnik R, Tangalos E, Jack C., Jr 1H MRS in mild cognitive impairment and Alzheimer’s Disease; Comparison of 1.5T and 3T. Proceedings; 2002; Honolulu, HW, USA. p. 971. Proceedings. [Google Scholar]
- 22.Kantarci K, Petersen RC, Boeve BF, Knopman DS, Tang-Wai DF, O’Brien PC, Weigand SD, Edland SD, Smith GE, Ivnik RJ, Ferman TJ, Tangalos EG, Jack CR., Jr 1H MR spectroscopy in common dementias. Neurology. 2004;63(8):1393–8. doi: 10.1212/01.wnl.0000141849.21256.ac. [see comment] [DOI] [PMC free article] [PubMed] [Google Scholar]
- 23.Kantarci K, Smith GE, Ivnik RJ, Petersen RC, Boeve BF, Knopman DS, Tangalos EG, Jack CR., Jr 1H magnetic resonance spectroscopy, cognitive function, and apolipoprotein E genotype in normal aging, mild cognitive impairment and Alzheimer’s disease. Journal of the International Neuropsychological Society. 2002;8(7):934–42. doi: 10.1017/s1355617702870084. [DOI] [PMC free article] [PubMed] [Google Scholar]
- 24.Kantarci K, Xu Y, Shiung MM, O’Brien PC, Cha RH, Smith GE, Ivnik RJ, Boeve BF, Edland SD, Kokmen E, Tangalos EG, Petersen RC, Jack CR., Jr Comparative diagnostic utility of different MR modalities in mild cognitive impairment and Alzheimer’s disease. Dementia & Geriatric Cognitive Disorders. 2002;14(4):198–207. doi: 10.1159/000066021. [DOI] [PMC free article] [PubMed] [Google Scholar]
- 25.Khan O, Shen Y, Caon C, Bao F, Ching W, Reznar M, Buccheister A, Hu J, Latif Z, Tselis A, Lisak R. Axonal metabolic recovery and potential neuroprotective effect of glatiramer acetate in relapsing-remitting multiple sclerosis. Mult Scler. 2005;11(6):646–51. doi: 10.1191/1352458505ms1234oa. [DOI] [PubMed] [Google Scholar]
- 26.Klein J. Membrane breakdown in acute and chronic neurodegeneration: focus on choline-containing phospholipids. Journal of Neural Transmission. 2000;107(8–9):1027–63. doi: 10.1007/s007020070051. [DOI] [PubMed] [Google Scholar]
- 27.MacKay S, Ezekiel F, Di Sclafani V, Meyerhoff DJ, Gerson J, Norman D, Fein G, Weiner MW. Alzheimer disease and subcortical ischemic vascular dementia: evaluation by combining MR imaging segmentation and H-1 MR spectroscopic imaging. Radiology. 1996;198(2):537–45. doi: 10.1148/radiology.198.2.8596863. [DOI] [PMC free article] [PubMed] [Google Scholar]
- 28.Mattis S. Dementia Rating Scale: Professional Manual. Odessa, Fla: Assessment Resources Inc; 1988. [Google Scholar]
- 29.McKhann G, Drachman D, Folstein M, Katzman R, Price D, Stadlan EM. Clinical diagnosis of Alzheimer’s disease: report of the NINCDS-ADRDA Work Group under the auspices of Department of Health and Human Services Task Force on Alzheimer’s Disease. Neurology. 1984;34(7):939–44. doi: 10.1212/wnl.34.7.939. [DOI] [PubMed] [Google Scholar]
- 30.Metastasio A, Rinaldi P, Tarducci R, Mariani E, Feliziani FT, Cherubini A, Pelliccioli GP, Gobbi G, Senin U, Mecocci P. Conversion of MCI to dementia: Role of proton magnetic resonance spectroscopy. Neurobiol Aging. 2005 doi: 10.1016/j.neurobiolaging.2005.05.002. [DOI] [PubMed] [Google Scholar]
- 31.Michaelis T, Merboldt KD, Bruhn H, Hanicke W, Frahm J. Absolute concentrations of metabolites in the adult human brain in vivo: quantification of localized proton MR spectra. Radiology. 1993;187(1):219–27. doi: 10.1148/radiology.187.1.8451417. [DOI] [PubMed] [Google Scholar]
- 32.Miller BL, Moats RA, Shonk T, Ernst T, Woolley S, Ross BD. Alzheimer disease: depiction of increased cerebral myo-inositol with proton MR spectroscopy. Radiology. 1993;187(2):433–7. doi: 10.1148/radiology.187.2.8475286. [DOI] [PubMed] [Google Scholar]
- 33.Minoshima S, Giordani B, Berent S, Frey KA, Foster NL, Kuhl DE. Metabolic reduction in the posterior cingulate cortex in very early Alzheimer’s disease. Annals of Neurology. 1997;42(1):85–94. doi: 10.1002/ana.410420114. [DOI] [PubMed] [Google Scholar]
- 34.Modrego PJ, Fayed N, Pina MA. Conversion from mild cognitive impairment to probable Alzheimer’s disease predicted by brain magnetic resonance spectroscopy. American Journal of Psychiatry. 2005;162(4):667–75. doi: 10.1176/appi.ajp.162.4.667. [see comment] [DOI] [PubMed] [Google Scholar]
- 35.Mueller S, Weiner M, Thal L, Petersen R, Jack C, Jr, Jagust W, Trojanowski J, Toga A, Beckett L. Ways toward an early diagnosis in Alzheimer’s disease: The Alzheimer’s Disease Neuroimaging Initiative (ADNI) Alzheimer’s and Dementia. 2005;1(1):55–66. doi: 10.1016/j.jalz.2005.06.003. [DOI] [PMC free article] [PubMed] [Google Scholar]
- 36.Narayanan S, De Stefano N, Francis GS, Arnaoutelis R, Caramanos Z, Collins DL, Pelletier D, Arnason BGW, Antel JP, Arnold DL. Axonal metabolic recovery in multiple sclerosis patients treated with interferon beta-1b. J Neurol. 2001;248(11):979–86. doi: 10.1007/s004150170052. [DOI] [PubMed] [Google Scholar]
- 37.O’Brien PC. The appropriateness of analysis of variance and multiple-comparison procedures. Biometrics. 1983;39(3):787–94. [PubMed] [Google Scholar]
- 38.Perneger TV. What’s wrong with Bonferroni adjustments. BMJ. 1998;316(7139):1236–8. doi: 10.1136/bmj.316.7139.1236. [see comment] [DOI] [PMC free article] [PubMed] [Google Scholar]
- 39.Petersen RC, Doody R, Kurz A, Mohs RC, Morris JC, Rabins PV, Ritchie K, Rossor M, Thal L, Winblad B. Current concepts in mild cognitive impairment. Archives of Neurology. 2001;58(12):1985–92. doi: 10.1001/archneur.58.12.1985. [DOI] [PubMed] [Google Scholar]
- 40.Petersen RC, Kokmen E, Tangalos E, Ivnik RJ, Kurland LT. Mayo Clinic Alzheimer’s Disease Patient Registry. Aging-Clinical & Experimental Research. 1990;2(4):408–15. doi: 10.1007/BF03323961. [DOI] [PubMed] [Google Scholar]
- 41.Provencher SW. Estimation of metabolite concentrations from localized in vivo proton NMR spectra. Magnetic Resonance in Medicine. 1993;30(6):672–9. doi: 10.1002/mrm.1910300604. [DOI] [PubMed] [Google Scholar]
- 42.R Development Core. R: A language and environment for statistical computing, R foundation for statistical computing. 2004. [Google Scholar]
- 43.Reiman EM, Caselli RJ, Chen K, Alexander GE, Bandy D, Frost J. Declining brain activity in cognitively normal apolipoprotein E epsilon 4 heterozygotes: A foundation for using positron emission tomography to efficiently test treatments to prevent Alzheimer’s disease. Proceedings of the National Academy of Sciences of the United States of America. 2001;98(6):3334–9. doi: 10.1073/pnas.061509598. [DOI] [PMC free article] [PubMed] [Google Scholar]
- 44.Satlin A, Bodick N, Offen WW, Renshaw PF. Brain proton magnetic resonance spectroscopy (1H-MRS) in Alzheimer’s disease: changes after treatment with xanomeline, an M1 selective cholinergic agonist. American Journal of Psychiatry. 1997;154(10):1459–61. doi: 10.1176/ajp.154.10.1459. [DOI] [PubMed] [Google Scholar]
- 45.Smith GS, de Leon MJ, George AE, Kluger A, Volkow ND, McRae T, Golomb J, Ferris SH, Reisberg B, Ciaravino J, et al. Topography of cross-sectional and longitudinal glucose metabolic deficits in Alzheimer’s disease. Pathophysiologic implications Archives of Neurology. 1992;49(11):1142–50. doi: 10.1001/archneur.1992.00530350056020. [DOI] [PubMed] [Google Scholar]
- 46.Valenzuela MJ, Sachdev P. Magnetic resonance spectroscopy in AD. Neurology. 2001;56(5):592–8. doi: 10.1212/wnl.56.5.592. [DOI] [PubMed] [Google Scholar]
- 47.Wahlund LO, Barkhof F, Fazekas F, Bronge L, Augustin M, Sjogren M, Wallin A, Ader H, Leys D, Pantoni L, Pasquier F, Erkinjuntti T, Scheltens P. A new rating scale for age-related white matter changes applicable to MRI and CT. Stroke. 2001;32(6):1318–22. doi: 10.1161/01.str.32.6.1318. [DOI] [PubMed] [Google Scholar]
- 48.Webb PG, Sailasuta N, Kohler SJ, Raidy T, Moats RA, Hurd RE. Automated single-voxel proton MRS: technical development and multisite verification. Magnetic Resonance in Medicine. 1994;31(4):365–73. doi: 10.1002/mrm.1910310404. [DOI] [PubMed] [Google Scholar]
- 49.Wurtman RJBJ, Marie JC. Autocannibalism of choline-containing membrane phospholipids in the pathogenesis of Alzheimer’s disease. Neurochemistry International. 1985;(7):369–72. doi: 10.1016/0197-0186(85)90127-5. [DOI] [PubMed] [Google Scholar]