

Abstract
The aim of this study was to find the most prominent source of intersubject variability in neuronal activation for reading familiar words aloud. To this end, we collected functional imaging data from a large sample of subjects (n = 76) with different demographic characteristics such as handedness, sex, and age, while reading. The subject-by-subject error variance was estimated from a one-sample t test (on all 76 subjects) and was reduced to a lower dimension using principal components decomposition. A Gaussian Mixture Model was then applied to dissociate different subgroups of subjects that explained the main sources of variability in the data. This resulted in the identification of four different subject groups. The comparison of these subgroups to the subjects' demographic details showed that age had a significant effect on the subject partitioning. In addition, a region-by-group dissociation in the dorsal and the ventral inferior frontal cortex was consistent with previously reported dissociations in semantic and nonsemantic reading strategies. In contrast to these significant findings, the groupings did not differentiate subjects on the basis of either sex or handedness, nor did they segregate the subjects with right- versus left-lateralized reading activation. We therefore conclude that, of the variables tested, age and reading strategy were the most prominent source of variability in activation for reading familiar words aloud.
INTRODUCTION
There is substantial evidence that specific subgroups of the normal population show differential brain activation when performing the same language task (e.g., left-vs. right-handers; children vs. adults; and males vs. females). This intersubject variation could either reflect (A) different functional anatomy where different brain regions execute the same function, or (B) different functional strategies where different brain regions execute different functions that, nonetheless, lead to the same output. For example, differences in handedness might reflect systematic differences in functional anatomy (explanation A), whereas differences in age might reflect different functional strategies (explanation B).
In this study, we investigate the main source of intersubject variability in the activation pattern for reading aloud familiar words. Although we introduced known sources of variance (e.g., handedness, sex, and age), our analysis used an unbiased classification technique to identify subgroups of subjects. We then conducted a number of post hoc analyses to determine the defining differences between the identified groups. Before discussing details of our methods and hypotheses, we provide a brief summary of previous studies of intersubject variability in the activation patterns for reading and other language tasks.
Evidence for differences between left- and right-handers comes from a long history of studies showing that language lateralization is more heterogeneous in left-handers than right-handers. Specifically, studies using neuroimaging (PET, fMRI), lesion analysis, or the Wada test (intracarotid amobarbitol procedure) have shown that language is left lateralized in approximately 90% of right-handers and 75% of left-handers, with the remaining 25% of left-handers having either bilateral or right hemisphere dominance (Sass, Legge, & Lee, 2006; Pujol, Deus, Losilla, & Capdevila, 1999; Binder, Swanson, Hammeke, Morris, & Mueller, 1996). In other words, at the population level, left-handers use their right hemisphere for language more than right-handers.
The effect of age on cognitive and neuronal function has also been investigated. It is well established that there is a rise and fall of cognitive function as age increases (Verhaeghen, Steitz, Sliwinski, & Cerella, 2003; Verhaeghen et al., 2002; Cohen, 1979). Functional imaging studies have shown more visual word processing activation for children (9–12 years) than adults (21–31 years) in posterior heteromodal regions (Booth et al., 2001). However, the overall neuronal system for reading is thought to be fully established in adolescence with regional activation dependent on reading performance (Brem et al., 2006). In a correlation analysis across 119 nonimpaired readers (age 7–18 years), Shaywitz et al. (2007) recently observed that left anterior lateral occipito-temporal activation increased with age, whereas right superior and middle frontal activation decreased. Although we are not aware of any fMRI studies that have focused on how reading activation might change in old age, there is a general consensus that language lateralization increases and then declines with age, particularly within frontal brain areas (Friederici, 2006; Szaflarski, Holland, Schmithorst, & Byars, 2006; Rotte, 2005; Langenecker, Nielson, & Rao, 2004; Cabeza, 2001).
With respect to sex differences, behavioral studies suggest that females have higher verbal fluency scores (Voyer, 1996), whereas patient studies suggest that females have more bilateral language representation because aphasia is less frequent for females than for males after left hemisphere unilateral stroke (McGlone, 1980). The results of functional imaging studies, however, have been less consistent. Although early functional imaging studies reported more left-lateralized language in males than in females (Shaywitz et al., 1995), other studies have not replicated these results. For example, Frost et al. (1999) and a recent meta-analysis by Sommer, Aleman, Bouma, and Kahn (2004) proposed that sex effects for language processing are likely to be task-dependent.
Other than these demographic characteristics, variability between subjects could arise from individual differences in cognition: perception, memory, attention or, more generally, in the strategies applied to solve a given task. These factors are likely to affect the use of specific reading pathways. According to most models of reading, there are at least two different pathways for translating orthography to phonology: one via semantics and one or more without semantic involvement (Coltheart, Curtis, Atkins, & Haller, 1993). For a given word, the preferred pathway is determined by its properties (e.g., lexicality, length, frequency, orthographical-to-phonological consistency) or context (priming); however, it has been argued that readers can influence (strategic control) which pathway is selected (Kello & Plaut, 2003; Paap & Noel, 1991). Therefore, strategic emphasis on one or the other pathway could result in differences between subjects. For example, Baron and Strawson (1976) identified two groups of English readers based on their use of orthographical-to-phonological rules versus lexical information. More recently, a similar dichotomy between subjects was proposed by Hayes and Masterson (2002). These results suggest that teaching methods (or other skills) can bias an individual's reading strategy by generating a learning preference for either phonological decoding or the semantic approach (Connor, Morrison, Fishman, Schatschneider, & Underwood, 2007; Freebody & Byrne, 1988; Baron & Strawson, 1976).
Evidence that there are different neuronal systems for different reading strategies has come from both lesion studies of brain-damaged patients and functional imaging studies of normal subjects. For example, functional imaging studies have shown that the left dorsal premotor cortex is more activated for phonological than for semantic processing, whereas the left ventral anterior inferior frontal cortex is more activated for semantic than for phonological processing (Binder, Medler, Desai, Conant, & Liebenthal, 2005; Ischebeck et al., 2004; Binder et al., 2003; Devlin, Matthews, & Rushworth, 2003; McDermott, Petersen, Watson, & Ojemann, 2003; Rissman, Eliassen, & Blumstein, 2003; Fiebach, Friederici, Muller, & von Cramon, 2002; Poldrack et al., 1999; Fiez, 1997). These observations have been deduced by comparing different types of words or different tasks within subject but we also expect that the activation pattern for the same type of word may vary from subject to subject, depending on their preferred reading strategy.
In the current study, we used fMRI to characterize intersubject variability in neuronal activation for reading aloud familiar words in a sample of 76 subjects who varied in terms of handedness, sex, and age. The activation task of interest involved reading aloud 96 high-frequency concrete names with three to seven letters and regular spelling to sound relationships (e.g., “cat,” “ship”). In addition, the fMRI paradigm involved blocks of fixation, picture naming, and saying “1,2,3” to meaningless pictures of nonobjects and symbols. These conditions allowed us to dissociate brain regions that were selective for reading or more generally involved in visual processing and articulation. First, we carried out a one-sample t test on the contrast images for reading aloud compared to visual fixation. This analysis (a) sums over data from all subjects, (b) identifies reading activation at multiple levels including visual and articulatory processing, and (c) treats all the intersubject variability as error variance. We then applied Principal Component Analysis (PCA) to the error variance (reflecting intersubject variability) to capture the main source of variance. PCA also acts as a dimension reduction method because the majority of this variance is explained by the first few components (Kherif et al., 2002). In the third stage, Gaussian Mixture Modeling (GMM) is used to assign subjects to different subgroups using a method previously proposed by Noppeney, Penny, Price, Flandin, and Friston (2006). This identifies the most likely number of subgroups (maximized by the likelihood of the data) and the subgroup that each subject belongs to. Finally, to characterize the regional differences between the identified subgroups at each brain voxel, we ran a conventional ANOVA on the same set of contrast images from the comparison of reading aloud to fixation.
The GMM approach extracts the subject groupings from the data. Therefore, it does not depend on a priori knowledge of the subgroups but uses a probabilistic classification method to find the probability that a particular subject belongs to one or another subgroup. Activation patterns are assumed to be similar within a subgroup but vary between subgroups. As discussed above, prior research suggests that expected sources of intersubject variability in reading (i.e., handedness, sex, age, reading strategy) may explain the subject groupings derived independently from the GMM. We therefore investigated if the GMM subgroups corresponded to our demographic categories (e.g., right- vs. left-handed; male vs. female; older vs. younger). We also investigated whether the brain regions associated with the different GMM subgroups corresponded to those previously associated with semantic and nonsemantic reading strategies or the degree to which reading activation was lateralized to the left or right hemisphere.
Our specific predictions with respect to intersubject variation in the use of semantic and nonsemantic reading strategy were as follows: Subjects using a nonsemantic more than semantic reading strategy will show increased activation in the left dorsal premotor region that has previously been associated with reading pseudowords compared to irregularly spelled words (see above). We would also expect these subjects to activate the same left dorsal premotor region more for reading (that can proceed nonsemantically) than for picture naming (which relies on semantic processing). In contrast, our prediction was that subjects using a semantic more than nonsemantic reading strategy will show increased activation in the left ventral inferior frontal region that has previously been associated with reading irregularly spelled words compared to pseudowords. Activation in semantic reading regions is also expected to be higher for picture naming (that relies on semantics) than for reading (that does not rely on semantics).
METHODS
Demographic Characteristics of the Participants
We studied 76 healthy subjects: 43 described themselves as right-handed (18 men, 25 women) and 33 described themselves as left-handed (15 men, 18 women) (see Table 1). None of the subjects had a history of learning difficulties (e.g., dyslexia). On the Edinburgh Handedness Inventory, the left-handed subjects' scores varied between −100 and −47 (with −100 most strongly left-handed and +100 most right-handed). The subjects' ages ranged from 13 to 74 years with an average of 30.7 years (SD = 15.5). According to their sex and their hand dominance, the subjects fell in one of the following four categories: right-handed females (RF), right-handed males (RM), left-handed females (LF), left-handed males (LM). The mean ages of these categories were as follows: RF (mean = 32.2 years; SD = 20.5), RM (mean = 28 years; SD = 17.7), LF (mean = 30.2 years; SD = 10.2), LM (mean = 32 years; SD = 7.0). There were no significant differences in the number of participants or their age within categories (or interactions). However, all the subjects in the lower range age (13–16) were right-handed.
Table 1.
Subjects' Demographic Characteristics
| Age |
||||
|---|---|---|---|---|
| Category | n | Mean | SD | Range |
| Left-handed males (LM) | 15 | 32 | 7.0 | 20–46 |
| Left-handed females (LF) | 18 | 30 | 10.3 | 20–57 |
| Right-handed males (RM) | 18 | 28 | 17.7 | 13–69 |
| Right-handed females (RF) | 25 | 32 | 20.5 | 13–74 |
| Adolescents | 15 | 14 | 1.6 | 13–16 |
| Young adults | 45 | 27 | 5.1 | 20–38 |
| Older adults | 16 | 57 | 0.2 | 43–74 |
The age categories were defined with the following criteria: adolescent = 13–16 years; young adults = 18–40 years; older adults = 40–74 years.
Behavioral Characteristics of the Participants
Behavioral data were collected at the time of scanning from a subset of 23 of our right-handed participants (13 adolescents and 10 adults). Tests for adolescents had different stimuli than those for adults but the task instructions were identical across groups. IQ measurements were from the Wechsler Intelligence Scale for Children for the adolescents and the WAIS for the adults. Reading and spelling were assessed with the Wide Range Achievement Test. Phonological memory and manipulation were assessed using the “Spoonerisms” task from the phonological assessment battery (Frederickson, Frith, & Reason, 1997). This involves listening to two auditory presented words (“lantern” and “basket”) followed by verbal repetition after switching the two initial phonemes (“bantern” and “lasket”).
fMRI Stimuli, Task, and Design
All stimuli were derived from a set of 192 objects with three- to six-letter names that had regular spelling to sound relationships: 33 had three-letter names (cat, bus, hat), 65 had four-letter names (ship, bell, frog, hand), 58 had five-letter names (teeth, camel, snake), and 36 had six-letter names (spider, dagger, button). A pilot study with eight subjects ensured intersubject agreement on all picture names. The 192 objects were first divided into two different sets of 96 items which we refer to as Set A and Set B. Half the subjects were presented with Set A as written words for reading aloud and Set B as pictures for object naming. The other half were presented with Set B as written words for reading aloud and Set A as pictures for object naming. In addition, the experimental design involved saying “1,2,3” to meaningless strings of symbols (matched in size to the letters of the words) or meaningless nonobjects (matched in size to the pictures). Stimulus presentation was via a video projector, a front-projection screen, and a system of mirrors fastened to a head coil. Words and pictures were presented centrally. Words were in lowercase Arial font, with a maximum visual angle on the retina of 4.9° × 1.2°.
Procedure
Over two separate scanning sessions, there were eight blocks of reading, eight blocks of object naming, eight blocks of saying “1,2,3” to meaningless symbols or objects, and twelve blocks of fixation baseline. Each block lasted 18 sec with 12 stimuli per block presented 3 at a time (i.e., in triads) for 4.5 sec per triad. This enabled us to maximize presentation rate and paradigm efficiency. Items within the reading and object naming triads were selected such that there was no obvious semantic relationship between the three different items (e.g., slide, axe, and cup). Condition order was fully counterbalanced within and across scanning session.
MRI Acquisition
A 1.5-T MRI scanner (Siemens Medical Systems) was used to acquire functional images with an EPI GRE sequence TR/TE/Flip = 3600 msec/50 msec/90, FOV = 192 mm, matrix = 64 × 64, 40 axial slices, 2 mm thick with 1 mm gap). The EPI GRE sequence was specially optimized to minimize signal dropout by adjusting the slice tilt, the direction of the phase-encoding, and the z-shim moment (for more details, see Weiskopf, Hutton, Josephs, & Deichmann, 2006). Moreover, to avoid ghost-EPI artifacts, a generalized reconstruction algorithm was used for data preprocessing. Special attention was also paid to movement artifacts and the resulting transformation parameters because speaking aloud can generate movement artifacts, and movement artifacts are an important issue when looking at individual variability. In addition to checking our data thoroughly for any sign of artifacts (movement related or otherwise), head motion was assessed for each subject by calculating the path length of the head motion for each block as previously proposed by D'Esposito, Zarahn, Aguirre, and Rypma (1999) prior to normalization. For this reason, before analyzing the data at the group level with the PCA–GMM, we had discarded any subjects with more than 1.5 mm motion. For the remaining 76 subjects, the mean of the motion (path length) was 0.45 mm (SD = 0.35 mm). We also applied a spatial smoothing of 8 mm FWHM to account for residual variability after normalization of the subjects' brains to the MNI template.
Data Analysis
Spatial and temporal data preprocessing as well as the statistical analyses were performed using algorithms implemented in SPM5 (Wellcome Trust Centre for Neuroimaging, London, UK). Spatial transformations include realignment (to correct for movement artifacts), unwarping, normalization to the MNI space, and spatial smoothing (isotropic 8 mm FWHM). Temporal preprocessing transformations involved high-pass filtering (1/128 Hz cutoff ) of the data to remove low-frequency noise and signal drift. First-level statistical analyses were performed separately for each individual. Voxelwise summary statistics were estimated by solving a fixed-effect general linear model. The event-related model design was obtained by a convolution with the canonical hemodynamic response function. For each subject, parameter estimates (i.e., beta images) were assessed with least square regression analysis, and the contrast images (i.e., weighted beta images) were computed. The contrast of interest for the PCA–GMM procedure was the main effect of reading relative to fixation. In addition, for each subject, we also computed the effects of (i) reading relative to picture naming and (ii) reading relative to saying “1,2,3” to meaningless symbols. These latter two contrasts were used in our post hoc analyses to help interpret the results of the PCA–GMM procedure.
PCA/GMM Algorithm
The core of this procedure is the identification of subgroups of subjects using a PCA and a GMM algorithm. PCA is often used as a dimension reduction procedure (Kherif et al., 2002, 2003), and finite mixture models are being increasingly used to model the distribution of a wide variety of random phenomena (McLachlan, Peel, & Whiten, 1996). A schematic of the method is shown in Figure 1. PCA was performed on the subject-by-subject error variance from the one-sample t test of activation for reading relative to fixation. By retaining the first few components, the dimensionality of the original data matrix is reduced to a new matrix while maintaining most of the variance, that is, X(S,N) becomes Y(S, r) where N is the number of voxels, S is the number of subjects, and r is the number of retained PCA components.
Figure 1.
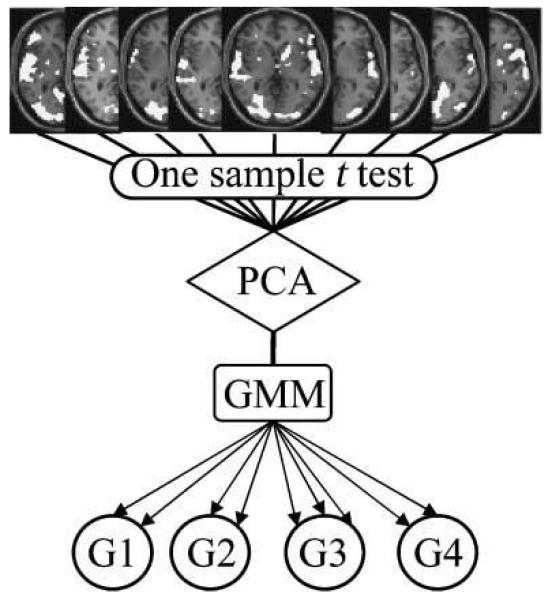
Schematic view of the three stages of the combined Principal Components Analysis and Gaussian Mixture Modeling (PCA–GMM) analysis. The inputs are the parameter estimates in each subject reading aloud relative to fixation (identified using conventional first level analyses). Stage 1 estimates the subject-by-subject variance using a conventional one-sample t test on the parameter estimates for each subject. Stage 2 identifies the main sources of variability between subjects using PCA of the subject-by-subject covariance matrix from the one-sample t test. Stage 3 assigns subjects to different subgroups using GMM, such that the activation pattern is similar for subjects within the same subgroup but less similar for subjects in different subgroups. The output is the most likely number of subgroups as determined on the basis of their maximum probability of occurrence.
The aim of the GMM is to model the probability density of the data. It is based on the hypothesis that the data have been generated by a mixture of K different subgroups with distinct profiles (Equation 1). Each subgroup is represented by a Gaussian probability distribution parameterized by a mean μk and a variance Σk (Equation 2).
| (1) |
| (2) |
where yi represents one subject and πk represents the nonnegative mixing coefficients that sum to one and p(yi|k) denotes the probability that the subject i belongs to the kth subgroup. The parameters of the model are fitted iteratively by maximum likelihood (ML) via the expectation–maximization (EM) algorithm until reaching the convergence defined by the log likelihood function given by:
Deciding the number of subgroups k is a model selection problem for which a Bayesian criterion, such as the model evidence, can be used (Friston, Mattout, Trujillo-Barreto, Ashburner, & Penny, 2007; Penny & Friston, 2003; Penny, Kiebel, & Friston, 2003). The algorithm is run with different values of K, and the model with the highest evidence is selected.
The combined PCA–GMM procedure uses multivariate information to dissociate subgroups of subjects. To characterize the differences between the identified K subgroups, we ran a series of post hoc analyses.
Analysis 1: Relationship of GMM Subgroups to the Demographic Profiles
This was investigated using chi-square tests, after transforming the subject numbers in each GMM subgroup into relative proportions according to the demographic categorizations (left- vs. right-handed, male vs. female, age group).
Analysis 2: Regional Activations in a Voxel-by-Voxel Analysis
A conventional one-way ANOVA was conducted on the contrast images for reading relative to fixation for each group separately. This identified regions that were more activated by one subgroup than all others. Effects are reported if they were significant (a) after family-wise correction for multiple comparisons across the whole brain, or (b) in the three left prefrontal regions reported by Mechelli et al. (2005), who compared activation for reading different word types. Specifically, Mechelli et al. reported that the left dorsal premotor cortex (−56 0 40) was activated by reading pseudowords more than irregular words; the pars orbitalis (−52 32 4) was activated by reading irregular words more than pseudo-words; and the pars opercularis (−52 2 18) was activated by reading both pseudowords and irregular words relative to regularly spelled words.
Analysis 3: Condition-specific Activation Profile in Regions of Interest
Two further ANOVAs were used to compute activation for reading relative to (a) picture naming or (b) saying “1,2,3” to meaningless visual stimuli. This enabled us to explore the functional properties of a region on the basis of relative activation across our different conditions.
Analysis 4: Relationship of GMM Subgroups to Hemispheric Dominance
Laterality differences for left versus right hemisphere reading activation were assessed by computing the laterality index (LI) for each subject and then comparing the range of LI values in each subgroup. There are several different methods for assessing LI (see Seghier, 2008). Here we used the method proposed by Nagata, Uchimura, Hirakawa, and Kuratsu (2001). This method gives a single LI, on the basis of the total number of significantly activated voxels in each hemisphere, for each subject and for a whole set of thresholds (from p = 10−2 to 10−7). The LI measure varies from +1 (for LH lateralization) to −1 (for RH lateralization). Differences in LI between subgroups were compared using a conventional ANOVA.
Analysis 5: Relationship of GMM Subgroups to the Behavioral Measures
Finally, we explored our available behavioral data in search of any evidence that our groups differed in their verbal abilities. To ensure that behavioral data were collected from a representative sample of subjects in each group, we recomputed the ANOVA (post hoc analysis 2 above) to test whether the smaller groups were still associated with the same pattern of activation differences in our regions of interest.
RESULTS
Reading accuracy in the scanner was 97% or above for all subjects. Following a one-sample t test on the reading activation for all 76 subjects, we extracted the error variance and applied the GMM algorithm. The first stage of the algorithm, based on the PCA decomposition, found that more than 80% of the intersubject variance (during reading) could be explained by the first two components. The data were then projected in this lower dimensional space. The GMM algorithm was repeated with different numbers of subgroups as input. The model with the highest evidence for explaining the data identified three subgroups. The size of these subgroups varied with 42, 22, and 12 subjects, respectively. We then segregated the largest subgroup (with 42 subjects) into two smaller subgroups using the same procedure. This resulted in a total of four subgroups, with 13 subjects in Subgroup 1, 29 subjects in Subgroup 2, 22 subjects in Subgroup 3, and 12 subjects in Subgroup 4.
Relationship of GMM Subgroups to the Demographic Profiles
Having identified four different subgroups of subjects using the GMM procedure, we then considered whether these subgroups could be explained by demographic variables (sex, hand dominance, and age) or to the stimulus set (as described in the Methods section, half the subjects read Stimulus Set A and the other half read Stimulus Set B). The significance of these group differences were assessed using chi-square tests, after transforming the subject numbers in each GMM subgroup into relative proportions according to the demographic categorization. The results, illustrated in Figure 2, show that the partitioning of left- versus right-handers and males versus females across the GMM subgroups was not significantly different from random repartition [for hand dominance: χ2(3) = 3.06, p > .38; for sex: χ2(3) = 2.10, p > .5]. Likewise, there was no significant effect of stimulus set [χ2(3) = 3.77, p > .28]. However, there was an interaction between the GMM subgroups and the age variable [χ2(6) = 28.958, p < .001]. Specifically, there were significantly more adolescents in Subgroup 1 (n = 9) than in the other subgroups (see Figure 2).
Figure 2.
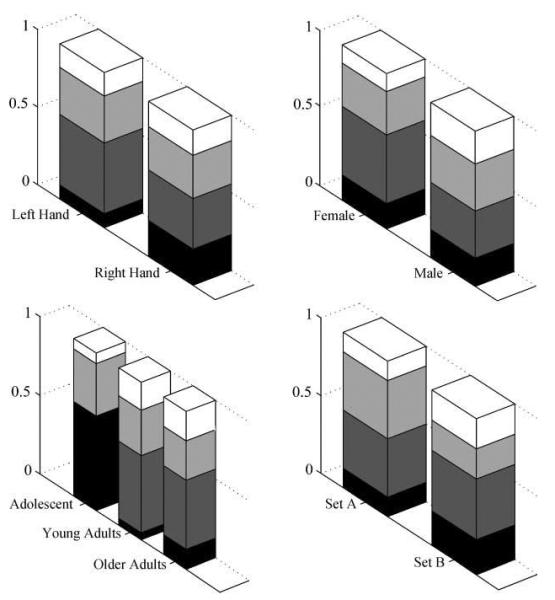
Repartition of subjects in each category into their GMM groups. The columns represent the proportion of subjects in each GMM subgroup when they are categorized according to their handedness (top left), sex (top right), age (bottom left), and stimulus set (bottom right). Subgroup 1 = black; Subgroup 2 = dark gray; Subgroup 3 = light gray; and Subgroup 4 = white.
Regional Activations in the Voxel-by-Voxel Analysis
A conventional between-group second-level ANOVA identified commonalities and differences in regional activation, at the voxel level, for the four subgroups of subjects identified by GMM. All subgroups activated regions in bilateral occipito-temporal cortices (medial and lateral to the occipito-temporal sulcus), superior and middle temporal gyri, and motor and premotor cortices (see Figure 3, top).
Figure 3.
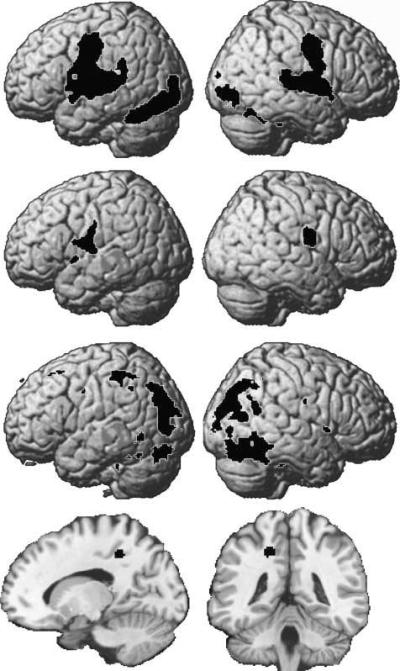
Regional differences in brain activation for the different GMM groups. Top row shows left and right hemisphere activation for reading aloud that was significant at p < .001, uncorrected in each of the four groups. Rows 2, 3, and 4 show activations for Subgroups 2, 3, and 4, respectively, after comparing each subgroup to all others. There was no additional activation for Subgroup 1 (not shown). Activation for Subgroup 4 is shown on coronal and sagittal slices at y = −42 and x = −18. All images are thresholded at p < .001 with >10 voxels.
Significant differences between the subgroups (at p < .05, corrected for multiple comparisons across the whole brain) are detailed in Table 2 and illustrated in the lower three rows of Figure 3. Subgroup 1 activated the common system but did not show any differentially high activation compared to any of the other groups. Subgroup 2 had more bilateral ventral premotor activation than the other groups. Subgroup 3 had more activation in the bilateral occipital cortex and a left dorsal parietal region, whereas Subgroup 4 activated a region in the vicinity of the left cingulate sulcus which borders the posterior cingulate and the precuneus.
Table 2.
Regional Activation Differences for the GMM Groups at p < .05, Corrected for Whole Brain
| GMM Groups |
Anatomical Regions | Cluster Size |
Coordinates |
Z Values |
|||||||||||
|---|---|---|---|---|---|---|---|---|---|---|---|---|---|---|---|
| x | y | z | G1 > All | G2 > All | G3 > All | G4 > All | G1 | G2 | G3 | G4 | |||||
| Group 2 | Premotor | BA 6 | R | 436 | 58 | −6 | 20 | – | 5.3 | – | – | 4.0 | 15.3 | 11.7 | 5.8 |
| Premotor | BA 6 | L | 420 | −58 | −8 | 14 | – | 4.8 | – | – | 4.6 | 14.7 | 11.7 | 5.3 | |
| Group 3 | Cerebellum/Occipital | 2553 | |||||||||||||
| Cerebellum | L | −14 | −80 | −18 | – | – | 6.4 | – | 1.8 | 3.0 | 12.0 | 3.4 | |||
| R | 10 | −80 | −16 | – | – | 7.2 | – | 2.4 | 4.5 | 15.5 | 6.5 | ||||
| R | 6 | −78 | −30 | – | – | 5.4 | – | 2.0 | 3.6 | 10.7 | 3.9 | ||||
| R | 28 | −76 | −18 | – | – | 5.6 | – | 2.8 | 6.0 | 13.2 | 6.3 | ||||
| Lingual gyrus | BA 18 | L | −14 | −84 | −4 | – | – | 5.2 | – | ns | 4.4 | 10.1 | 3.4 | ||
| 0 | −84 | 4 | – | – | 6.7 | – | 5.1 | 6.1 | 15.6 | 4.7 | |||||
| 0 | −84 | −10 | – | – | 6.0 | – | 1.8 | 3.1 | 11.8 | 4.5 | |||||
| R | 2 | −88 | −8 | – | – | 6.2 | – | 2.0 | 4.6 | 12.4 | 3.8 | ||||
| R | 6 | −70 | −2 | – | – | 5.4 | – | 2.1 | 2.7 | 10.5 | 3.7 | ||||
| R | 8 | −78 | −6 | – | – | 6.5 | – | 1.7 | 4.7 | 14.2 | 6.9 | ||||
| R | 16 | −72 | −8 | – | – | 6.1 | – | ns | 3.2 | 10.7 | 3.7 | ||||
| Cuneus | BA 18 | L | −12 | −92 | 20 | – | – | 5.5 | – | ns | ns | 8.7 | 3.1 | ||
| L | −6 | −90 | 8 | – | – | 6.6 | – | 1.9 | 5.8 | 14.2 | 5.3 | ||||
| 0 | −78 | 14 | – | – | 6.5 | – | 4.0 | 6.2 | 15.3 | 6.2 | |||||
| R | 4 | −80 | 22 | – | – | 6.4 | – | 1.6 | 4.3 | 13.3 | 5.6 | ||||
| R | 12 | −86 | 14 | – | – | 5.9 | – | 2.2 | 3.9 | 12.2 | 5.0 | ||||
| R | 32 | −88 | 18 | – | – | 5.3 | – | ns | 4.8 | 10.1 | 4.7 | ||||
| Fusiform | BA 37 | R | 24 | 44 | −64 | −20 | – | – | 5.4 | – | 1.7 | 6.0 | 11.5 | 4.2 | |
| R | 42 | −68 | −20 | – | – | 5.4 | – | 2.9 | 5.6 | 12.0 | 4.5 | ||||
| Inf. parietal | BA 40 | L | 14 | −46 | −38 | 56 | – | – | 5.0 | – | ns | ns | 6.6 | ns | |
| Group 4 | Cingulate | BA 32 | L | 68 | −18 | −42 | 44 | – | – | – | 4.9 | ns | −3.1 | ns | 4.8 |
Regional activation differences for the GMM subgroups were identified across the whole brain by comparing each subgroup to all others (p < .05 after family-wise correction for multiple comparisons). The anatomical location, Brodmann's area, hemisphere (L = left, R = Right), cluster size (number of voxels at p < .001 uncorrected), x, y, and z MNI coordinates, and Z scores are reported in the first columns. The last four columns show the Z scores at these coordinates for reading aloud relative to fixation in each subgroup in isolation. Values in bold are those that are significant after whole-brain multiple correction.
In our regions of interest, Group 3 showed more activation than the other three groups in the left dorsal premotor cortex (previously associated with nonsemantic pseudoword reading), Group 4 showed more activation than all the other groups in the pars orbitalis (previously associated with semantic reading of irregularly spelled words), and Group 2 showed most activation in the left pars opercularis (previously associated with more activation for reading both pseudowords and irregularly spelled words than regular words) (see Table 3a for details).
Table 3.
Activation in Left Inferior Frontal Regions of Interest for (a) Reading in Each Subgroup Relative to All Others; (b) Reading–Fixation, Reading–Symbol, and Reading–Naming for Each Subgroup Individually
| (a) Between-group Comparison in Left Inferior Frontal Regions of Interest | |||||
|---|---|---|---|---|---|
|
| |||||
| Z Values |
|||||
| Test | (A) Dorsal Premotor (−48 −4 38) |
(B) Pars Opercularis (−54 6 26) |
(C) Pars Orbitalis (−42 32 −2) |
||
| G2 > all | – | 2.9 | – | ||
| G2 > G1 | 2.8 | 2.7 | – | ||
| G2 > G3 | – | 1.6 | – | ||
| G2 > G4 | ns | 2.6 | – | ||
| G3 > all | 3.4 | – | – | ||
| G3 > G1 | 3.8 | 1.8 | – | ||
| G3 > G2 | 1.7 | – | – | ||
| G3 > G4 | 2.7 | ns | – | ||
| G4 > all | – | – | 3.5 | ||
| G4 > G1 | 2.26 | – | 3.0 | ||
| G4 > G2 | – | – | 2.9 | ||
| G4 > G3 | – | – | 3.4 | ||
|
| |||||
| (b) Group-specific Activation in Left Inferior Frontal Regions of Interest | |||||
|
| |||||
|
Z Values
|
|||||
| Regions | Contrast | Group 1 | Group 2 | Group 3 | Group 4 |
|
| |||||
| (A) Premotor (−48 −4 38) | Reading vs. Fixation | 3.2 | 7.1 | 8.0 | 4.8 |
| Reading vs. Symbol | ns | 2.6 | 1.9 | 1.8 | |
| Reading vs. Naming | ns | ns | 2.6 | ns | |
| (B) Pars opercularis (−54 6 26) | Reading vs. Fixation | ns | 5.6 | 3.8 | 1.7 |
| Reading vs. Symbol | ns | 4.3 | ns | 1.6 | |
| Reading vs. Naming | 1.6 | 2.5 | 1.8 | ns | |
| (C) Pars orbitalis (−42 32 −2) | Reading vs. Fixation | ns | 2.9 | 1.8 | 5.3 |
| Reading vs. Symbol | ns | 1.7 | ns | 3.1 | |
| Reading vs. Naming | −2.85 | −2.23 | −2.65 | −2.64 | |
All effects are reported at p < .05, uncorrected for completeness.
Figures 4 and 5 illustrate that the four subgroups are clearly separable. This is more obvious when looking at the group mean activation in a multivariate space defined by several regions (Figure 5). A mixed ANOVA with regions and subgroups as factors showed significant main effects of regions [F(2, 94) = 17.65, p < .001] and subgroups [F(3, 47) = 3.5, p < .02] and a significant Region-by-Group interaction [F(6, 94) = 5.12, p < .001].
Figure 4.
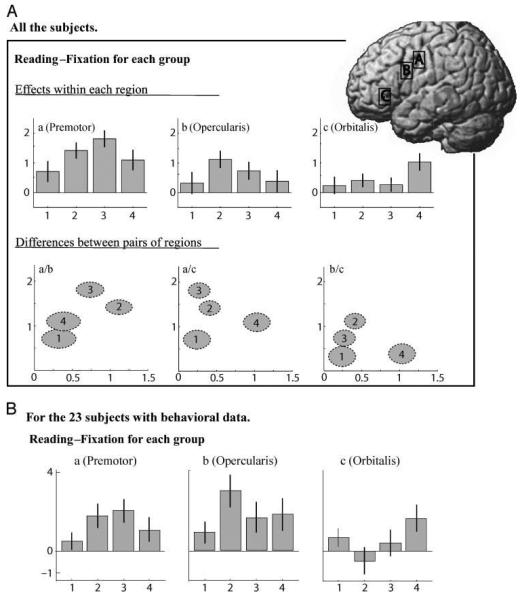
Group differences in activation for the three regions of interest for reading–fixation. Activation is shown for each of the GMM subgroups (1–4) in the dorsal premotor cortex (A), pars opercularis (B), and pars orbitalis (C). The bar-plots (top row) display the main effect of reading–fixation in the three regions for the four GMM subgroups (bars represent the 95% confidence interval). In the next row, activation is plotted in one region relative to another. Here, each subgroup appears as an ellipsoid, the diameter of which is proportional to the standard error in each direction (i.e., when the ellipsoid is elongated in one direction, there is bigger variance around the mean of the subgroup for the region represented by this direction). The lower part of the figure (B) replicates the top row of the figure after excluding all the subjects who do not have available behavioral data.
Figure 5.
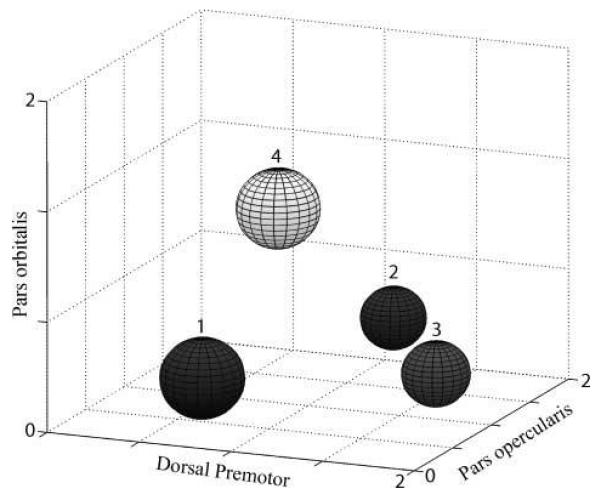
Dissociable group responses in the three inferior frontal regions of interest for reading compared to fixation. This figure integrates the components of Figure 4 in three dimensions. It shows the mean effect size for each group, in the three ROIs: pars opercularis, dorsal premotor, pars orbitalis. The size of the spheres is determined by the standard error in each dimension. Nonoverlapping spheres reflect the fact that the GMM subgroups are completely dissociated in the space as defined by these three regions.
Condition-specific Activation Profile in Regions of Interest
In the left dorsal premotor area associated with non-semantic reading, activation for reading relative to picture naming was highest in Subgroup 3 (see Figure 6 and Table 3b). Conversely, in the left pars orbitalis area associated with semantic processing, activation for reading relative to saying “1,2,3” to symbols was highest for Subgroup 4. The role of left pars orbitalis in semantic processing is consistent with our observation that activation in this region was higher for picture naming than reading across all groups (see Table 3b). These response profiles within our own data are consistent with our hypothesized dissociation in frontal activation based on the results from previous studies. In addition, we note that activation in the left pars opercularis was higher for Subgroup 2 than for any other group in the comparison of reading to saying “1,2,3” to symbols and reading to picture naming.
Figure 6.
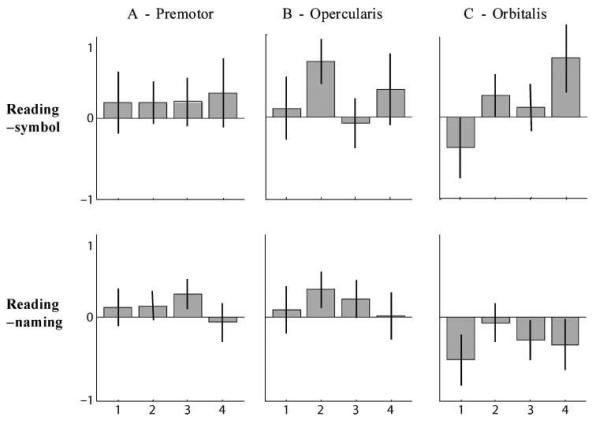
Contrast estimates in the three inferior frontal regions of interest for reading–symbol and reading–naming. Activation is shown for each of the GMM subgroups (1–4) in the dorsal premotor cortex (A), pars opercularis (B), and pars orbitalis (C). The top row displays the main effect of reading–symbol, the lower row shows the main effect of reading–naming for the same regions.
Relationship of GMM Subgroups to Hemispheric Dominance
Within our sample, the LI varied from +1 (strongly left lateralized) to −1.0 (strongly right lateralized). The distribution of LI for reading activation within subgroups is shown in Figure 7. This graph shows that the majority of the subjects have a bilateral representation of activity during reading aloud relative to fixation (i.e., 76% of our subjects have |LI| < 0.2); however, left hemispheric dominance is most pronounced for the subjects in Subgroup 1. This was confirmed with an ANOVA on the LIs, which showed a significant effect of subgroups [F(3, 72) = 5.17, p < .003], but only due to the subjects in the first subgroup being more lateralized than the other three subgroups (i.e., mean of LI: Subgroup 1 = 0.24, Subgroup 2 = 0.07, Subgroup 3 = 0.07, and Subgroup 4 = 0.06). Post hoc tests using multiple comparison procedures (Tukey–Kramer correction) showed that the mean LI of Subgroup 1 was different from the mean of the other subgroups [t(74) = 3.94, p < .001], with no significant difference between the remaining three subgroups (p > .05).
Figure 7.
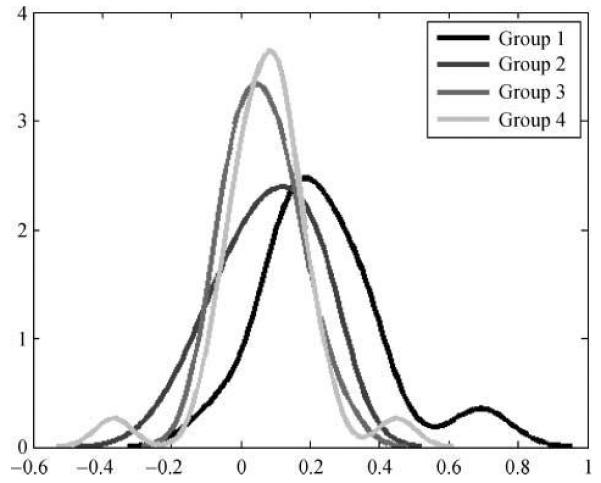
Laterality indices (LIs) for the four GMM groups. The LI for each subject is plotted within a distribution for each GMM group. The x-axis is the LI with positive values indicating brain activation asymmetry toward the left hemisphere and negative values indicating asymmetry toward the right hemisphere. The y-axis is the number of subjects for each LI value.
Relationship of GMM Subgroups to the Behavioral Measures
The available behavioral scores for each subgroup are summarized in Table 4, which reports results from reading, spelling, phonological, and other verbal and nonverbal tests. The comparison of scores across groups demonstrates that (i) all our subjects had good verbal skills; (ii) there was a wide range of ability in each group; and (iii) the groups were extraordinarily well matched in their abilities. However, the absence of significant differences does not provide any indication of how the groups varied behaviorally. To ensure that the subjects with behavioral data were representative of their groups, we recomputed the ANOVA used in our second post hoc analysis (see above). This demonstrates that the group differences in activation patterns for reading aloud familiar words remains despite the absence of behavioral differences (see Figure 4B). Our behavioral data were therefore drawn from a representative sample.
Table 4.
Post hoc Summary of Behavioral Data in a Subset of Right-handed Subjects
| GMM Groups | Group 1 | Group 3 | Group 2 | Group 4 |
|---|---|---|---|---|
| No. of subjects | 8 | 5 | 6 | 4 |
| Age | ||||
| Mean | 14 | 14 | 31 | 36 |
| Range | 13–16 | 13–14 | 22–51 | 21–65 |
| VIQ | ||||
| Mean | 119 | 125 | 119 | 113 |
| Range | 100–133 | 108–136 | 108–133 | 101–125 |
| PIQ | ||||
| Mean | 112 | 112 | 115 | 118 |
| Range | 90–125 | 97–122 | 106–128 | 106–132 |
| FSIQ | ||||
| Mean | 118 | 121 | 119 | 116 |
| Range | 94–128 | 111–130 | 108–135 | 109–132 |
| Vocabulary | ||||
| Mean | 45 | 45 | 51 | 52 |
| Range | 35–50 | 32–53 | 38–57 | 42–57 |
| Reading | ||||
| Mean | 52 | 48 | 37 | 38 |
| Range | 48–55 | 46–55 | 32–42 | 33–45 |
| Spelling | ||||
| Mean | 43 | 39 | 32 | 33 |
| Range | 39–49 | 40–47 | 28–35 | 31–35 |
| Spoonerisms | ||||
| Mean | 27 | 25 | 21 | 18 |
| Range | 21–30 | 19–29 | 13–24 | 14–22 |
Tests for adolescents (Groups 1 and 3) had different stimuli than those for adults (Groups 2 and 4) but the task instructions were identical across groups. IQ measurements were from the WISC (for adolescents) and the WAIS (for adults). IQ scores have been scaled for age and should therefore be comparable across the different age groups. VIQ = verbal IQ; PIQ = performance IQ; FIQ = full-scale IQ. Vocabulary involved a verbal description of an auditory presented word (from the WISC for adolescents and the WAIS for adults). Reading and spelling were assessed with the Wide Range Achievement Test (WRAT). “Spoonerisms” is a test of phonological memory and manipulation from the phonological assessment battery (Frederickson et al., 1997). It involves listening to two auditorily presented words (“lantern” and “basket”) followed by verbal repetition after switching the two initial phonemes (“bantern” and “lasket”).
DISCUSSION
Measuring the variability between subjects is at the core of any fMRI group study analysis. This allows us to discriminate reliable and systematic activation from noise, delineate regions that support normal sensorimotor or cognitive functions, and define the normative boundaries that can be used to assess potential dysfunctional patterns in patient populations. The aim of the current article was to investigate the components of intersubject variation in task-dependent brain activations, and test whether this was due to random noise or whether there is a clear structure in the intersubject variability that might be explained by demographic/reading strategy differences. The first explanation, which forms the basis for our null hypothesis, is that intersubject differences are due to noise. Noise is inherent to fMRI data collection, for instance, scanner artifacts and physiologic noise can produce idiosyncratic variation that can appear as false-positive activation peculiar to one individual. The alternative hypothesis is that intersubject variability reflects meaningful differences in the brain systems used to perform the same task (Seghier, Friston, & Price, 2007; Price & Mechelli, 2005; Kherif et al., 2003; Price & Friston, 2002; Edelman & Gally, 2001). We tested these two hypotheses using a GMM approach. Our results successfully dissociated four different patterns of reading activation and, therefore, support the alternative hypothesis. Indeed, we show that 80% of the observed variability in the data were explained by four subgroups, with three out of the four subgroups showing an independent contribution over and above a common activation pattern.
Having identified four different subgroups of subjects, we then investigated whether differences in demographics (sex, handedness, or age) could explain the variance. There was no significant effect of either handedness or sex. However, there was a significant effect of age because there was a disproportionate number of adolescents in Subgroup 1. Critically, this age effect cannot be explained by differences in reading accuracy because there were no differences in mean accuracy for the different age categories and the fMRI statistical analysis excluded trials with errors. The age effect is also unlikely to be explained by slower reading times in the younger group. Although we were unable to analyze voice onset times in the scanner, we know from other studies that increased reading times are associated with increased activation, particularly in the prefrontal cortices (Binder et al., 2005). However, Subgroup 1 showed less activation in all regions (including pre-frontal cortices) relative to the other three subgroups. Therefore, if anything, the data suggest their responses may have been faster but we would need further experiments to investigate this hypothesis. The only distinguishing characteristic in the activation pattern for Subgroup 1 was that activation was significantly more left lateralized than the other groups. This is likely to be a natural consequence of the fact that this subgroup had a disproportionate number of adolescents and the adolescents were all right-handed which, in turn, is associated with less right hemisphere activation for language tasks. In addition, it is also possible that less activation in sensorimotor and frontal regions for Subgroup 1 relative to the other subgroups (see Tables 2 and 3) may have unveiled left-lateralized language processing.
Aside from demographic factors, we also considered how differences in group activation patterns could be explained by different reading strategies. Here, the assumption is that different brain regions execute different functions that, nevertheless, lead to the same output. The alternative explanation is that activation differences result from the same function being computed by different brain regions in different individuals. We can explore differences in functional strategy by comparing (a) activation differences between subjects to (b) activation differences within subjects (who have a constant functional anatomy). Our a priori prediction was that some subjects might activate areas associated with semantic reading more than areas associated with nonsemantic reading, whereas other subjects may activate nonsemantic reading areas more than semantic reading areas. Our regions of interest were therefore based on within-subject results from previous studies showing that left dorsal premotor activation increases with the demands on nonsemantic reading, whereas left orbitalis activation increases with the demands on semantic reading. We also confirmed the a priori definitions of these regions within our own subjects by comparing activation for picture naming (which relies on semantic processing) to reading (which is less reliant on semantic processing). This demonstrated that, consistent with our a priori predictions, the pars orbitalis was more activated for picture naming (semantic processing), whereas the left premotor and pars opercularis were more activated for reading. Below, we discuss the unique activation profiles for Subgroups 4, 3, and 2, and the implications of these findings for intersubject variability in reading strategy.
Subgroup 4 showed stronger activation in the pars orbitalis than the other groups and the coordinates for this effect (x = −42, y = 32, z = −2) are very close to those reported by Binder et al. (2005) for reading words with irregular spellings (x = −39, y = 25, z = −9). Enhanced activation in Subgroup 4 therefore suggests that Subgroup 4 may have been more reliant on a semantic reading strategy than the other groups. At the whole-brain level, Subgroup 4 (relative to the other groups) also showed significantly more activation in a region that bordered the left posterior cingulate and the left precuneus. We do not know the precise role that this region plays in reading. However, it is interesting to note that both posterior cingulate and precuneus activation have been reported for reading familiar words with regular spellings relative to unfamiliar pseudowords (Binder et al., 2005; Ischebeck et al., 2004). Thus, Subgroup 4 showed increased activation in areas associated with reading familiar relative to unfamiliar words, consistent with the use of a semantic reading strategy.
Subgroup 3 showed highest activation in the left dorsal premotor region associated with pseudoword reading but low activation in the pars orbitalis. In addition, Subgroup 3 showed more activation than the other groups in bilateral occipital and cerebellar regions. There are many possible explanations for the occipital activations. For example, they may reflect visual processing differences that were inherent to the subjects themselves, be introduced by unknown variables in the scanning environment, or be a consequence of slow nonsemantic reading. These hypotheses need further investigation.
Finally, Subgroup 2 showed increased activation in bilateral ventral premotor areas that have previously been shown to be more activated by reading than object naming (Price et al., 2006; Bookheimer, Zeffiro, Blaxton, Gaillard, & Theodore, 1995) consistent with the demands placed on sublexical articulation. In our prefrontal regions of interest, Subgroup 2 showed increased activation in the left pars opercularis (relative to all other groups) and the left dorsal premotor cortex (relative to Subgroups 1 and 4). Both these areas are consistently more activated for reading unfamiliar pseudowords than familiar words (Binder et al., 2005; Mechelli, GornoTempini, & Price, 2003). This contrasts with the observation that Subgroup 4 showed increased activation in areas associated with reading familiar relative to unfamiliar words. Thus, Subgroup 2 showed more nonsemantic reading activation than Subgroup 1 or 4 but a different pattern of nonsemantic reading than Subgroup 3. Future studies are needed to determine the functional dissociation between premotor activation (Subgroup 3) and postcentral activation (Subgroup 2).
Contributions and Future Investigations
To summarize, we used a previously described method to characterize intersubject variability in reading aloud familiar words. Understanding the nature and extent of intersubject variation is critical for understanding the neural basis of reading aloud in normal and abnormal populations. In normal populations, intersubject variability introduces inconsistencies between studies that can only be explained by a full characterization of subject differences (Kherif et al., 2003). For example, activation in the posterior cingulate and precuneus is not consistently reported in fMRI studies of reading aloud. However, here we show that it is activated by a subset of our subjects and may therefore be linked to a particular reading strategy that remains to be fully explored. Understanding intersubject variability is also very important for interpreting patient studies. For example, patient activation might be categorized as abnormal in comparison to one of our subgroups but normal in comparison to another of our subgroups. Finally, our results are surprising in that the most prominent group differences in activation did not correspond to known demographic characteristics or lateralization differences, as expected on the basis of the previous literature (see Introduction).
With respect to future studies, there are many ways that our results could be further explored. For example, our multivariate method uses correlations between regions to dissociate the subgroups. Group differences in the connectivity pattern between regions could therefore be investigated. Specifically, the functional connectivity results of Mechelli et al. (2005) predict that subjects using a semantic reading strategy will show stronger functional connectivity between semantic regions than subjects using a nonsemantic reading strategy. Further behavioral studies are also needed to characterize the groups. For example, we can explore whether activation for reading aloud high-frequency regular words is influenced by the subjects ability to read low-frequency irregularly spelled words versus pseudowords. Alternatively, it might be the case that there are no categorical differences in the reading abilities of the different subgroups. Instead, each subject may change their strategy for reading familiar words on a trial-to-trial or day-to-day basis. This could be investigated by exploring how activation at the individual subject level changes on a trial-by-trial basis and collecting a second set of data from the same individuals to test whether their grouping changes. Finally, future applications of the method will be able to assess whether the differences we observed between groups for reading are also observed in other language or non-language-based tasks.
Acknowledgments
This work was funded by the Wellcome Trust and the James S. MacDonnell Foundation (conducted as part of the NRG initiative). We thank our three radiographers (Amanda Brennan, Janice Glensman, and David Bradbury) and the following people for recruiting subjects and helping with fMRI and behavioral data collection: Clare Shakeshaft, Laura Stewart, Tom Schofield, Alice Grogan, Anneke Haddad, Fulden Barbur, Caroline Ellis, and Odette Megnin. Our special thanks also to Hwee Ling Lee for her invaluable help setting up the database and to Alex Leff and two anonymous reviewers for their helpful suggestions on an earlier version of the manuscript.
REFERENCES
- Baron J, Strawson C. Use of orthographic and word specific knowledge in reading words aloud. Journal of Experimental Psychology: Human Perception and Performance. 1976;2:386–393. [Google Scholar]
- Binder JR, McKiernan KA, Parsons ME, Westbury CF, Possing ET, Kaufman JN, et al. Neural correlates of lexical access during visual word recognition. Journal of Cognitive Neuroscience. 2003;15:372–393. doi: 10.1162/089892903321593108. [DOI] [PubMed] [Google Scholar]
- Binder JR, Medler DA, Desai R, Conant LL, Liebenthal E. Some neurophysiological constraints on models of word naming. Neuroimage. 2005;27:677–693. doi: 10.1016/j.neuroimage.2005.04.029. [DOI] [PubMed] [Google Scholar]
- Binder JR, Swanson SJ, Hammeke TA, Morris GL, Mueller WM. Determination of language dominance using functional MRI: A comparison with the Wada test. Neurology. 1996;46:978. doi: 10.1212/wnl.46.4.978. [DOI] [PubMed] [Google Scholar]
- Bookheimer SY, Zeffiro IA, Blaxton T, Gaillard W, Theodore W. Regional cerebral blood flow during object naming and word reading. Human Brain Mapping. 1995;3:93–106. [Google Scholar]
- Booth JR, Burman DD, Van Santen FW, Harasaki Y, Gitelman DR, Parrish TB, et al. The development of specialized brain systems in reading and oral-language. Child Neuropsychology. 2001;7:119–141. doi: 10.1076/chin.7.3.119.8740. [DOI] [PubMed] [Google Scholar]
- Brem S, Bucher K, Halder P, Summers P, Dietrich T, Martin E, et al. Evidence for developmental changes in the visual word processing network beyond adolescence. Neuroimage. 2006;29:822–837. doi: 10.1016/j.neuroimage.2005.09.023. [DOI] [PubMed] [Google Scholar]
- Cabeza R. Cognitive neuroscience of aging: Contributions of functional neuroimaging. Scandinavian Journal of Psychology. 2001;42:277–286. doi: 10.1111/1467-9450.00237. [DOI] [PubMed] [Google Scholar]
- Cohen G. Language comprehension in old age. Cognitive Psychology. 1979;11:412–429. doi: 10.1016/0010-0285(79)90019-7. [DOI] [PubMed] [Google Scholar]
- Coltheart M, Curtis B, Atkins P, Haller M. Models of reading aloud: Dual-route and parallel-distributed-processing approaches. Psychological Review. 1993;100:589–608. [Google Scholar]
- Connor CM, Morrison FJ, Fishman BJ, Schatschneider C, Underwood P. The early years—Algorithm-guided individualized reading instruction. Science. 2007;315:464–465. doi: 10.1126/science.1134513. [DOI] [PubMed] [Google Scholar]
- D'Esposito M, Zarahn E, Aguirre G, Rypma B. The effect of normal aging on the coupling of neural activity to the bold hemodynamic response. Neuroimage. 1999;20:2197–2208. doi: 10.1006/nimg.1999.0444. [DOI] [PubMed] [Google Scholar]
- Devlin JT, Matthews PM, Rushworth MFS. Semantic processing in the left inferior prefrontal cortex: A combined functional magnetic resonance imaging and transcranial magnetic stimulation study. Journal of Cognitive Neuroscience. 2003;15:71–84. doi: 10.1162/089892903321107837. [DOI] [PubMed] [Google Scholar]
- Edelman GM, Gally JA. Degeneracy and complexity in biological systems. Proceedings of the National Academy of Sciences, U.S.A. 2001;98:13763–13768. doi: 10.1073/pnas.231499798. [DOI] [PMC free article] [PubMed] [Google Scholar]
- Fiebach CJ, Friederici AD, Muller K, von Cramon DY. fMRI evidence for dual routes to the mental lexicon in visual word recognition. Journal of Cognitive Neuroscience. 2002;14:11–23. doi: 10.1162/089892902317205285. [DOI] [PubMed] [Google Scholar]
- Fiez JA. Phonology, semantics, and the role of the left inferior prefrontal cortex. Human Brain Mapping. 1997;5:79–83. [PubMed] [Google Scholar]
- Frederickson N, Frith U, Reason R. Phonological Assessment Battery. Manual and Test Materials. NFER-Nelson; UK: 1997. [Google Scholar]
- Freebody P, Byrne B. Word-reading strategies in elementary-school children—Relations to comprehension, reading time, and phonemic awareness. Reading Research Quarterly. 1988;23:441–453. [Google Scholar]
- Friederici AD. The neural basis of language development and its impairment. Neuron. 2006;52:941–952. doi: 10.1016/j.neuron.2006.12.002. [DOI] [PubMed] [Google Scholar]
- Friston K, Mattout J, Trujillo-Barreto N, Ashburner J, Penny W. Variational free energy and the Laplace approximation. Neuroimage. 2007;34:220–234. doi: 10.1016/j.neuroimage.2006.08.035. [DOI] [PubMed] [Google Scholar]
- Frost JA, Binder JR, Springer JA, Hammeke TA, Bellgowan PS, Rao SM, et al. Language processing is strongly left lateralized in both sexes. Evidence from functional MRI. Brain. 1999;122:199–208. doi: 10.1093/brain/122.2.199. [DOI] [PubMed] [Google Scholar]
- Hayes M, Masterson J. Paap and Noel revisited: Individual differences in independent word recognition tasks in relation to the dual-task paradigm. Quarterly Journal of Experimental Psychology: A, Human Experimental Psychology. 2002;55:855–878. doi: 10.1080/02724980143000460. [DOI] [PubMed] [Google Scholar]
- Ischebeck A, Indefrey P, Usui N, Nose I, Hellwig F, Taira M. Reading in a regular orthography: An FMRI study investigating the role of visual familiarity. Journal of Cognitive Neuroscience. 2004;16:727–741. doi: 10.1162/089892904970708. [DOI] [PubMed] [Google Scholar]
- Kello CT, Plaut DC. Strategic control over rate of processing in word reading: A computational investigation. Journal of Memory and Language. 2003;48:207–232. [Google Scholar]
- Kherif F, Poline JB, Flandin G, Benali H, Simon O, Dehaene S, et al. Multivariate model specification for fMRI data. Neuroimage. 2002;16:1068–1083. doi: 10.1006/nimg.2002.1094. [DOI] [PubMed] [Google Scholar]
- Kherif F, Poline JB, Meriaux S, Benali H, Flandin G, Brett M. Group analysis in functional neuroimaging: Selecting subjects using similarity measures. Neuroimage. 2003;20:2197–2208. doi: 10.1016/j.neuroimage.2003.08.018. [DOI] [PubMed] [Google Scholar]
- Langenecker SA, Nielson KA, Rao SM. fMRI of healthy older adults during Stroop interference. Neuroimage. 2004;21:192–200. doi: 10.1016/j.neuroimage.2003.08.027. [DOI] [PubMed] [Google Scholar]
- McDermott KB, Petersen SE, Watson JM, Ojemann JG. A procedure for identifying regions preferentially activated by attention to semantic and phonological relations using functional magnetic resonance imaging. Neuropsychologia. 2003;41:293–303. doi: 10.1016/s0028-3932(02)00162-8. [DOI] [PubMed] [Google Scholar]
- McGlone J. Behavioral and Brain Sciences. 1980;3:215–263. [Google Scholar]
- McLachlan GJ, Peel D, Whiten WJ. Maximum likelihood clustering via normal mixture models. Signal Processing: Image Communication. 1996;8:105–111. [Google Scholar]
- Mechelli A, Crinion JT, Long S, Friston KJ, Lambon Ralph MA, Patterson K. Dissociating reading processes on the basis of neuronal interactions. Journal of Cognitive Neuroscience. 2005;17:1753–1765. doi: 10.1162/089892905774589190. [DOI] [PubMed] [Google Scholar]
- Mechelli A, Gorno-Tempini ML, Price CJ. Neuroimaging studies of word and pseudoword reading: Consistencies, inconsistencies, and limitations. Journal of Cognitive Neuroscience. 2003;15:260–271. doi: 10.1162/089892903321208196. [DOI] [PubMed] [Google Scholar]
- Nagata SI, Uchimura K, Hirakawa W, Kuratsu JI. Method for quantitatively evaluating the lateralization of linguistic function using functional MR imaging. AJNR, American Journal of Neuroradiology. 2001;22:985–991. [PMC free article] [PubMed] [Google Scholar]
- Noppeney U, Penny WD, Price CJ, Flandin G, Friston KJ. Identification of degenerate neuronal systems based on intersubject variability. Neuroimage. 2006;30:885–890. doi: 10.1016/j.neuroimage.2005.10.010. [DOI] [PubMed] [Google Scholar]
- Paap KR, Noel RW. Dual-route models of print to sound: Still a good horse race. Psychological Research. 1991;53:13–24. [Google Scholar]
- Penny W, Friston K. Mixtures of general linear models for functional neuroimaging. IEEE Transactions on Medical Imaging. 2003;22:504–514. doi: 10.1109/TMI.2003.809140. [DOI] [PubMed] [Google Scholar]
- Penny W, Kiebel S, Friston K. Variational Bayesian inference for fMRI time series. Neuroimage. 2003;19:727–741. doi: 10.1016/s1053-8119(03)00071-5. [DOI] [PubMed] [Google Scholar]
- Poldrack RA, Wagner AD, Prull MW, Desmond JE, Glover GH, Gabrieli JD. Functional specialization for semantic and phonological processing in the left inferior prefrontal cortex. Neuroimage. 1999;10:15–35. doi: 10.1006/nimg.1999.0441. [DOI] [PubMed] [Google Scholar]
- Price CJ, Friston KJ. Degeneracy and cognitive anatomy. Trends in Cognitive Sciences. 2002;6:416–421. doi: 10.1016/s1364-6613(02)01976-9. [DOI] [PubMed] [Google Scholar]
- Price CJ, McCrory E, Noppeney U, Mechelli A, Moore CJ, Biggio N, et al. How reading differs from object naming at the neuronal level. Neuroimage. 2006;29:643–648. doi: 10.1016/j.neuroimage.2005.07.044. [DOI] [PubMed] [Google Scholar]
- Price CJ, Mechelli A. Reading and reading disturbance. Current Opinion of Neurobiology. 2005;15:231–238. doi: 10.1016/j.conb.2005.03.003. [DOI] [PubMed] [Google Scholar]
- Pujol J, Deus J, Losilla JM, Capdevila A. Cerebral lateralization of language in normal left-handed people studied by functional MRI. Neurology. 1999;52:1038–1043. doi: 10.1212/wnl.52.5.1038. [DOI] [PubMed] [Google Scholar]
- Rissman J, Eliassen JC, Blumstein SE. An event-related fMRI investigation of implicit semantic priming. Journal of Cognitive Neuroscience. 2003;15:1160–1175. doi: 10.1162/089892903322598120. [DOI] [PubMed] [Google Scholar]
- Rotte M. Age-related differences in the areas of Broca and Wernicke using functional magnetic resonance imaging. Age and Ageing. 2005;34:609–613. doi: 10.1093/ageing/afi186. [DOI] [PubMed] [Google Scholar]
- Sass SM, Legge GE, Lee HW. Low-vision reading speed: Influences of linguistic inference and aging. Optometry and Vision Science. 2006;83:166–177. doi: 10.1097/01.opx.0000204752.43520.17. [DOI] [PubMed] [Google Scholar]
- Seghier ML. Laterality index in functional MRI: Methodological issues. Magnetic Resonance Imaging. 2008;26:594–601. doi: 10.1016/j.mri.2007.10.010. [DOI] [PMC free article] [PubMed] [Google Scholar]
- Seghier ML, Friston KJ, Price CJ. Detecting subject-specific activations using fuzzy clustering. Neuroimage. 2007;36:594–605. doi: 10.1016/j.neuroimage.2007.03.021. [DOI] [PMC free article] [PubMed] [Google Scholar]
- Shaywitz BA, Shaywitz SE, Pugh KR, Constable RT, Skudlarski P, Fulbright RK, et al. Sex differences in the functional organization of the brain for language. Nature. 1995;373:607–609. doi: 10.1038/373607a0. [DOI] [PubMed] [Google Scholar]
- Shaywitz BA, Skudlarski P, Holahan JM, Marchione KE, Constable RT, Fulbright RK, et al. Age-related changes in reading systems of dyslexic children. Annals of Neurology. 2007;61:363–370. doi: 10.1002/ana.21093. [DOI] [PubMed] [Google Scholar]
- Sommer IEC, Aleman A, Bouma A, Kahn RS. Do women really have more bilateral language representation than men?: A meta-analysis of functional imaging studies. Brain. 2004;127:1845–1852. doi: 10.1093/brain/awh207. [DOI] [PubMed] [Google Scholar]
- Szaflarski JP, Holland SK, Schmithorst VJ, Byars AW. fMRI study of language lateralization in children and adults. Human Brain Mapping. 2006;27:202–212. doi: 10.1002/hbm.20177. [DOI] [PMC free article] [PubMed] [Google Scholar]
- Verhaeghen P, Cerella J, Semenec SC, Leo MA, Bopp KL, Steitz DW. Cognitive efficiency modes in old age: Performance on sequential and coordinative verbal and visuospatial tasks. Psychology and Aging. 2002;17:558–570. doi: 10.1037//0882-7974.17.4.558. [DOI] [PubMed] [Google Scholar]
- Verhaeghen P, Steitz DW, Sliwinski MJ, Cerella J. Aging and dual-task performance: A meta-analysis. Psychology and Aging. 2003;18:443–460. doi: 10.1037/0882-7974.18.3.443. [DOI] [PubMed] [Google Scholar]
- Voyer D. On the magnitude of laterality effects and sex differences in functional lateralities. Laterality. 1996;1:51–83. doi: 10.1080/713754209. [DOI] [PubMed] [Google Scholar]
- Weiskopf N, Hutton C, Josephs O, Deichmann R. Optimal EPI parameters for reduction of susceptibility-induced BOLD sensitivity losses: A whole-brain analysis at 3 T and 1.5 T. Neuroimage. 2006;33:493–504. doi: 10.1016/j.neuroimage.2006.07.029. [DOI] [PubMed] [Google Scholar]