Abstract
Receptive fields of sensory neurons in the brain are usually restricted to a portion of the entire stimulus domain. At all levels of the gustatory neuraxis, however, there are many cells that are broadly tuned, i.e., they respond well to each of the basic taste qualities (sweet, sour, salty, and bitter). Although it might seem that this broad tuning precludes a major role for these cells in representing taste space, here we show the opposite—namely, that the tastant-specific temporal aspects (firing rate envelope and spike timing) of their responses enable each cell to represent the entire stimulus domain. Specifically, we recorded the response patterns of cells in the nucleus of the solitary tract (NTS) to representatives of four basic taste qualities and their binary mixtures. We analyzed the temporal aspects of these responses, and used their similarities and differences to construct the taste space represented by each neuron. We found that for the more broadly tuned neurons in the NTS, the taste space is a systematic representation of the entire taste domain. That is, the taste space of these broadly tuned neurons is three dimensional, with basic taste qualities widely separated and binary mixtures placed close to their components. Further, the way that taste quality is represented by the firing rate envelope is consistent across the population of cells. Thus, the temporal characteristics of responses in the population of NTS neurons, especially those that are more broadly tuned, produce a comprehensive and logical representation of the taste world.
Introduction
For any sensory modality, perception requires the construction of a representation of the perceptual space. The nervous system accomplishes this in a variety of ways. One strategy is to map the sensory domain onto an array of neurons (Chklovskii and Koulakov, 2004). Another strategy is to use labeled lines, in which each stimulus excites a dedicated subset of elements (Ahissar and Knutsen, 2008). In both cases, the representation is distributed across many neurons, and their differential tuning properties are crucial.
In central gustatory structures, some cells respond to a single taste quality (sweet, sour, salty, bitter, and perhaps umami), but most cells respond to more than one, sometimes with equal sensitivity. The spike counts of these broadly tuned responses provide only an equivocal indication of the identity of the stimulus. Presentation of mixtures of tastants of different qualities only adds to the confusion. We have shown that the across-neuron pattern (ANP) of responses can go a long way toward resolving these ambiguities by providing a reasonable representation of the taste world (Chen and Di Lorenzo, 2008). Because the ANP is based on taste-evoked spike counts, it relies on the contribution of narrowly tuned cells; more broadly tuned cells in this model only add noise to the message. However, Katz et al. (2001) have shown that the temporal dynamics of taste responses in the gustatory cortex can vary with taste quality, hinting that broadly tuned cells may convey more information than originally thought.
The sensory domain of gustation can be succinctly delineated by independent groups of similar-tasting chemicals, called taste qualities. The relationship among these basic taste qualities, and thus the geometry of the taste world, was first described by Henning (Erickson, 1984) as a three-dimensional tetrahedron in which each basic taste quality was placed at a vertex. The neural basis of this representation, however, remains the subject of debate.
In the nucleus tractus solitarius (NTS, the first synaptic relay in the central gustatory pathway), spike timing can often convey more information about taste stimuli than spike count alone (Di Lorenzo and Victor, 2003, 2007), especially when two stimuli are very similar (Roussin et al., 2008). These studies have shown that spike timing in the taste-evoked spike train in individual neurons can support discrimination of taste stimuli. This observation raises the possibility that the temporal characteristics of responses in NTS neurons can provide a representation of the entire taste world.
Here we show that this is indeed the case: temporal characteristics of individual neurons, especially those that are more broadly tuned, create a complete map of the taste domain. That is, although the number of spikes that are evoked by different taste stimuli can be so similar as to make them indistinct, consideration of spike timing and/or the firing rate envelope offers a means for clear separation. Thus, the more stimuli to which a cell responds, the more complete the representation of the taste world it provides.
Materials and Methods
Subjects.
Twenty-three male, Sprague Dawley rats (300–450 g) served as subjects for these experiments. All rats were pair-housed in plastic cages and maintained on a 12 h light–dark schedule with lights on at 7:00 A.M. Food and water were available ad libitum. All procedures were in accord with the National Institutes of Health Animal Welfare Guide and were approved by the Institutional Animal Care and Use Committee of Binghamton University.
Surgery and recording.
Rats were deeply anesthetized with urethane (1.5 g/kg, i.p., administered in two equal doses spaced 20 min apart) and prepared for electrophysiological recording in the NTS, as described previously (Di Lorenzo and Victor, 2003). Briefly, rats were tracheotomized and secured in a stereotaxic instrument (Kopf Instruments) with the tooth bar positioned 5.0 mm below the interaural line. The surface of the brainstem just above the NTS was then exposed, and a nontraumatic head holder was attached to screws embedded in the skull using dental acrylic cement. The ear and tooth bars were removed, while head position and orientation were preserved. Core temperature was maintained at 37°C by a heating pad coupled to an anal thermistor probe (FHC).
Etched tungsten microelectrodes, insulated except for the tip (18–20 MΩ, 1 V at 1 kHz) were lowered into the NTS. The NTS was located at ∼2.7 mm rostral and 1.8 mm lateral to the obex and 700–1400 μm ventral to the surface of the brainstem. As the electrode was lowered into the area near the NTS, the tongue was bathed with 0.1 m NaCl to test for a background taste response. To avoid sampling bias, every cell that was isolated was tested with all four basic taste stimuli.
Taste stimuli.
Taste stimuli consisted of the following: 0.1 m NaCl (N), 0.01 m HCl (H), 0.01 m quinine HCl (Q), and 0.5 m sucrose (S). The six binary mixtures (NH, NS, NQ, HS, HQ, and SQ) each consisted of components whose final concentration in the mixture equaled that of the single-component taste stimuli. These concentrations were chosen because they produce half-maximal responses in the chorda tympani nerve (CT; a branch of the facial nerve innervating taste buds on the rostral 2/3 of the tongue) of the rat (Ganchrow and Erickson, 1970; Ogawa et al., 1974). All stimuli were made with reagent grade chemicals, dissolved in distilled water, and presented at room temperature.
Taste stimuli were bathed over the tongue through a specially designed stimulus delivery system described previously (Di Lorenzo and Victor, 2003). The flow rate was 5 ml/s.
Testing.
Once a taste-responsive cell was isolated, testing began. Each of 10 tastants, i.e., four single-component taste stimuli (N, S, Q, and H) and six binary mixtures (NH, NS, NQ, HS, HQ, and SQ), were presented in individual trials. A trial consisted of a 10 s baseline (spontaneous activity), 10 s distilled water prerinse, 5 s tastant presentation, 5 s pause, and 20 s distilled water rinse. The interstimulus interval was 2 min. Two or three blocks of the four single-component tastants were alternated with two or three blocks of the six binary mixtures in a pseudorandom manner for as long as the cell remained well isolated. Stimulus delivery tubes were flushed well with distilled water when the stimulus to be delivered was changed.
Analysis of response magnitude and breadth of tuning.
Signals from single NTS cells were recorded with an amplifier (Model P511, Astro-Med) and sent to a PC computer via an analog-to digital interface (CED). Waveforms arising from single neurons were identified using the Spike2 program (CED, sampling rate 25 kHz). A 3:1 signal-to-noise ratio was required for isolation of NTS cells.
Response magnitude was defined as the rate of firing in spikes per second (sps) during the first 2 s of stimulus presentation minus the firing rate in the final 5 s of the water prerinse. A response that differed from the average firing rate during the water prerinse (last 5 s) by at least 2.54 SDs was defined as significant.
The breadth of tuning of taste-responsive NTS cells was measured via the standard uncertainty measure (Smith and Travers, 1979), calculated as follows:
 |
where Pi represents the number of spikes elicited by each stimulus expressed as a proportion of the total number of spikes elicited by the n stimuli, and K is a scaling constant. For four stimuli, K = 1.661, so that U ranges from 0 (cell responds to only one stimulus) to 1.0 (cell responds equally well to all stimuli).
Temporal features of taste responses.
To characterize the dependence of the temporal structure of taste responses on the taste stimuli, spike trains were analyzed using the metric space method (Victor and Purpura, 1996, 1997) (for review, see Victor, 2005). This approach determines whether a set of spike discharge patterns depends on a set of stimuli by measuring the degree of dissimilarity (a “distance”) between spike trains. Briefly, the dissimilarity between two spike trains is quantified by the minimum total “cost” of a series of elementary steps that transform one spike train into the other. A key parameter of the analysis is q (s−1), the cost to move a spike per unit time: the cost of moving a spike by an amount of time t is counted as qt. Additionally, the cost of inserting or deleting a spike is set at 1. The distance between two spike trains, denoted Dspike[q], is defined as the minimum total cost to transform one spike train into the other, via any sequence of these elementary steps (moving, inserting, or deleting). Note that when q is zero, the distance (minimum cost) in this metric is simply the difference of the number of spikes in each pair of responses. In this case (q = 0), Dspike[0] is denoted as Dcount. For larger values of q, Dspike[q] is sensitive to the temporal arrangement of spikes, at a resolution of 1/q. We calculated Dspike[q] for all pairs of a neuron's responses for a range of values of q. These distances were used in two ways: first, to derive an information-theoretic measure of the extent to which the temporal patterns (spike timing and/or firing rate envelope) for each tastant were distinct (Shannon's mutual information, H), and second, to determine whether the dissimilarities between these patterns corresponded to the geometry of a perceptual taste space. We describe the information-theoretic measure here, and the geometric measures in the next section.
To measure mutual information, we proceeded as follows (for details, see Victor and Purpura, 1996, 1997). In essence, this analysis determined the extent to which pairs of responses to the same stimulus tended to be closer to each other than pairs of responses to different stimuli. A spike train S was classified as belonging to the response class R if the average distance Dspike[q] from S to each of the spike trains elicited by the stimulus R is shorter than the average distance from S to the responses elicited by any other stimulus (for details, see Victor and Purpura, 1996, 1997). We then calculated an information H from the confusion matrix between the actual stimulus that elicited each response and the response class to which it was assigned by this proximity rule. The value of the information, H, thus indicates the performance of stimulus-dependent clustering based on the temporal patterns of taste responses. For example, perfect classification of responses to the four primary taste qualities (sucrose, NaCl, HCl, and quinine) corresponds to H = 2 bits (log24 = 2); in a 10-tastant experiment, perfect classification corresponds to H = 3.32 bits (log210 = 3.32). If the classification is random, H = 0.
The above analysis was performed for each cell for a range of values of q in half-octave steps from 0.0625 to 256, and for q = 0. For q = 0, H is denoted as Hcount, and indicates information conveyed by spike count alone. The value of q at which H first reaches its maximum was denoted by qmax. Since Dspike[q] considers spikes that are separated by more than 2/q to be unrelated (it costs 2 units to delete them, but more than 2 units to align them), qmax reflects the temporal precision (temporal resolution) for temporal coding.
Additional information-theoretic analyses were performed to support the robustness of our findings, and to determine the kind of temporal features that contributed to H. First, to control for the statistical effects of a finite data sample (see Victor and Purpura, 1996, 1997), the values of H calculated from observed responses were compared with the values Hshuffle calculated from a dataset in which the observed responses were randomly assigned to the various tastants. Second, to distinguish between the influence of firing rate envelope and detailed firing pattern, we performed the above analysis on surrogate datasets created by “exchange” resampling. These surrogate datasets were created by randomly exchanging spikes between individual responses to the same tastants. Thus, the surrogate data and the actual data had identical poststimulus time histograms and an identical number of spikes elicited on each trial. If the value of H for the original data is above the range of Hexchange (mean ± 2 SD) obtained from exchange-resampled surrogates, we conclude that the information contributed by temporal coding is not merely contained in the average rate envelope of taste response nor in spike count, and that spike timing patterns in individual trials must also contribute to taste coding. Finally, we also created surrogate datasets consisting of inhomogeneous Poisson processes. These surrogate datasets were created by random draws from the set of observed spike times for each stimulus, rather than by exchanging spike times between pairs of responses—so they matched the observed responses in rate envelope but not in the number of spikes elicited on each trial. Information estimates from these datasets were nearly identical to those of the exchange-resampled datasets.
Geometry of the response space.
The above information-theoretic quantities are overall measures of the extent to which the responses to the 10 stimuli differ, but do not determine the geometry of the response space—namely, how these differences represent the sensory domain. To motivate our strategy for characterizing this representation, we consider two contrasting scenarios. In one scenario, the pairwise response differences correspond to position on a saliency scale—that is, the response space is one dimensional. In the second scenario, the pairwise differences correspond to perceptual differences—that is, the response space is the taste tetrahedron of Henning. Although these two scenarios have strikingly different implications for coding, they both lead to the same value of information—because in both cases, all responses are different. To distinguish between the two scenarios, we thus need to determine the geometry of the response space that is implied by the pairwise differences.
To determine this geometry, we applied standard multidimensional scaling (MDS) (Kruskal and Wish, 1978) to the distances between the responses as determined by Dspike[q], choosing q = qmax, the value that maximized information. That is, we sought to embed the individual responses as points in a vector space, so that the ordinary (Euclidean) distances between these points matched the spike train distances Dspike[q] (see Figs. 4B, 6B). After embedding the individual responses to each tastant by this procedure, we averaged them to calculate the centroids, which are plotted in Figures 5, 7–9, and 11. To compare the response space geometry for the actual responses with those of the exchange-resampled surrogates on the same axes, the actual data and the surrogate data were subjected to a single MDS analysis (see Figs. 8, 9, 11).
Figure 4.
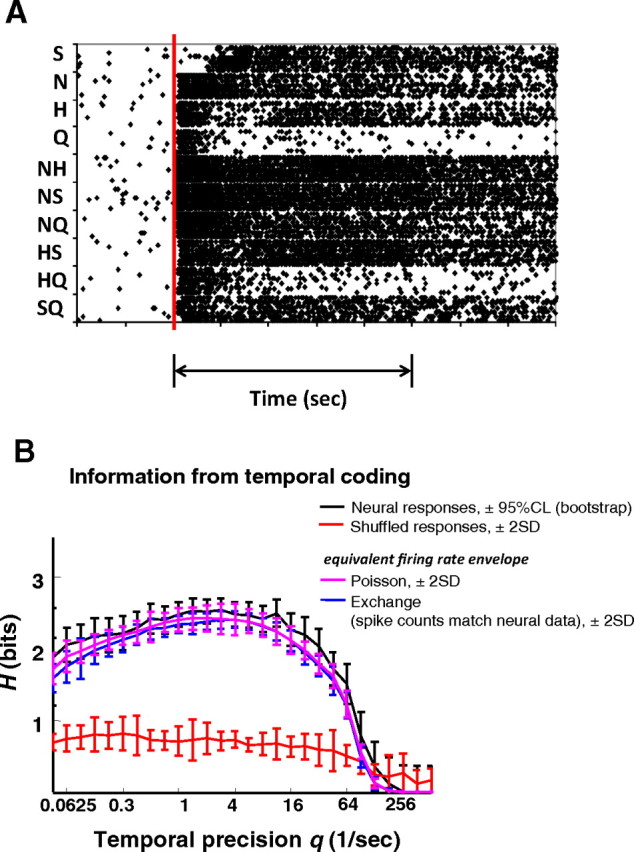
Temporal coding in a more broadly tuned cell (cell 7). A, Raster plots for 10 trials of each of 10 taste stimuli. Double arrow line under raster indicates stimulus presentation [Chen and Di Lorenzo (2008), used with permission]. B, Analysis of temporal coding in the first 2 s of response using metric space analysis. Plot shows temporal precision, as measured by q (1/s) versus information (H) in bits. For 10 stimuli, the maximum amount of information that can be conveyed is 3.32 bits. The black line indicates information conveyed by the neural response; error bars represent 95% confidence limits (CL) calculated from a bootstrap analysis. In this analysis, surrogate datasets are created by randomly drawing from the observed responses with replacement, reanalyzing, and estimating confidence limits from the scatter of the resulting values. The red line indicates the information conveyed by “shuffled” datasets, created by randomly assigning the observed responses to the various tastants. The blue line shows the information conveyed by “exchange” datasets, created by randomly exchanging spikes between individual responses to the same tastants so that the PSTHs and the number of spikes elicited on each trial matched that of the original data. The pink line shows the information conveyed by “Poisson” datasets, created by random draws from the set of observed spike times for each stimulus; these surrogates matched the observed responses in rate envelope but not in the number of spikes elicited on each trial. The Poisson and exchange analyses identify the contribution of the firing rate envelope to the total amount of information conveyed by the responses. Results of these two analyses are nearly identical. For the surrogate datasets (shuffle, exchange, and Poisson), the error bars represent SDs across 40 surrogates.
Figure 6.
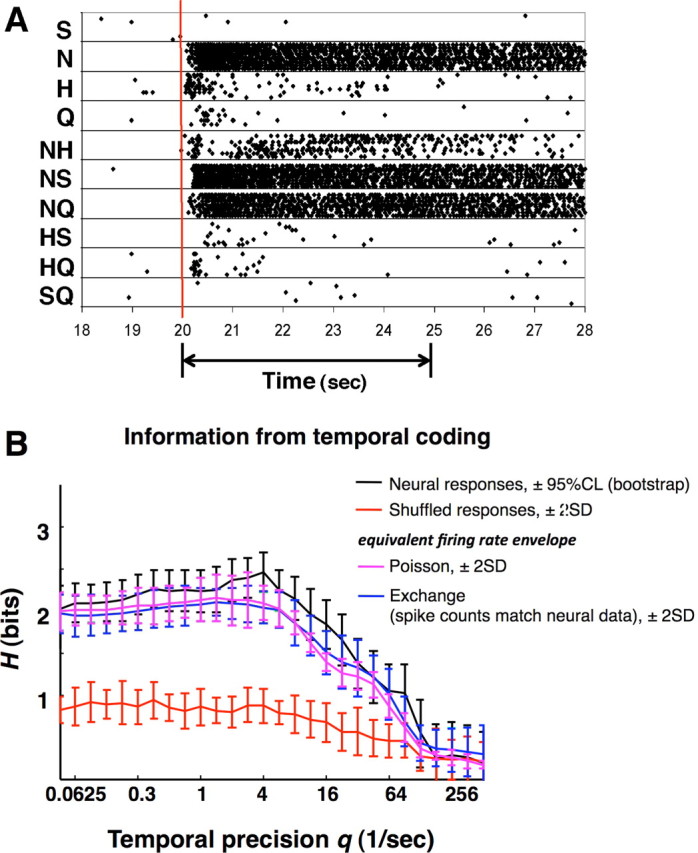
Temporal coding in a more narrowly tuned cell (cell 35). A, Raster plots for eight trials of each of 10 taste stimuli. Double arrow line under raster indicates stimulus presentation. B, Results displayed as in Figure 4.
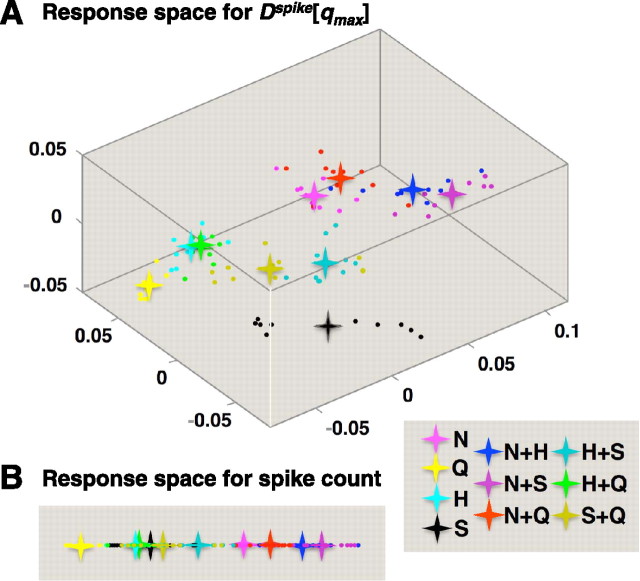
Figure 5.
Multidimensional scaling of spike time distances for the data of Figure 4. For all plots, dots indicate the location of individual responses; asterisks indicate the centroid of the clusters of responses to a given taste stimulus. Axes are labeled in arbitrary units. A, The three-dimensional response space created by MDS of the spike time distances Dspike[qmax]. For this cell, qmax = 2.83. B, The response space created by MDS of the spike count distances, Dcount. It is one dimensional. Color coding of the stimuli is indicated in the lower right of the figure.
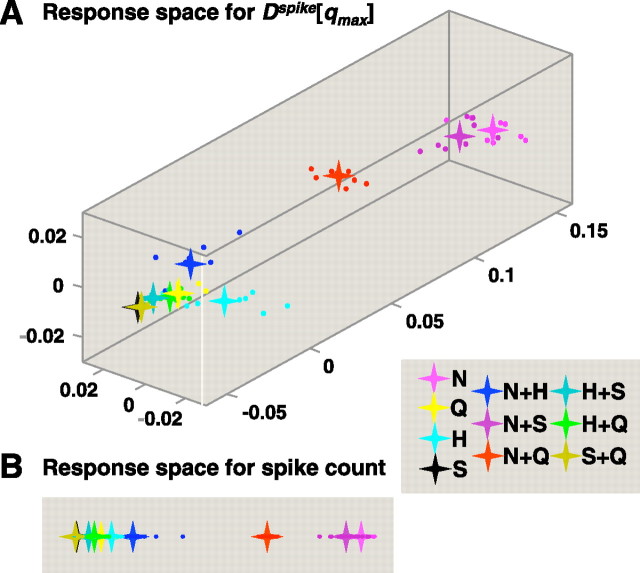
Figure 7.
Multidimensional scaling of spike time distances for the data of Figure 6. Results are displayed as in Figure 5. For this cell, the value qmax = 4 was used in A.
Figure 8.
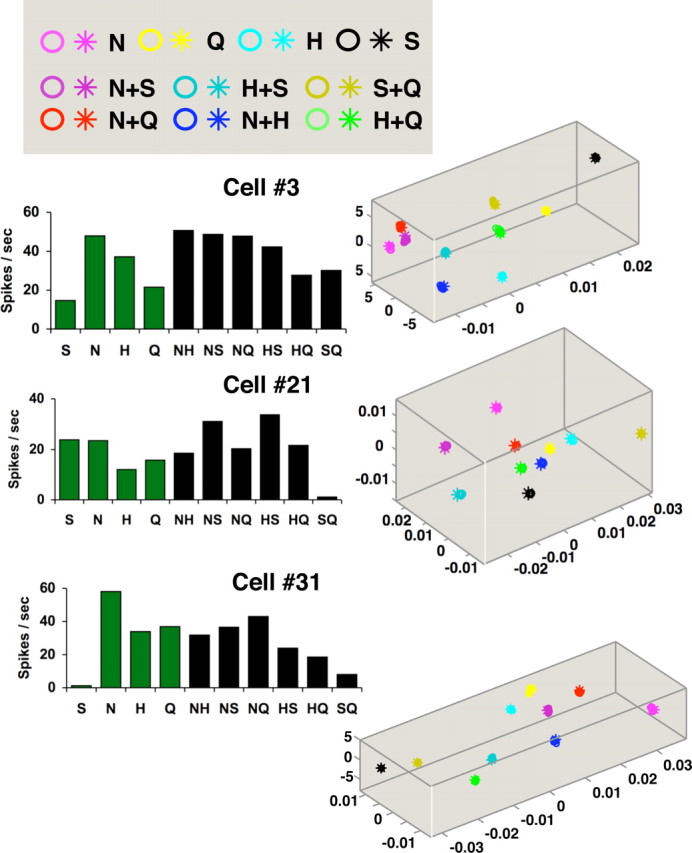
Temporal coding in three more broadly tuned cells (cells 3, 21, and 31). Left, Plot of response magnitudes [mean firing rate in the first 2 s of response (in spikes per second) minus the mean firing rate in the last 5 s of the water prerinse] for all tastants. Abbreviations are as in Figure 3. Right, Results of MDS analyses in three dimensions based on similarity of responses as measured by Dspike[qmax]. Plots show the centroid of each cluster of responses to each tastant (asterisks) superimposed with the results of the exchange analyses (circles). Color coding of the tastants is as in Figure 5. For cell 3, qmax = 4; for cell 21, qmax = 4; and for cell 31, qmax = 5.66.
Figure 9.
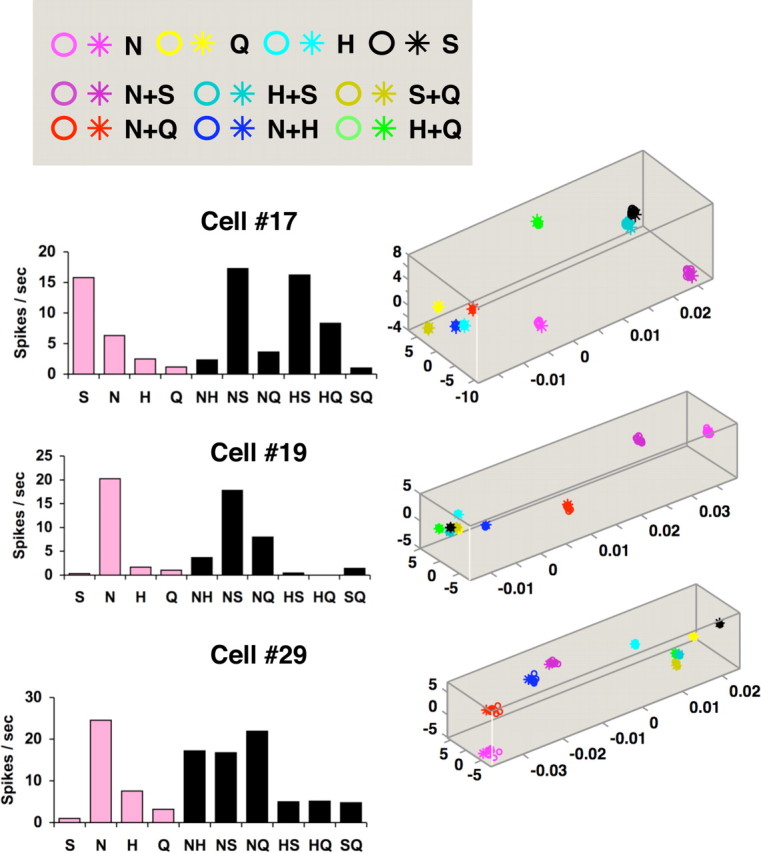
Temporal coding in three more narrowly tuned cells (cells 17, 19, 29). Display conventions are as in Figure 8. For cell 17, qmax = 2.83; for cell 19, qmax = 2.83; and for cell 29, qmax = 5.66.
Figure 11.
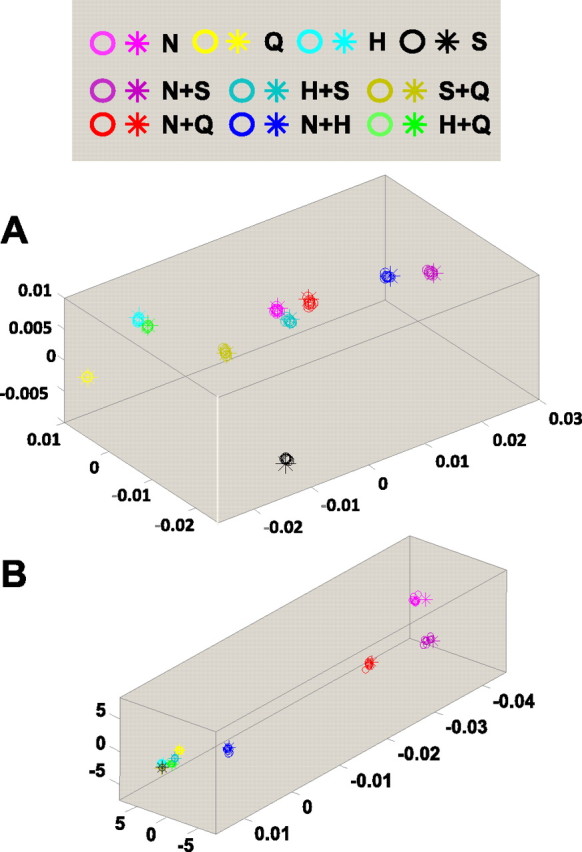
Results of an MDS analysis including 10 exchange-resampled spike trains (cluster centroids marked by circles) and the original data (cluster centroids marked by asterisks) for the cells shown in Figures 3–5 (A) and Figures 6 and 7 (B). The near-perfect alignment indicates that the rate envelopes produced by tastants determine the geometry of the response space.
The axes in the response space are abstract—they are defined by the criterion that each successive axis accounts for as much as possible of the variance that is not accounted for by the other axes. Consequently, the axes are not guaranteed to have a direct physiological interpretation, although we do note that the first axis is generally correlated with firing rate. Note also that there is no general guarantee that a low-dimensional MDS embedding is possible [the distances Dspike[q] are non-Euclidean (Aronov and Victor, 2004)], but in our data, the first three dimensions extracted by MDS generally accounted for >95% of power of the distances between the centroids.
Consistency of temporal representation across neurons.
To determine the consistency of the temporal representations across neurons, we performed a principal components analysis (PCA) on the response firing rate envelopes. First, the peristimulus time histogram (PSTH) containing each neuron's response to each of the 10 tastants was calculated at a 50 ms resolution (40 bins for the 2 s response). These 10 response histograms were concatenated to form a 400-element vector, representing the time course of a neuron's response to the 10 stimuli (see lower portions of each half of Fig. 12). The 400-element vector was then normalized by the mean firing rate within each unit, so that neurons with higher firing rates did not contribute disproportionately to the analysis.
Figure 12.
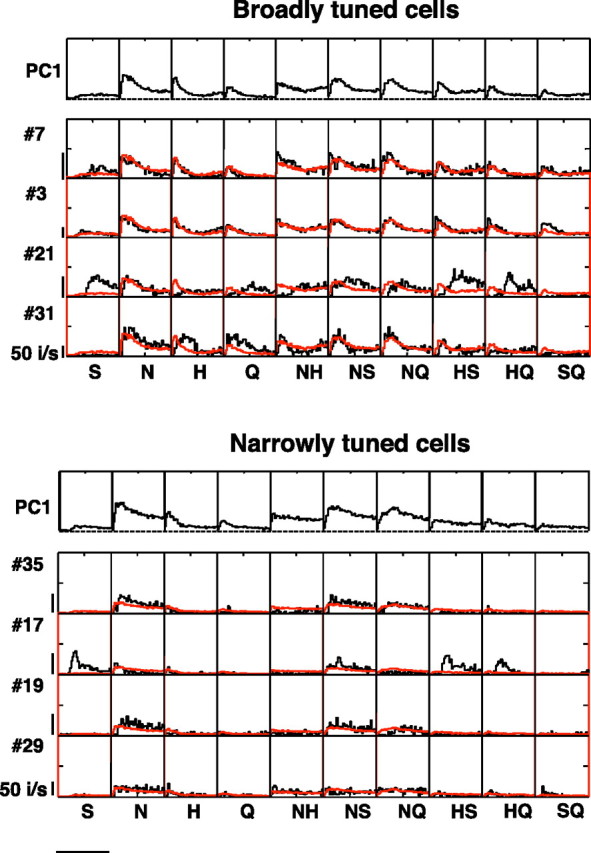
Results of PCA of firing rate envelope for broadly and narrowly tuned cells. Separate analyses were applied to the more broadly tuned (top) and the more narrowly tuned (bottom) cells. Spike rates were normalized according to overall firing rates within each cell. For each group of cells, the top row shows the first principal component for all tastants. Additional rows of plots show the predicted rate envelope (in red) superimposed on the actual rate envelope (in black) for all stimuli for the cells shown in Figures 3–9. The line on the bottom left indicates 2 s.
We then applied standard PCA to these 400-element vectors obtained from subsets of the 35 neurons. The extent to which the variance was contained in the first principal component indicates the consistency of the firing rate envelopes for the 10 stimuli within each of these subsets. To determine whether this similarity across the population was merely a consequence of the fact that most taste responses had generally similar shapes, we repeated this analysis on surrogate datasets in which we randomly relabeled the tastants corresponding to each response. This was done by shuffling the four primary tastants, followed by relabeling the binary mixtures according to how their components were shuffled. Similar results were obtained when the shuffling was applied, independently, to all 10 tastants within each neuron.
Finally, we asked whether the representation of the 10 tastants was consistent with linearity—i.e., to what extent the responses to binary mixtures were the sums of the responses to their components. To do this, we first determined the matrix P that projects any set of 10 measured responses into the best-fitting linear responses. Once P was determined (details below), we applied it to each time point to the 10 response histograms. The values quoted in the text are the fraction of the variance of the original response histograms that are contained in this projection.
To determine P, we note that it must leave invariant each of four prototypical linear response patterns: a response of 1 to one of the four primary tastants and the binary mixtures containing it, and a response of 0 to all other stimuli. (This is because any linear response to mixtures is a linear combination of the above four linear prototypes.) Designating the stimuli in the order S, N, H, Q, NH, NS, NQ, HS, HQ, and SQ, these four prototypical response patterns can be written as four column vectors:
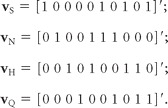 |
For each of these vectors, P must satisfy Pv = v.
P is thus uniquely determined as the projection matrix onto the subspace spanned by vS, vN, vH, and vQ. As such, P can be expressed as P = Alin′Alin, where Alin has orthonormal rows that span the same subspace as the v's. Lengthy but straightforward algebra leads to
 |
where q = (7 − )/28 ≈ 0.3385, r = (3 + 7)/84 ≈ 0.2388, s = (7 − 3)/42 ≈ 0.0997, and t = (−3 − 7)/42 ≈ −0.4777. One can readily verify that AlinAlin′ is the identity (implying orthonormality of the above rows), and Alin′Alinv = v for v = vS, vN, vH, and vQ, as required.
Results
General response characteristics
Taste responses to the four basic tastants and their binary mixtures were recorded from 35 cells in the NTS. All 10 stimuli were presented at least five times (range 5–23 presentations; median = 10). Spontaneous firing rate was 1.9 ± 0.3 sps. These cells were a subset of a dataset whose detailed tuning characteristics are described in another paper (Chen and Di Lorenzo, 2008). Cells in the present paper were those that had a sufficient number of stimulus presentations of all 10 tastants for temporal coding analyses.
Each taste stimulus evoked a significant response from the majority of taste-responsive NTS cells. Considering first the four single taste stimuli, there were 34 cells (97%) that responded to N, 34 cells (97%) to H, 30 cells (86%) to Q, and 21 cells (60%) to S. All taste mixtures evoked significant responses in the great majority of cells (range: 31 cells for HQ and SQ to 35 cells for NS and NQ). Mean responses differed significantly across tastants (F(9,35) = 28.9, p < 0.01). Planned comparisons of single tastants with binary mixtures containing those tastants showed that, in terms of spike count, the responses to taste mixtures were not significantly different from responses to the more effective component of the mixture (that is, the component that produced the larger response when presented alone) in all cases (Bonferroni post hoc test, p values >0.05).
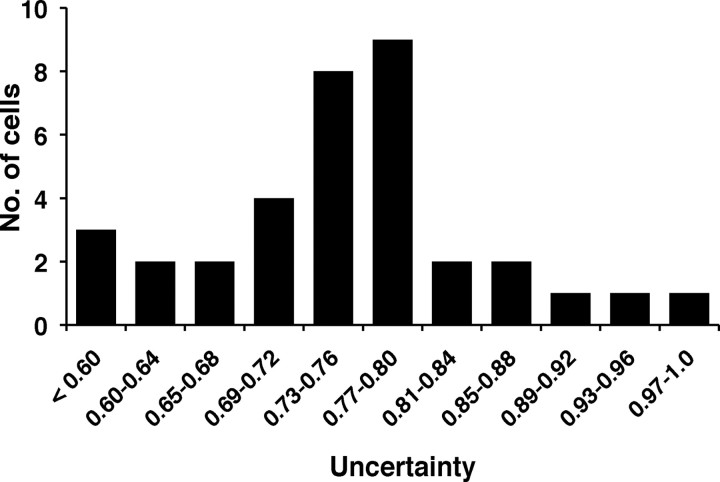
Most taste-responsive cells were broadly tuned across all four single component tastants and their mixtures; however, approximately a third of the cells only responded well to one or two of the single-component taste stimuli. To quantify the breadth of tuning of a cell, we used an index commonly used for this purpose, the uncertainty, U (Smith and Travers, 1979). For a cell that responds to only one stimulus, U = 0. For a cell that responds equally well to all four stimuli, U = 1. U values in the present study, based on the number of taste-evoked spikes (minus the number of spontaneous spikes) recorded over the first 2 s of response, ranged from 0.32 to 0.97 and had a median of 0.76 (mean = 0.76 ± 0.2). The distribution of uncertainty measures is shown in Figure 1. For comparisons of more broadly versus more narrowly tuned cells, we used cells associated with the upper and lower halves of the distribution of U values, respectively, as indicated in Figure 1. This choice was made merely to facilitate the analysis of how response properties vary across the population, and was not intended to imply the presence of discrete categories. Indeed, the distribution of U was not bimodal by the Hartigan dip test (p > 0.5) (Hartigan and Hartigan, 1985), and similar results were obtained with other cut points (upper vs lower thirds, for example).
Figure 1.
Distribution of uncertainty measures across NTS cells.
Temporal coding enables representation of the taste world in individual cells
We next considered whether there are distinguishing temporal features of the responses that allow neuronal activity elicited by different tastants to be differentiated, even if the firing rates are the same. To do this, we used metric space analysis (Victor and Purpura, 1996, 1997) to determine whether firing patterns carry information about taste quality, and applied MDS to determine the geometry of the representation of taste quality by firing pattern (see Materials and Methods for further details).
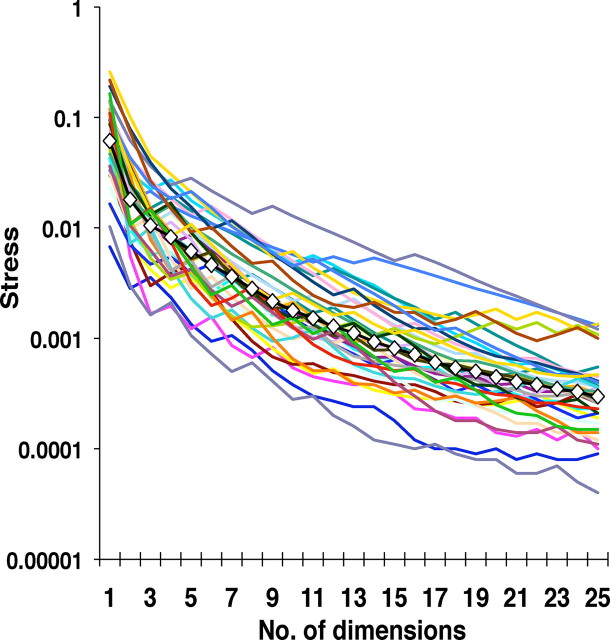
We chose a three-dimensional solution for MDS based on the following considerations (Fig. 2). The main consideration was that three dimensions reduced the Kruskal normalized stress [i.e., the fraction of unexplained variance (Kruskal and Wish, 1978)] to an average of 1.05% (geometric mean of the 35 cells). Additional dimensions reduced the stress further, but beyond dimension 3, the fractional reduction in stress fell off substantially. Specifically, the second dimension eliminated 71% of the stress that remained after the first dimension, and the third dimension eliminated 42% of the stress that remained after the second dimension, but beyond dimension 3, additional dimensions each reduced the remaining stress by only 20–25%.
Figure 2.
Normalized Kruskal stress values (Kruskal and Wish, 1978) for all 35 NTS cells for the first 25 dimensions. Also shown is the geometric mean across cells (filled white symbols).
Two additional considerations supported the use of a three-dimensional solution to represent the response space. First, an auxiliary analysis showed that the first three dimensions indeed reflected systematic differences in responses to different tastants, but higher dimensions did not. In particular, when we compared the more broadly tuned and the more narrowly tuned units, we found that there was greater stress in the more broadly tuned neurons (which is expected, given the greater diversity of their responses)—but this difference was only present for the first three dimensions (p < 0.05, one-tailed t test for dimensions 1, 2, and 3, but p > 0.1 for dimensions >4). Second, because the spike metrics are intrinsically non-Euclidean, the number of dimensions required to represent the response space in a Euclidean MDS embedding will be larger than its intrinsic dimensionality. Dimensions devoted to accounting for the non-Euclidean character are signaled by negative eigenvectors encountered within the MDS analysis (Aronov and Victor, 2004). In our dataset, only 6 of the 35 neurons had a negative eigenvalue at dimension 3, but 19 of the 35 neurons had a negative eigenvalue at dimension 4.
Figure 3 shows a sample of raw data for responses to 10 stimuli (four tastants and their six binary mixtures) recorded from a broadly tuned cell, cell 7. This cell responded well to all four taste stimuli as well as all the binary mixtures. Figure 4A shows a raster plot of 10 trials of responses in the same cell as in Figure 3. It can be seen that each stimulus evoked distinctive and reliable time courses (rate envelopes) of response.
Figure 3.
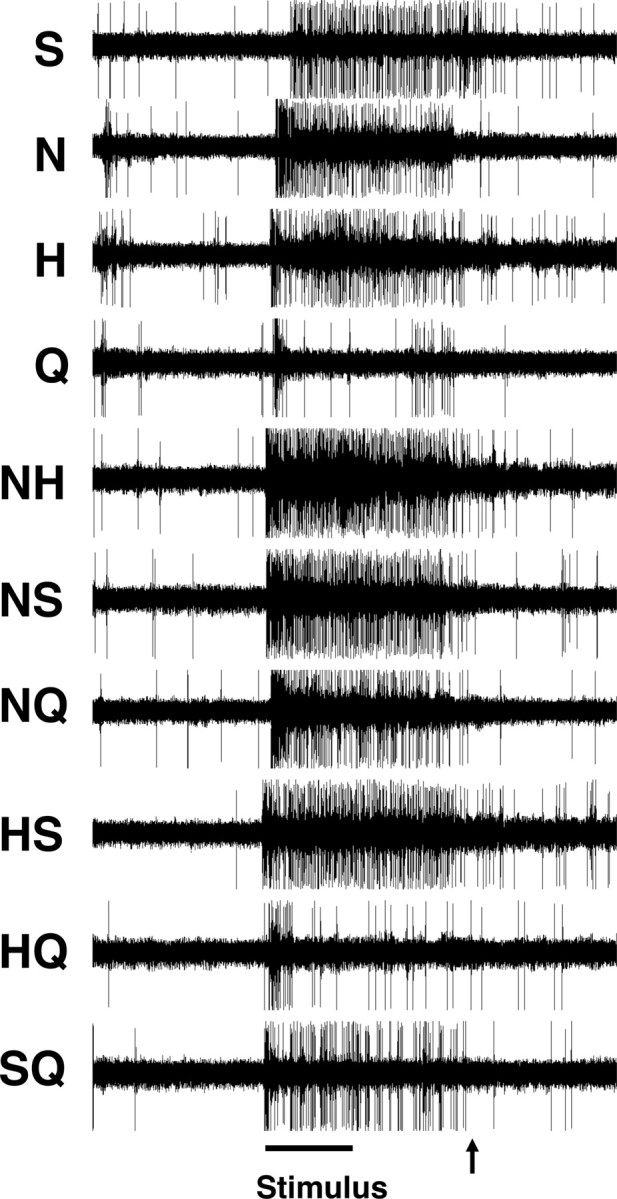
Spike trains in response to each of 10 taste stimuli in a more broadly tuned cell (cell 7). The line at the bottom indicates the taste stimulus presentation; arrow indicates the onset of the distilled water rinse.
Using metric space analyses (Victor and Purpura, 1996, 1997), we quantified the information contributed by the temporal characteristics of the first 2 s of the response. Figure 4B shows a plot of the information present in the actual responses calculated at various levels of temporal precision (q). Results of a control analysis (shuffled responses) are also plotted. Importantly, the information contained in the actual response at q = 2.83 s−1 (Hmax = 2.54) was greater than that conveyed by spike count alone (value at q = 0; Hcount = 1.88), implying that the temporal characteristics of the responses in this cell may be used to disambiguate the stimuli.
Although these information-theoretic calculations show that temporal aspects of the response distinguish among the 10 tastants, they do not indicate whether temporal patterns can be used to create a logical “map” of taste space (see Materials and Methods for further details). To determine this, we applied MDS analyses to the spike metric distances Dspike[q], which indicate the similarity between individual responses at a timescale of 1/q. We chose a timescale of q = 2.83 s−1, since this was the peak of the information curve of Figure 4B, i.e., the resolution that maximally distinguished the responses to the individual tastants. Results of the MDS analysis, shown in Figure 5A, show that responses to the same stimulus are clustered near each other, indicating that repeated presentations of the same stimulus produce responses with similar temporal characteristics. In addition, responses to the four single-component tastants are widely separated from each other, while the responses to the mixtures are placed close to the responses to their respective components. Thus, the temporal characteristics of response segregate responses that are similar in magnitude in a meaningful way. Furthermore, these data show that the entire taste space can be mapped by the temporal characteristics of response in a single cell.
In contrast, when MDS is applied to the spike count distance Dcount (Fig. 5B), the response space has only one dimension. Moreover, within this dimension, there is a great deal of overlap among the responses, implying that this cell's spike count can only provide an ambiguous signal about the identity of a tastant.
Figures 6 and 7 show the results of a parallel set of analyses applied to a more narrowly tuned cell. Unlike the cell in Figures 3–5, when the narrowly tuned cell in Figures 6 and 7 responds, it provides a clear signal that there is NaCl on the tongue, either as a single-component stimulus or as one component of a mixture—and it is largely insensitive to the presence of other components (Fig. 6A). In this cell, the information conveyed by spike count alone (Hcount = 2.02) is relatively close to the information conveyed by both spike count and the temporal characteristics of the response (Hmax = 2.45 at q = 4) (Fig. 6B). The corresponding MDS analysis (Fig. 7A) also shows that the cell's responses (including its temporal characteristics) primarily distinguish between stimuli that contain NaCl and those that do not. Responses to sucrose, HCl, and quinine, as well as to mixtures of any two of these tastants, are poorly differentiated from each other. This is expected from Figure 6A, since these stimuli evoke relatively weak responses. In contrast to the results from the broadly tuned cell shown in Figure 5, MDS analyses of the responses produced by this narrowly tuned cell (Fig. 7A, B) show that the temporal characteristics of response do not substantially change the representation of the taste space: it remains largely one dimensional.
Figures 8 and 9 show several other examples of response spaces determined by MDS analyses based on Dspike. Results from three of the more broadly tuned cells (Fig. 8) and three of the more narrowly tuned cells (Fig. 9) are shown. For broadly tuned cells, the response spaces locate all single-component tastants and their binary mixtures in different places, indicating that each response has distinguishing temporal features. In contrast, for narrowly tuned cells, responses to the best stimulus and mixtures containing that stimulus are grouped together at one end of the response space, and responses to the other stimuli are grouped at the other end. This indicates that the temporal characteristics of taste responses only serve to distinguish stimuli that contain the best stimulus from stimuli that do not contain it. Within these groups, the temporal patterns of responses are similar and not easily differentiated.
To further characterize the temporal representation of taste space, we first analyzed the contribution of several features of the spike trains to the transmitted information. As in the example broadly (Figs. 3–5) and narrowly (Figs. 6, 7) tuned cells, the overall transmitted information (Hmax) was greater than the transmitted information that could be extracted from spike count alone (Hcount). The difference between these quantities (Hmax − Hcount), which represents the contribution of temporal coding, is higher in the broadly tuned neurons than in the narrowly tuned neurons; i.e., it was positively correlated with breadth of tuning, U (r = 0.59, p < 0.001) (Fig. 10A), even though the overall amount of information, Hmax, was uncorrelated with tuning (r = 0.33, p > 0.05) (Fig. 10B). That is, broadly tuned and narrowly tuned cells each carry about the same amount of information, but it is carried differently, and it has different meaning. In more broadly tuned cells, temporal aspects of the spike train contribute to information and generate a multidimensional response space; in more narrowly tuned cells, temporal aspects contribute less, and only a one-dimensional response space results.
Figure 10.
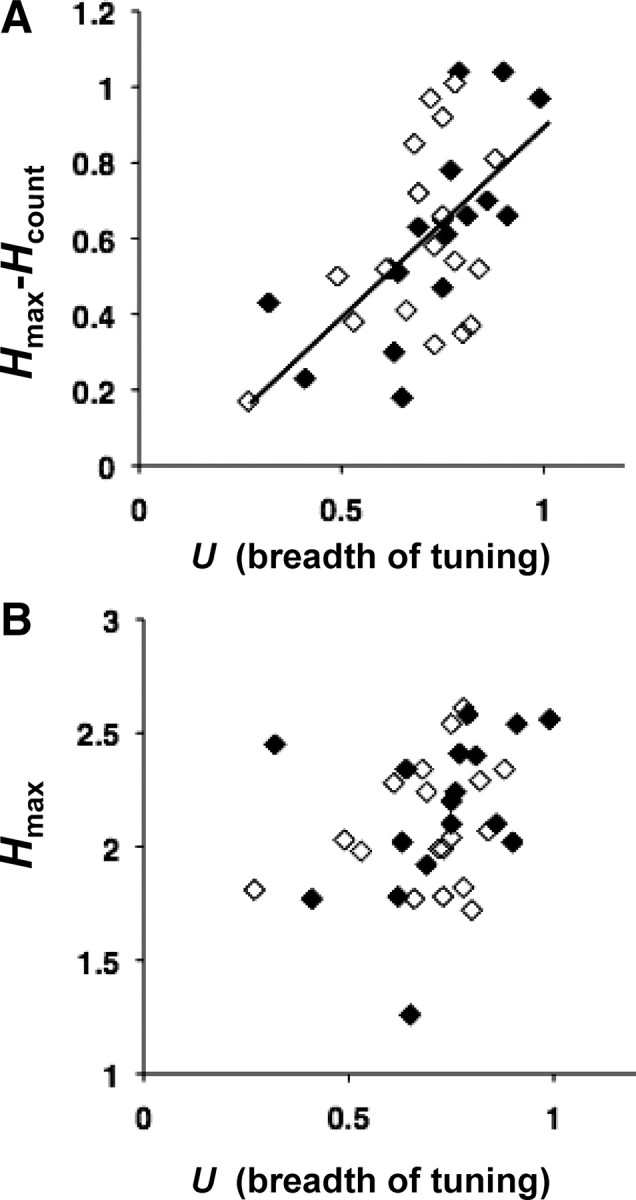
Relationship of breadth of tuning to information conveyed by temporal coding. A, Plot of breadth of tuning (U) versus Hmax − Hcount. The line indicates the linear regression; (Hmax − Hcount) = 0.98 × U + 0.09, R2 = 0.404. Filled diamonds indicate cells where Hmax > Hexchange + 2SD. Open diamonds indicate cells where Hmax ≤ Hexchange + 2SD. B, Plot of breadth of tuning (U) versus Hmax for all cells. There is no systematic relationship between the maximum amount of information conveyed by temporal coding and the breadth of tuning.
Inspection of the raster plots in Figures 4 and 6 suggests that one aspect of the temporal representation is that the firing rate envelope depends on stimulus quality. However, it is also possible that detailed firing patterns contribute to this representation as well. Examples of such firing patterns include patterns of interspike intervals, or any other kind of stimulus-specific correlation of spike times (Nagai and Ueda, 1981). To separate these kinds of temporal contributions, we created surrogate datasets that had the same spike counts and rate envelopes as the actual data, but in which firing patterns were destroyed (see Materials and Methods). We then compared the characteristics of these “exchange-resampled” datasets with those of the original data. The difference between the amount of information in the actual data (Hmax) and in the surrogate datasets (Hexchange) indicates the contribution of detailed pattern of spike timing. In Figure 10, A and B, the filled symbols indicate cells for which Hmax > Hexchange + 2SD. That is, in these cells the contribution of spike timing was significantly greater than the contribution of either spike count or the rate envelope. Open symbols show cells for which Hmax ≤ Hexchange + 2SD. For these cells, there was no evidence that firing pattern conveyed more information than rate envelope or spike count. As seen in Figure 10, a significant contribution of spike timing, above and beyond that contributed by the rate envelope or spike count, was present in approximately one-third of the cells, but these cells included both broadly tuned and narrowly tuned cells.
Representation of taste mixtures by rate envelope in broadly tuned cells
Collectively, these results indicate that firing rate envelopes carry a greater portion of the information in broadly tuned cells than in narrowly tuned cells, and the above exchange analysis shows that spike timing patterns help to distinguish the responses to the various basic tastes and their binary mixtures in approximately one-third of both broadly and narrowly tuned cells. However, whether firing patterns contribute to the geometry of the response space is a separate question. To put it another way, the information lost by exchange resampling (Fig. 10, solid symbols) shows that detailed firing patterns contribute to the distinctness of the clusters shown in Figures 5A and 7A, but we now ask whether it contributes to their positions. To address this question, we applied MDS analyses to the exchange-resampled datasets, along with the original data (Fig. 11; see also Figs. 8, 9). For all cells, including the ones in which temporal pattern contributes to distinguishing among the tastants, a consistent picture emerges: the geometry of the response space for the exchange-resampled data is essentially identical to the geometry of the response space for the original data. In sum, while firing patterns per se might be used to distinguish which tastant is which, the geometry of the response space for each neuron is determined by its firing rate envelopes for each tastant.
This observation—that the geometry of the response space is determined by the firing rate envelope—is an important simplification that allows us to advance to the next question: whether the representation of taste quality in the temporal aspects of the response is consistent across neurons. To address this question, i.e., to compare the temporal representation of taste space across the population, we performed a version of PCA. Specifically, we represented each cell's response to the 10 tastants by a concatenation of the 10 PSTHs, and used PCA to quantify the extent to which these concatenated PSTHs were consistent across cells. This analysis was performed separately for the more broadly tuned and the more narrowly tuned neurons, after normalization for overall firing rate within each cell (Fig. 12). We judged the significance of the principal components by comparing the amount of variance explained to the variance explained in surrogate datasets in which we scrambled the tastants within cells. (The rationale for this analysis is that most responses were generally similar in time course, and we wanted to look beyond this “nonspecific” consistency across cells.) For both the more broadly and more narrowly tuned cells, most of the variance was contained within the first principal component: narrowly tuned cells, 65.1% of the variance, versus 53.1% in surrogates (p < 0.005); broadly tuned cells, 76.8% of the variance, versus 66.1% in surrogates (p < 0.005). As seen in Figure 12, the tastant-specific aspects of the rate envelopes are that the S response is the slowest, the H response is the most transient, and the N response is the most sustained. Importantly, this analysis shows that the tastant-specific variations in rate envelopes were highly consistent across neurons—and this consistency was even greater for the more broadly tuned cells than for the more narrowly tuned ones.
This analysis also provided a way to quantify the extent to which the representation of taste space is “logical”—i.e., the extent to which responses to mixtures are positioned in between responses to their components. To do this, we projected the above principal components into two orthogonal subspaces: one, in which the mixture responses were exactly equal to the sum of the responses to the components (the linear prediction), and one that contained the differences between the linear prediction and the actual responses. Most of the power was in the linear prediction (narrowly tuned cells, 81.6%, broadly tuned cells, 83.7%). Thus, the broadly tuned cells represent the mixtures in a logical way—largely predicted by their responses to the components. This demonstrates the systematic nature of the mapping from taste quality to firing rate envelope.
Discussion
The most significant result of the present study is the demonstration that the most broadly tuned cells—those that respond in a relatively nonselective manner across tastants—produce a comprehensive representation of the sensory domain via the temporal characteristics of their responses. We showed that this representation is manifest in the firing rate envelope of the responses to the basic tastants: they differ markedly from each other, despite similarity in their evoked firing rates, and responses to mixtures of stimuli are typically well approximated by a linear superposition of the responses to their components. Moreover, we showed that the representation is consistent across the population of cells. In contrast, more narrowly tuned cells cannot convey information about the full sensory domain, since their responses are dominated by the taste quality to which the cell is tuned.
Our study extends computational and theoretical evidence that broadly tuned cells are more efficient than narrowly tuned cells for encoding a multidimensional stimulus (Pouget et al., 1999; Zhang and Sejnowski, 1999; Brown and Bäcker, 2006) by showing that they not only convey more information about taste quality, but indeed represent taste quality via the firing rate envelope of their discharges. We also showed that firing rate envelope is only a part of the picture: spike timing patterns augment the distinctiveness of clusters of responses to different stimuli.
PCA analyses show that the representation of taste stimuli is consistent, in that the rate envelope of responses to different tastants is similar, especially across the population of broadly tuned taste-responsive NTS cells; however, these data are not without caveats. For example, while the PCA demonstrate that firing rate envelopes of response to binary mixtures of basic tastes are nicely predicted by the linear combination of the rate envelopes of response to their components, there is cell-to-cell variation that is not accounted for by the first principal component. One possibility is that this residual variation represents heterogeneity of neurons and coding strategies. Consistent with this idea, there are some cells whose responses to taste mixtures reflect “mixture suppression,” defined as the attenuation of the response to a given stimulus when it is mixed with another (Fig. 3) (Chen and Di Lorenzo, 2008). This phenomenon is a deviation from strict linearity of the combination of the rate envelopes of responses to taste mixtures. In addition, while PCA, as used here, can be a useful tool to assess consistency of rate envelopes, other aspects of the neural response, such as the detailed firing patterns, convey additional information (Di Lorenzo and Victor, 2003, 2007; Roussin et al., 2008).
One important issue that this study did not address is that of the effect of varying concentration on the representation of taste stimuli by spike timing. To address this question, we have recorded from NTS cells following repeated trials of NaCl and HCl presented at different concentrations and as components of binary mixtures. A brief description of the results of these experiments is included as supplemental material (available at www.jneurosci.org). In sum, these data support the idea that the spike timing can be used to represent taste quality in the responses of a single cell, even as intensity is varied.
Decoding temporal patterns of response
Our results show that the temporal characteristics of responses in broadly tuned cells represent the taste domain, but they do not show that this representation is actually used by a behaving animal. However, previous work has shown that taste-like sensations of an identifiable quality were evoked when the temporal patterns of NTS responses to either sucrose or quinine were played back (as electrical pulse trains) into the NTS in awake rats (Di Lorenzo and Hecht, 1993: Di Lorenzo et al., 2003, 2009). Specifically, rats with electrodes implanted in the rostrocentral NTS learned to avoid licking water when licking was paired with delivery of an electrical pulse train with the temporal characteristics of a sucrose (Di Lorenzo et al., 2003) or quinine (Di Lorenzo et al., 2009) response when it was paired with an injection of LiCl. Trained animals actually generalized the conditioned aversions specifically to real sucrose or quinine, respectively. Lick-contingent patterns of electrical pulses based on quinine responses predictably produced avoidance without prior training (Di Lorenzo and Hecht, 1993; Di Lorenzo et al., 2009), while control patterns of pulses that contained a randomly presented sequence of interpulse intervals equivalent to the original effective pattern did not produce avoidance (Di Lorenzo et al., 2003). Collectively, these data imply that the information about taste conveyed by temporal coding in NTS responses (Di Lorenzo and Victor, 2003, 2007; Roussin et al., 2008) is indeed functionally relevant. These results also emphasize that the distinctive waveforms corresponding to each taste quality—while useful for demonstration of the consistency of the temporal representation across neurons—are not necessarily the temporal features that the animal uses; the animal evidently makes substantial use of intrinsic firing patterns.
Taste coding through time—relationship to taste coding in the periphery
The efficient representation of the multidimensional space of gustation by broadly tuned NTS cells presumably reflects the convergence of information from the periphery. Recent studies have argued that narrowly tuned fibers in peripheral nerves carry the bulk of information to the NTS (Chandrashekar et al., 2006), so the question arises as to whether there is a shift in coding strategy from the periphery to the brainstem. That is, it is possible that incoming information is conveyed by a rate code that is then converted to a temporal code either through the neural circuitry or the intrinsic properties of the NTS neurons. Conversely, there is evidence for temporal coding in peripheral taste fibers (Fishman, 1957; Mistretta, 1972; Ogawa et al., 1973, 1974; Nagai and Ueda, 1981), though the amount of information conveyed by this mechanism has not been quantified. If NTS cells receive temporally organized information from the periphery, the function of the NTS may be to enhance this aspect of the representation. In addition, a temporal representation in broadly tuned neurons enables the coding of a wide array of tastants with relatively few neurons.
Comparison with other sensory systems
In the olfactory system, as in the gustatory system, second-order neurons are more broadly tuned than their inputs. In Drosophila, for example, Wilson et al. (2004) showed that projection neurons in the antennal lobe that receive monosynaptic connections from narrowly tuned olfactory sensory neurons can respond to a broad array of odorants. The authors suggest that, because these “generalist” cells participate in many odor-evoked cellular ensembles, they can facilitate decoding of large number of noisy odor stimuli by separation of clusters in “odor stimulus space.” We would argue that the broadly tuned NTS cells may also function in that capacity in taste space through information conveyed by their temporal patterns of response. That is, while taken to the extreme an individual broadly tuned taste-responsive cell may represent the “taste stimulus space,” the responses of many broadly tuned cells may enhance the fidelity of the representation. Conversely, Wilson et al. (2004) showed that some projection neurons, called “specialists,” are narrowly tuned and may add greater acuity for odorants that have evolutionary significance for the animal. Narrowly tuned cells in the NTS may do the same in the gustatory system.
The present study adds to the growing literature suggesting that the temporal characteristics of neural firing patterns in broadly tuned cells is an important mechanism for neural coding in nearly all sensory systems (for review, see Lestienne, 2001). For example, in the auditory cortex of the cat, cells are broadly tuned for sound location. Consideration of the spike timing within the response significantly added to the accuracy of single cells and conferred the ability to localize sound across the entire 360° azimuth (Middlebrooks et al., 1994). Similarly, neural coding of texture by cells in the trigeminal ganglion (Arabzadeh et al., 2006) and barrel cortex of rats is also enhanced by spike timing, even when spike count is insufficient (Arabzadeh et al., 2006; Wolfe et al., 2008). In the visual cortex, Aronov et al. (2003) showed that spike timing at a resolution of ∼30 ms conveyed a significant amount of information about spatial phase. As reported here in the taste system, it has also been shown that multiple dimensions of the sensory domain can be encoded by the temporal characteristics of responses of single cells in the visual system. Gawne (2000) demonstrated that when contrast and orientation are varied simultaneously, temporal coding in V1 cells enables the encoding of both by a single neuron. Form and color are likewise multiplexed by cells in visual cortex by the rate envelopes of their responses (McClurkin and Optican, 1996), while spike count alone is relatively uninformative. In the present study, we show that single neurons in the NTS can use the firing rate envelope to represent an entire three-dimensional sensory domain. This finding is particularly striking because, if firing pattern is ignored, these broadly tuned cells would be unlikely candidates for carrying information about taste quality; when firing pattern is considered, the representation is comprehensive [i.e., “panoramic” (Middlebrooks et al., 1994)].
Evidence from other sensory systems suggests that temporal coding across multiple cells, i.e., population coding, can add accuracy to the sensory neural code. In the mouse olfactory system, recent work has shown that information about an olfactory stimulus is conveyed by the temporal dynamics of ensembles of olfactory bulb neurons rather than individual cells (Bathellier et al., 2008). Similarly, in the antennal lobe of Drosophila, information about odorants is carried by the temporal trajectory of the population vector (Mazor and Laurent, 2005). Neural coding of spatial phase in the visual system (Aronov et al., 2003) and sound localization in the auditory system (Furukawa et al., 2000) both benefit from consideration of the firing patterns in small ensembles of cells. Here we suggest that the firing rate envelope of responses in individual taste-responsive NTS cells, especially those that are most broadly tuned, can encode the three-dimensional domain of the taste world, and the addition of more cells may add to the precision of the representation, but need not change its fundamental character.
Footnotes
This work was supported by National Institute on Deafness and Other Communication Disorders Grant R01-DC006914 to P.M.D. and National Institutes of Health Grant R01-MH68012 to D. Gardner. We thank Mary Conte for her comments on an earlier draft of the manuscript.
References
- Ahissar E, Knutsen PM. Object localization with whiskers. Biol Cybern. 2008;98:449–458. doi: 10.1007/s00422-008-0214-4. [DOI] [PubMed] [Google Scholar]
- Arabzadeh E, Panzeri S, Diamond ME. Deciphering the spike train of a sensory neuron: counts and temporal patterns in the rat whisker pathway. J Neurosci. 2006;26:9216–9226. doi: 10.1523/JNEUROSCI.1491-06.2006. [DOI] [PMC free article] [PubMed] [Google Scholar]
- Aronov D, Victor JD. Non-Euclidean properties of spike train metric spaces. Phys Rev E Stat Nonlin Soft Matter Phys. 2004;69 doi: 10.1103/PhysRevE.69.061905. 061905. [DOI] [PMC free article] [PubMed] [Google Scholar]
- Aronov D, Reich DS, Mechler F, Victor JD. Neural coding of spatial phase in V1 of the macaque monkey. J Neurophysiol. 2003;89:3304–3327. doi: 10.1152/jn.00826.2002. [DOI] [PubMed] [Google Scholar]
- Bathellier B, Buhl DL, Accolla R, Carleton A. Dynamic ensemble odor coding in the mammalian olfactory bulb: sensory information at different timescales. Neuron. 2008;57:586–598. doi: 10.1016/j.neuron.2008.02.011. [DOI] [PubMed] [Google Scholar]
- Brown WM, Bäcker A. Optimal neuronal tuning for finite stimulus spaces. Neural Comput. 2006;18:1511–1526. doi: 10.1162/neco.2006.18.7.1511. [DOI] [PubMed] [Google Scholar]
- Chandrashekar J, Hoon MA, Ryba NJ, Zuker CS. The receptors and cells for mammalian taste. Nature. 2006;444:288–294. doi: 10.1038/nature05401. [DOI] [PubMed] [Google Scholar]
- Chen JY, Di Lorenzo PM. Responses to binary taste mixtures in the nucleus of the solitary tract: neural coding with firing rate. J Neurophysiol. 2008;99:2144–2157. doi: 10.1152/jn.01020.2007. [DOI] [PubMed] [Google Scholar]
- Chklovskii DB, Koulakov AA. Maps in the brain: what can we learn from them? Annu Rev Neurosci. 2004;27:369–392. doi: 10.1146/annurev.neuro.27.070203.144226. [DOI] [PubMed] [Google Scholar]
- Di Lorenzo PM, Hecht GS. Perceptual consequences of electrical stimulation in the gustatory system. Behav Neurosci. 1993;107:130–138. doi: 10.1037/0735-7044.107.1.130. [DOI] [PubMed] [Google Scholar]
- Di Lorenzo PM, Victor JD. Taste response variability and temporal coding in the nucleus of the solitary tract of the rat. J Neurophysiol. 2003;90:1418–1431. doi: 10.1152/jn.00177.2003. [DOI] [PubMed] [Google Scholar]
- Di Lorenzo PM, Victor JD. Neural coding mechanisms for flow rate in taste-responsive cells in the nucleus of the solitary tract of the rat. J Neurophysiol. 2007;97:1857–1861. doi: 10.1152/jn.00910.2006. [DOI] [PMC free article] [PubMed] [Google Scholar]
- Di Lorenzo PM, Hallock RM, Kennedy DP. Temporal coding of sensation: mimicking taste quality with electrical stimulation of the brain. Behav Neurosci. 2003;117:1423–1433. doi: 10.1037/0735-7044.117.6.1423. [DOI] [PubMed] [Google Scholar]
- Di Lorenzo PM, Leshchinskiy S, Moroney DN, Ozdoba JM. Making time count: functional evidence for temporal coding of taste sensation. Behav Neurosci. 2009;123:14–25. doi: 10.1037/a0014176. [DOI] [PMC free article] [PubMed] [Google Scholar]
- Erickson RP. Ohrwall, Henning and von Skramlik; the foundations of the four primary positions in taste. Neurosci Biobehav Rev. 1984;8:105–127. doi: 10.1016/0149-7634(84)90024-1. [DOI] [PubMed] [Google Scholar]
- Fishman IY. Single fiber gustatory impulses in rat and hamster. J Cell Physiol. 1957;49:319–334. doi: 10.1002/jcp.1030490213. [DOI] [PubMed] [Google Scholar]
- Furukawa S, Xu L, Middlebrooks JC. Coding of sound-source location by ensembles of cortical neurons. J Neurosci. 2000;20:1216–1228. doi: 10.1523/JNEUROSCI.20-03-01216.2000. [DOI] [PMC free article] [PubMed] [Google Scholar]
- Ganchrow JR, Erickson RP. Neural correlates of gustatory intensity and quality. J Neurophysiol. 1970;33:768–783. doi: 10.1152/jn.1970.33.6.768. [DOI] [PubMed] [Google Scholar]
- Gawne TJ. The simultaneous coding of orientation and contrast in the responses of V1 complex cells. Exp Brain Res. 2000;133:293–302. doi: 10.1007/s002210000381. [DOI] [PubMed] [Google Scholar]
- Hartigan JA, Hartigan PM. The dip test of unimodality. Ann Stat. 1985;13:70–84. [Google Scholar]
- Katz DB, Simon SA, Nicolelis MA. Dynamic and multimodal responses of gustatory cortical neurons in awake rats. J Neurosci. 2001;21:4478–4489. doi: 10.1523/JNEUROSCI.21-12-04478.2001. [DOI] [PMC free article] [PubMed] [Google Scholar]
- Kruskal JB, Wish M. Beverly Hills, CA: Sage; 1978. Multidimensional scaling. [Google Scholar]
- Lestienne R. Spike timing, synchronization and information processing on the sensory side of the central nervous system. Prog Neurobiol. 2001;65:545–591. doi: 10.1016/s0301-0082(01)00019-3. [DOI] [PubMed] [Google Scholar]
- Mazor O, Laurent G. Transient dynamics versus fixed points in odor representations by locust antennal lobe projection neurons. Neuron. 2005;48:661–673. doi: 10.1016/j.neuron.2005.09.032. [DOI] [PubMed] [Google Scholar]
- McClurkin JW, Optican LM. Primate striate and prestriate cortical neurons during discrimination. I. Simultaneous temporal encoding of information about color and pattern. J Neurophysiol. 1996;75:481–495. doi: 10.1152/jn.1996.75.1.481. [DOI] [PubMed] [Google Scholar]
- Middlebrooks JC, Clock AE, Xu L, Green DM. A panoramic code for sound location by cortical neurons. Science. 1994;264:842–844. doi: 10.1126/science.8171339. [DOI] [PubMed] [Google Scholar]
- Mistretta CM. A quantitative analysis of rat chorda tympani fiber discharge patterns. In: Schneider D, editor. Olfaction and taste IV. Stuttgart, Germany: Wissenschaftliche Verlagsgesellschaft; 1972. pp. 294–300. [Google Scholar]
- Nagai T, Ueda K. Stochastic properties of gustatory impulse discharges in rat chorda tympani fibers. J Neurophysiol. 1981;45:574–592. doi: 10.1152/jn.1981.45.3.574. [DOI] [PubMed] [Google Scholar]
- Ogawa H, Sato M, Yamashita S. Variability in impulse discharges in rat chorda tympani fibers in response to repeated gustatory stimulations. Physiol Behav. 1973;11:469–479. doi: 10.1016/0031-9384(73)90033-4. [DOI] [PubMed] [Google Scholar]
- Ogawa H, Yamashita S, Sato M. Variation in gustatory nerve fiber discharge pattern with change in stimulus concentration and quality. J Neurophysiol. 1974;37:443–457. doi: 10.1152/jn.1974.37.3.443. [DOI] [PubMed] [Google Scholar]
- Pouget A, Deneve S, Ducom JC, Latham PE. Narrow versus wide tuning curves: what's best for a population code? Neural Comput. 1999;11:85–90. doi: 10.1162/089976699300016818. [DOI] [PubMed] [Google Scholar]
- Roussin AT, Victor JD, Chen J-Y, Di Lorenzo PM. Variability in responses and temporal coding of tastants of similar quality in the nucleus of the solitary tract of the rat. J Neurophysiol. 2008;99:644–655. doi: 10.1152/jn.00920.2007. [DOI] [PMC free article] [PubMed] [Google Scholar]
- Smith DV, Travers JB. A metric for the breadth of tuning of gustatory neurons. Chem Senses. 1979;4:215–229. [Google Scholar]
- Victor JD. Spike train metrics. Curr Opin Neurobiol. 2005;15:585–592. doi: 10.1016/j.conb.2005.08.002. [DOI] [PMC free article] [PubMed] [Google Scholar]
- Victor JD, Purpura KP. Nature and precision of temporal coding in visual cortex: a metric-space analysis. J Neurophysiol. 1996;76:1310–1326. doi: 10.1152/jn.1996.76.2.1310. [DOI] [PubMed] [Google Scholar]
- Victor JD, Purpura KP. Metric-space analysis of spike trains: theory, algorithms and application. Network. 1997;8:127–164. [Google Scholar]
- Wilson RI, Turner GC, Laurent G. Transformation of olfactory representations in the Drosophila antennal lobe. Science. 2004;303:366–370. doi: 10.1126/science.1090782. [DOI] [PubMed] [Google Scholar]
- Wolfe J, Hill DN, Pahlavan S, Drew PJ, Kleinfeld D, Feldman DE. Texture coding in the rat whisker system: slip-stick versus differential resonance. PLoS Biol. 2008;6:e215. doi: 10.1371/journal.pbio.0060215. [DOI] [PMC free article] [PubMed] [Google Scholar]
- Zhang K, Sejnowski TJ. Neuronal tuning: to sharpen or broaden? Neural Comput. 1999;11:75–84. doi: 10.1162/089976699300016809. [DOI] [PubMed] [Google Scholar]


