

Abstract
Assays of human postmortem brain tissue have revealed that smokers have greater densities of high-affinity nicotinic acetylcholine receptors (nAChRs) in several brain regions than do nonsmokers or exsmokers. Quantitative PET imaging of nAChRs in humans has recently been reported using the α4β2* subtype–specific radioligand 2-18F-FA-85380 (2FA).
Methods
We used PET and 2FA to measure total volumes of distribution corrected for the free fraction of 2FA in plasma (VT/fP) in 10 nonsmokers and 6 heavy smokers (>14 cigarettes/d; abstinent for >36 h). Dynamic PET scans were performed over 8 h, commencing immediately after a bolus injection of 2FA. Anatomic sampling was performed on PET images that were coregistered to MR images acquired from each volunteer. Data were analyzed by Logan plots and by 1- and 2-tissue-compartment models using unbound, unmetabolized arterial 2FA concentration as the input function.
Results
All modeling methods yielded similar results. VT/fP was significantly higher in smokers than in nonsmokers in all brain regions tested, except the thalamus. We used measures of VT/fP and estimates of nondisplaceable volume of distribution and found 25%–200% higher values in smokers than in nonsmokers for the volume of distribution for the specific binding compartment in the frontal cortex, midbrain, putamen, pons, cerebellum, and corpus callosum. These findings were consistent with voxel-based analysis using statistical parametric mapping.
Conclusion
Our findings suggest that PET with 2FA can be used to study the role of nicotine-induced upregulation of nAChRs in active smokers and during smoking cessation.
Keywords: molecular imaging, PET, radiotracer tissue kinetics, neuroimaging, nicotinic acetylcholine receptors, smoking
Each year, more than 400,000 deaths are related to smoking in the United States (1), and it is estimated that smoking-related illnesses will kill 1 billion people worldwide this century (2). The need for improved treatments for smoking cessation is obvious, as smoking relapse is currently greater than 80% (3). Understanding the mechanisms underlying the addictive aspects of smoking could be helpful for developing strategies to assist with smoking cessation.
Nicotine, the principal addictive component in tobacco, interacts with both central and peripheral neuronal nicotinic acetylcholine receptors (nAChRs). These receptors, which are pentomeric ligand–gated ion channels, are known to exist in various homomeric and heteromeric forms in the mammalian brain.
Heteromeric nicotinic receptors that contain the α4 and β2 subunits, possibly with other subunits (herein designated as α4β2*), are the predominant subtype in the mammalian brain and are the likely substrate for the addictive effects of nicotine. This idea is supported by several lines of evidence: these receptors have the highest affinity for nicotine (4); the density of these receptors is greater in smokers and chronically nicotine-treated animals than in nonsmokers (5,6) and saline-treated animals (7,8), respectively, and the density of these receptors in exsmokers is similar to that in nonsmokers (5,6); whereas mice lacking the β2 subunit fail to self-administer nicotine (9), mice with restored functioning β2 subunits will self-administer nicotine (10); and mice with hypersensitive α4 subunits show greater sensitivity to the rewarding properties of nicotine (11). That mice lacking α4β2* nAChRs do not self-administer nicotine and that the density of α4β2* nAChRs is greater in smokers, but not in exsmokers, compared with nonsmokers (5,6), suggest that the density of these receptors may be important in maintaining smoking.
Imaging could provide an important tool for studying the role of α4β2* nAChRs in smoking behavior. Since the first postmortem studies showing greater nAChR densities in smokers than in nonsmokers, A-85380 and its analogs have been shown to have high affinity for and to be selective for α4β2* nicotinic receptors (12). In mice, most of the receptors containing β2 subunits also contain α4 subunits as shown by the near identity of autoradiographic images of nicotinic receptors in mice lacking the gene for the β2 subunit and mice lacking the gene for the α4 subunit (12,13). The radiolabeled forms of A-85380 analogs bind to nicotinic receptors containing β2 subunits, most likely in combination with α4 subunits, making these radioligands uniquely suitable for comparing the densities of nicotinic receptors in smokers and nonsmokers. The SPECT radioligand 5-123I-I-A-85380 (14) and the PET radioligands 6-18F-FA-85380 (15) and 2-18F-FA-85380 (2FA) (16,17), the latter of which is used in this study, have been used successfully to image nAChRs in humans.
Imaging of nicotinic receptors in vivo in animals and humans with PET can directly address questions that could not previously be answered. For instance, in animal models, studies can be designed to quantify receptors before and after the initiation of nicotine self-administration, to determine the time course of upregulation. In human smokers during prolonged smoking abstinence, studies can be designed to determine both the time course for the return of receptor densities to control values (5,6) and the correlation of this dynamic effect with smoking withdrawal symptoms and smoking cessation success. If nAChR density during smoking is an underlying factor in nicotine dependence, knowledge of changes in the density of this receptor could help in developing strategies for the treatment and prevention of nicotine dependence. PET also shows the distribution of the effects of smoking on nAChR density in the whole brain, whereas only selected regions are assayed in in vitro studies. However, because of the limitations of in vivo imaging techniques, the sensitivity of PET and 2FA for observing receptor density differences between smokers and nonsmokers must be evaluated first. Therefore, the goal of the current study was to assess whether this method is sensitive enough to detect the differences between smokers and nonsmokers and, if so, to determine the magnitude of the difference observed in vivo.
Materials and Methods
The Institutional Review Board of the National Institute on Drug Abuse Intramural Research Program approved the design of this study. The radioligand was administered to the human volunteers under an investigational new drug application to the Food and Drug Administration.
Data are presented as mean ± SD or as range. Participants were healthy smokers (n = 6; 1 woman; age, 33 ± 8 y [19–45 y]) or healthy nonsmokers (n = 10; 4 women, 1 exsmoker; age, 28 ± 8 y [19–38 y]). The smokers reported smoking 15–30 cigarettes/d (19 ± 2.9) for 16 ± 10 y. To be included in the smoking group, participants had to have smoked at least 15 cigarettes/d for at least the last 2 consecutive years. Nonsmokers were admitted to the study if they had never smoked or had ceased smoking at least 2 y before the start of the study. All participants in this study were right-handed, except for 1 man in the nonsmoking group. Smokers weighed 85 ± 15 kg, and nonsmokers weighed 75 ± 21 kg.
Volunteers (age, 18–45 y) were recruited through newspaper and television advertisements and by word of mouth. Participants were excluded if they had an IQ score of less than 80 (Shipley Institute of Living Scale (18)), current (SCL-90 (19)) or past psychopathology (Diagnostic Interview Schedule for DSM-IV (20)), or evidence of acute or chronic medical problems (as assessed by medical history, physical examination, and routine blood screening). Potential participants with a significant drug use history were also excluded (21). Smokers abstained from smoking 36–48 h before each scan (∼15 half-lives for nicotine). All volunteers gave written informed consent to participate after receiving an explanation of the study and its procedures.
Procedures
At least 5 d before the scheduled scan, usually immediately after the participants gave consent, smokers were asked to smoke 1 of their usual cigarettes. Carbon monoxide (CO) levels (Vitalograph, Inc.) were obtained before and after the participant smoked the cigarette to ascertain the smoker's CO level after being abstinent for 1–3 h and immediately after smoking a cigarette. CO levels ranged from 10 to 28 ppm (mean, 22 ppm) before smoking and from 17 to 35 ppm (mean, 27 ppm) after smoking. The Fagerstrom score for each smoker was obtained, and these scores ranged from 2 to 7 (3.6 ± 1.9). Participants spent the night before the scan on a supervised ward. The duration of smoking abstinence was established by participant self-report and confirmed by CO monitoring on arrival at the unit and again 2–3 h before the PET scan. CO levels ranged from 0 to 3 ppm on the morning of the scan. Blood samples from female participants were tested to rule out current pregnancy.
The radiochemistry procedure was as follows: a 2FA injection was prepared by a semiautomated modification of the method described previously (22) and formulated as a sterile, apyrogenic solution in saline. The radiochemical purity of 2FA was greater than 95%.
PET Scans
After a transmission scan, dynamic PET scans with arterial blood collection (22 samples) commenced with the bolus administration of 2FA (1.9 ± 0.5 MBq/kg [0.052 ± 0.012 mCi/kg], 6.2 ± 3.8 pmol/kg; specific activity, 456 ± 305 GBq/μmol at time of injection). PET images were acquired with an ECAT Exact HR+ scanner (Siemens) in 3-dimensional mode. The participant's head was aligned so that scanning was parallel to the cantomeatal line. Scanning continued for 8 h, with 3–5 breaks as needed for the participant to void and consume lunch and low-fat snacks. A thermoplastic mask was molded to each participant's head and worn during scans to reduce head motion and facilitate repositioning after breaks.
Analysis of 2FA in Plasma
Typically, 22 blood samples of 3 mL each were taken from the participant's radial artery at predetermined intervals over 7–8 h after 2FA injection. The fraction of unmetabolized 2FA was determined using high-performance liquid chromatography (23), and plasma protein binding of 2FAwas determined by ultrafiltration (24) with a Centricon YM-10 filtration device (Millipore Corp.).
Structural MRI
T1-weighted structural MRI was performed for all participants on either a 1.5-T Signa scanner (GE Healthcare) or a 3-T Allegra scanner (Siemens) for anatomic reference (isotropic voxels, 1 mm3; repetition time, 2.5 s; echo time, 4.38 ms; flip angle, 8).
Volume-of-Interest (VOI) Data Analysis
Dynamic frame data from the PET scans were used to obtain time–activity curves for the thalamus, pons, midbrain, cerebellum, putamen, frontal cortex, and corpus callosum. For these reported data, region of interest refers to the structure in 2-dimensional space (e.g., on a slice), and VOI refers to the structure in 3-dimensional space (i.e., summation of regions of interest in 2 dimensions). Motion- and decay-corrected dynamic frames were combined into 1 set of dynamic images that was averaged over time (0–480 min). The MR images of each participant were coregistered to his or her average PET images. The alignment algorithms from this process were applied to corresponding dynamic PET images for each individual. Templates for each of the 7 structures were drawn bilaterally on 2–4 adjacent sections of the MR image set from a representative participant. This standard template was copied to each participant's MR images, and the position was adjusted, if necessary, without resizing. The adjusted template was applied to the respective dynamic PET images. The value for radioactivity in each structure at each time point for each participant is the average of all pixels in all ROIs assayed for that structure, yielding a VOI for each structure. This process yielded time–activity curves for each of the 7 regions of interest for each participant. PMOD (version 2.75; PMOD Technologies Ltd.) was used to calculate total volume of radioligand distribution corrected for the free fraction in plasma (designated as VT/fP based on the nomenclature suggested by Innis et al. (25)). The VT/fP values for each structure were determined by 3 models: the classic Logan analysis and the 1-tissue- and 2-tissue-compartment models, each with the arterial time–activity curve for unbound, unmetabolized 2FA as the input function.
Whole-Brain Group Comparisons
Parametric maps of VT/fP were generated with PMOD for each participant using classic Logan analysis and the arterial input function for unbound, unmetabolized 2FA. To obtain average parametric maps for each group (smokers and nonsmokers), each participant's MR images were normalized to the Montreal Neurologic Institute T1 template, and the algorithm from each participant's MRI spatial normalization was applied to that participant's parametric images. The spatially normalized images were averaged for each group, yielding 2 average parametric maps, 1 for each group.
Statistical Parametric Mapping (SPM) Voxel-Based Analysis
The same Logan-modeled PET images spatially normalized to standard space were used for SPM analysis. Each participant's parametric image was coregistered to the T1-weighted structural MR image by means of a normalized mutual information algorithm using PMOD 2.75.
The normalized PET images were entered into a 2-sample t test design with 6 smokers and 10 nonsmokers using SPM99 (Wellcome Trust Centre for Neuroimaging). The contrasts for which we tested included VT/fP values for smokers that were greater or less than values for nonsmokers using a voxelwise threshold of P less than 0.01 for a minimum cluster size of 100 contiguous voxels. We purposefully chose a low threshold so that we could detect any regions in which VT/fP was greater in nonsmokers than in smokers.
Results
Radioactivity in Plasma and Brain Tissue
Comparing the standardized uptake value (SUV) in the arterial plasma of smokers with that in the arterial plasma of nonsmokers revealed that total plasma radioactivity tended to be greater in smokers than in nonsmokers (Fig. 1). In contrast, the fraction of radioactivity that corresponded to unmetabolized 2FA was lower in smokers, especially at later time points, reaching 52% ± 3% of total radioactivity for smokers and 56% ± 4% for nonsmokers at 8 h after injection (Fig. 2). The fraction of free 2FA (not bound to plasma protein) was similar in both groups (smokers, 72% ± 4%, vs. nonsmokers, 75% ± 7%). Therefore, the average time–activity curves for unbound, unmetabolized 2FA in the arterial plasma of smokers and nonsmokers were close (Fig. 1). None of the differences in the 3 pairs of plasma curves between smokers and nonsmokers was significant. Time–activity curves for brain regions assayed in a representative smoker and a representative nonsmoker are shown in Figure 3.
FIGURE 1.
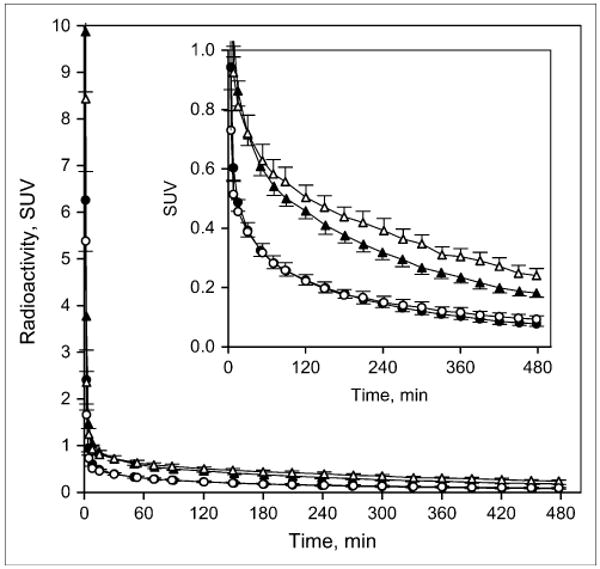
Time–activity curves for total radioactivity (triangles) and for radioactivity corresponding to unmetabolized 2FA (circles) in smokers (open symbols) and nonsmokers (filled symbols), presented as SUV (fraction of injected dose/g of body weight absorbed in 1 g of tissue). Insert shows same data with expanded y-axis. Values are given as mean ± SEM.
FIGURE 2.
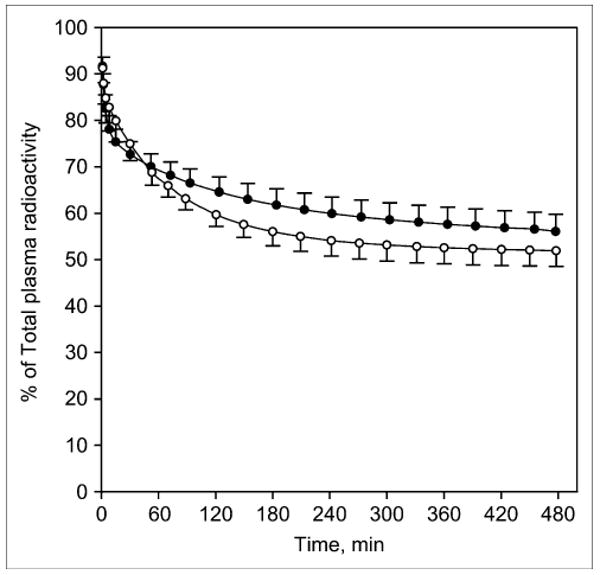
Time–activity curves showing radioactivity corresponding to unmetabolized 2FA as fraction of total radioactivity in smokers (○) and nonsmokers (●). Values are given as mean ± SEM.
FIGURE 3.
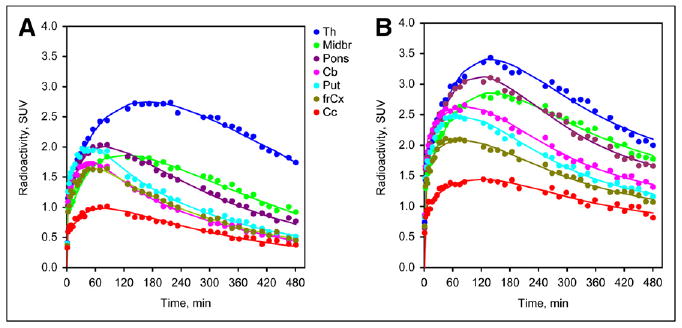
Representative time–activity curves for several brain regions in a nonsmoker (A) and a smoker (B) for thalamus (Th), frontal cortex (frCx), cerebellum (Cb), midbrain (Midbr), pons, putamen (Put), and corpus callosum (Cc). As expected, peak radioactivity expressed as SUV for regions assayed was greatest for thalamus > putamen = pons > midbrain > cerebellum = frontal cortex > > corpus callosum for nonsmokers. SUV for smokers revealed similar pattern, but peak values were greater.
Similar VT/fP values for each of the regions mentioned were obtained from the 3 modeling procedures used in the VOI analysis (nonsmokers, Fig. 4A; smokers, Fig. 4B); however, a tendency for values calculated with the 2-tissue-compartment model to give slightly higher values for both groups was demonstrated. The pattern of VT/fP values in nonsmokers was consistent with patterns previously observed in participants in other studies using PET and 2FA (17,26) or SPECT and 5IA (27) and in postmortem tissue analyses (5,6). In this pattern, the greatest values were observed in the thalamus; intermediate values in the pons and midbrain; lower values in the cerebellum, putamen, and frontal cortex; and the lowest values in the corpus callosum.
FIGURE 4.
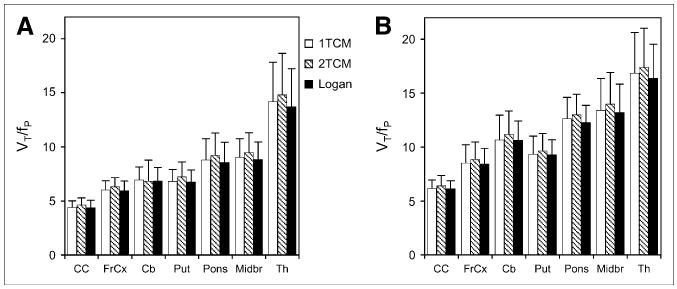
Values for VT/fP for various brain regions in nonsmokers (A) and smokers (B). Values were obtained by Logan graphical analysis and 1- and 2-tissue-compartment models (1TCM and 2TCM, respectively). Values are given as mean ± SD. CC = corpus callosum; FrCx = frontal cortex; Cb = cerebellum; Put = putamen; Midbr = midbrain; Th = thalamus.
All regions for which VT/fP was determined showed greater values in smokers than in nonsmokers (Fig. 5), regardless of the modeling methods used. As shown, the greatest absolute differences between nonsmokers and smokers were in the cerebellum, midbrain, and pons, followed by the putamen, frontal cortex, and thalamus; the corpus callosum showed the smallest difference. All these differences, except that in the thalamus, were statistically significant (P < 0.01, 1-tailed t test with Bonferroni correction for multiple comparisons). When the absolute differences were converted to percentage of values in nonsmokers, the greatest percentage differences were observed in the corpus callosum, followed by the cerebellum and frontal cortex. The percentage differences in the midbrain and pons were moderate, and those in the thalamus were smallest.
FIGURE 5.
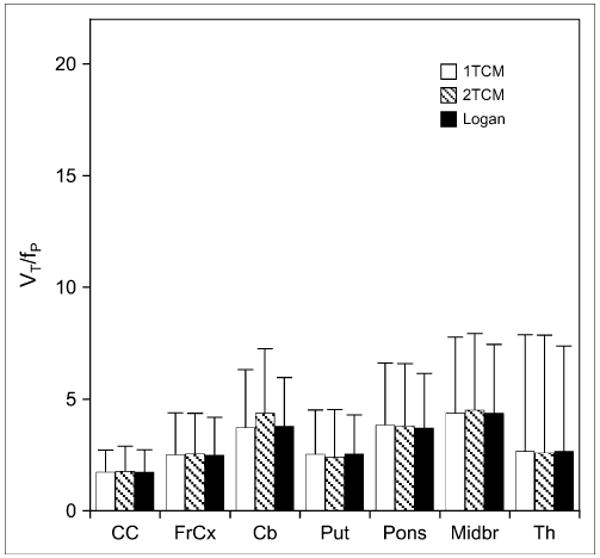
Values for differences between smokers and nonsmokers in VT/fP for same brain regions shown in Figure 4 obtained by Logan graphical analysis and 1- and 2-tissue-compartment models (1TCM and 2TCM, respectively). Values are given as mean ± SD. CC = corpus callosum; FrCx = frontal cortex; Cb = cerebellum; Put = putamen; Midbr = midbrain; Th = thalamus.
Parametric Images
The increase in VT/fP described for the various structures can be observed in the average parametric images for nonsmokers (Fig. 6, top) and smokers (Fig. 6, middle). Figure 6 also shows the same pattern of greater VT/fP in smokers than in nonsmokers over the entire brain.
FIGURE 6.
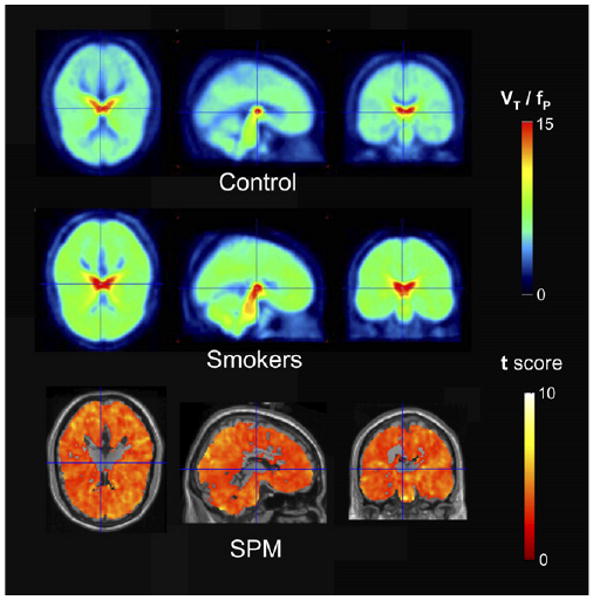
SPM comparison of smokers and nonsmokers: average parametric map of nonsmokers (control), average parametric map of smokers, and SPM comparison of smokers and nonsmokers. All panels show areas of brain in which VT/fP was greater for smokers than for nonsmokers. Opposite comparison yielded no areas in which VT/fP was greater for nonsmokers than for smokers. Minimum number of contiguous voxels for this analysis was 100. For images shown, total number of voxels tested was 190,993, and 17,980 were significant using a corrected P value of 0.01.
SPM analysis confirmed these results, showing that the difference in VT/fP in smokers for the entire brain, with the exception of the thalamus, was significantly greater than the difference in VT/fP in nonsmokers. The comparison shown in the bottom panel of Figure 6 is for voxel clusters in which VT/fP in smokers was greater than that in nonsmokers. The reverse comparison yielded no area of the brain in which the VT/fP value in nonsmokers was greater than that in smokers.
Discussion
Our study demonstrated greater VT/fP, which reflects greater receptor density, in the brains of smokers than in nonsmokers. The in vivo results of this study are consistent with in vitro data and suggest that PET studies with 2FA provide a reliable method for further testing the role of nAChR density in smoking behavior and smoking cessation.
We observed significantly greater values (P < 0.01 by a 1-tailed t test with Bonferroni correction) for VT/fP in smokers than in nonsmokers in all the specifically evaluated brain structures, except the thalamus. These findings were reinforced by the SPM analysis, which revealed significant increases across almost the entire brain but not in the thalamus. In addition, the SPM analysis revealed that no brain region exhibited the opposite condition (i.e., VT/fP in nonsmoker > VT/fP in smoker). These observations were consistent with several reports of greater receptor densities in smokers than in nonsmokers in studies of postmortem tissue (5,6) and results from in vivo studies (28–30). We observed the greatest differences in VT/fP in the cerebellum and midbrain, with frontal cortex and pons also showing differences. Effects in the midbrain are intriguing because the midbrain includes the ventral tegmental area and the substantia nigra, regions that provide dopaminergic input to the dorsal and ventral striatum, and because of the known involvement of these brain areas in the actions of drugs of abuse. The SPM maps presented in the report by Wüllner et al. (29) showing increased VT/fp in the cerebellum and brain stem are somewhat different from our SPM maps, which show more global effects. The most likely reason for this discrepancy is a difference in analytic procedures. We directly compared VT/fp images from smokers' and nonsmokers' brains, whereas Wüllner et al. (29) normalized the VT/fp images before comparison, using proportional global scaling. Therefore, their statistical maps reflect only those regions in smokers' brains for which the extent of increase in regional VT/fp values exceeded the increase in average VT/fp values for the whole brain.
The primary outcome measure determined in this PET study was VT/fP. The finding of the significant difference in VT/fP between smokers and nonsmokers suggests that studies with PET and 2FA provide sufficient sensitivity to evaluate the effects of smoking on nAChRs. Nevertheless, VT/fP is not a direct measure of receptor density; it includes both specific and nonspecific components of radioligand accumulation. As reported previously (26), we also found that k3 and k4 for 2FA obtained using the 2-tissue-compartment model were poorly identified (data not shown). Therefore, to provide values for VS (specific binding compartment; VS = k3/k4) from VT, the estimates of nondisplaceable volume of distribution (VND) were required. Within the context of this study, we did not determine the VND/fP by blocking the receptors. Brody et al. (31) reported that nicotine from smoking to satiety occupies 95% of nAChRs in a study using 2FA as the radioligand. Smoking a single cigarette reduces available receptors by 88% (31). Although it is unlikely that blocking studies with nicotine can be performed in nonsmokers, future studies with more selective ligands or ligands characterized by nicotine-antagonistic properties may provide this information.
To compare the magnitude of the differences in receptor binding between smokers and nonsmokers that can be measured in vivo with PET with those obtained in vitro, we estimated the average distribution volume of the specific binding compartment (VS/fP) in both groups, assuming that the average VND/fP values for smokers and nonsmokers were the same. To accommodate for the absence of a validated value for VND/fP, we calculated the VS/fP for several possible VND/fP values, ranging from 3.5 to 5. This range was chosen based on VND/fP values for 2FA in rhesus monkey brain regions obtained from blocking studies with cytisine (24). Notably, these values were similar to the VT/fP values for the corpus callosum in nonsmokers. We used these values to estimate the possible percentage increases in VS/fP in smokers, compared with nonsmokers (Table 1). The values for the difference in VS/fP for smokers are given as a percentage of VS/fP for nonsmokers. The greatest percentage difference was in the cerebellum and frontal cortex, the smallest percentage difference was in the thalamus, and intermediate values were observed in the midbrain, pons, and putamen.
TABLE 1.
VS in Smokers as Percentage Nonsmoker
| VND/fP | VS/fP | |||||
|---|---|---|---|---|---|---|
| Frontal cortex | Cerebellum | Putamen | Pons | Midbrain | Thalamus | |
| 3.5 | 197% | 217% | 172% | 171% | 179% | 125% |
| 4 | 220% | 237% | 185% | 178% | 186% | 126% |
| 4.5 | 258% | 266% | 202% | 187% | 196% | 127% |
| 5 | 330% | 310% | 228% | 198% | 207% | 129% |
Data are differences in VS/fP in smokers, give as percentage of VS/fP in nonsmokers, for various values of VND/fP.
The assumption of equal VND/fP in smokers and nonsmokers is appropriate for 2 reasons. First, nicotine is unlikely to change the tissue composition responsible for nonspecific accumulation of 2FA. Second, even if the rate of metabolism for 2FA is slightly greater in smokers than in nonsmokers, additional accumulation of radiolabeled metabolites in the brains of smokers leading to an increase in apparent VND/fP is unlikely, as data from our studies in rodents (Alexey G. Mukhin and D. Bruce Vaupel, unpublished data, 2005) showed practically no accumulation of 2FA metabolites in brain.
The magnitude of the differences in VT/fP between smokers and nonsmokers was similar to that found in a recent SPECT study (28). In that study and in the present PET study, almost no difference in VT/fP in the thalamus was demonstrated. This lack of increase in the thalamus is not in agreement with the observations in a study of postmortem tissue showing values for the Bmax in smokers that were almost 2-fold those in nonsmokers (5). A possible explanation is that the smokers in our study smoked fewer cigarettes/d (i.e., 15–30) than the smokers in the study by Breese et al. (10–60 cigarettes/d) (5). In rodents, the difference in receptor density between nicotine and saline treatment is related to nicotine exposure in a dose-dependent fashion, and only high doses of nicotine are associated with significant increases in nAChRs in the thalamus (32).
As mentioned, the observed changes in VT/fP were similar to those observed with SPECT and 5IA as the radioligand (28). This similarity was somewhat unexpected. If the same individuals were scanned at the same time relative to their last cigarette, a larger percentage difference in smokers than in nonsmokers would have been expected for the radioligand with a higher specific-to-nonspecific equilibrium partition coefficient (BPND) (VS/VND). Consistent with the known BPND for 2FA and 5IA in the primate thalamus (∼2 and ∼4, respectively (24,33)), the greater percentage difference in VT/fP should have been observed if the SPECT study had been performed in the same time frame. That the percentage differences in VT/fP measured with 2FA at 2 d after the last smoked cigarette are similar to those assayed with 5IA at approximately 7 d after the last cigarette suggests that the receptor density in the smokers has already started to decline at 7 d. Receptor densities in exsmokers that were similar to those in nonsmokers after more than 2 mo of smoking cessation were observed previously in postmortem tissue (5,6). In nicotine-treated mice, the upregulation of nAChRs disappears 8 d after treatment termination (34).
Additional support for the suggestion that data acquired at 7 d after the onset of smoking cessation reflect the decline in nAChRs at that time point comes from another study using 5IA (30), which showed that values for smokers at 10 d after the onset of smoking cessations were only 8%–26% above those for nonsmokers, and at 21 d values were similar to those for nonsmokers. Taken together, results from 2 published SPECT studies (28,30) and the current PET study suggest that the greater receptor density in smokers declines over the first 3 wk after smoking cessation and approaches the level observed in nonsmokers. With the assumption that this decline can be described by a monoexponential function, these results suggest that the half-life for this decline is between 3 and 6 d and that receptor densities assayed in smokers at 2, 7, and 11 d after cessation probably underestimate the initial receptor density differences between nonsmokers and smokers by approximately 20%, 60%, and 75%, respectively.
The smokers in our study were abstinent for 36–48 h at the time of the PET study. It is reasonable to speculate that this interval is not enough for nicotine clearance to be complete and that some nicotine may remain in the body to compete with 2FA for the binding sites. Nonetheless, on the basis of the half-life of nicotine in humans (2.5 h (35)), we expected the concentration of nicotine in plasma to be 1/20,000th of the concentration in the plasma after our volunteers' last cigarette. If the plasma nicotine concentration after the last cigarette was in the range of 100 ng/mL, which is on the high end of usually observed concentrations (36), 36 h later the expected nicotine concentration would be 0.005 ng/mL, which is far below the detectable level. Assuming that the effective concentration to occupy 50% of the receptors labeled by 2FA in humans is 0.87 ng/mL (31), the percentage occupancy of receptors by residual nicotine should be less than 1%. However, we cannot exclude the possibility that a metabolite of nicotine with a longer half-life may bind to these receptors and diminish the VT/fP values.
Our findings and those of other neuroimaging studies of the effect of smoking on nAChRs showed greater densities of these receptors in smokers, but the effect was not consistent throughout the brain. The thalamus, which has the greatest receptor density in both groups, showed little increase, whereas other regions such as the cerebellum showed a substantially greater receptor density in smokers than in nonsmokers. The knowledge that nAChRs can be desensitized by nicotine leads to the idea that upregulation might be a mechanism to compensate for desensitization (37). The role of desensitization of these receptors in upregulation has recently been questioned. Several mechanisms have been proposed to explain upregulation of nicotinic receptors, one of which suggests that nicotine inhibits the degradation of nAChRs (38). Another possible explanation is that nicotine affects phosphorylation of the receptors (39). Yet another hypothesis is that nicotine enhances the assembly of the subunits into channels (40). Increased assembly of nicotinic receptors induced by nicotine could explain why nicotine fails to upregulate nAChRs in the thalamus if the receptors are already being assembled or moved to the cell surface at the maximum rate. In other words, there may be some endogenous substance (e.g., choline) in thalamic cells that assists in the assembly of nAChRs and that is present at lower concentrations in cells in other brain regions expressing nicotinic receptors.
Conclusion
The greater density of nicotinic receptors in smokers than in nonsmokers that has been revealed in assays of postmortem tissue can be observed and quantified in vivo with PET and 2FA. The ability to follow changes in these receptors and to correlate those changes with nicotine dependence and smoking cessation in living subjects will provide insight into the changes in these receptors as they relate to nicotine addiction.
Acknowledgments
A preliminary report of this study was presented at the 2006 NeuroReceptor Mapping Meeting in Copenhagen, Denmark. We acknowledge Peter Willis, Andrew Hall, and Larry Koenig for radiosynthesis of the radioligand; Varughese Kurian and Amy Kunce for maintaining the PET camera and acquiring the PET scans; Dean Shumway for analyzing the blood samples; Betty Jo Salmeron for her medical expertise; and Joyce Lutz, Kathy Demuth, and the rest of the National Institute on Drug Abuse (NIDA) nursing staff for their medical assistance with the study. This study was supported by the Intramural Research Program of the NIDA.
References
- 1.Fellows JL, Trosclair A, Adams EK, Rivera CC. Annual smoking-attributable mortality, years of potential life lost, and economic costs: United States, 1995–1999. MMWR Morb Mortal Wkly Rep. 2002;51:300–303. [PubMed] [Google Scholar]
- 2.Mackay J, Eriksen M, Shafey O. The Tobacco Atlas. 2nd. Atlanta, GA: American Cancer Society; 2006. [Google Scholar]
- 3.Westman EC, Rose JE. Nicotine replacement therapies and beyond. In: Piasecki M, Newhouse P, editors. Nicotine in Psychiatry. Washington, DC: American Psychiatric Press; 1999. pp. 215–233. [Google Scholar]
- 4.Xiao Y, Baydyuk M, Wang HP, Davis HE, Kellar KJ. Pharmacology of the agonist binding sites of rat neuronal nicotinic receptor subtypes expressed in HEK 293 cells. Bioorg Med Chem Lett. 2004;14:1845–1848. doi: 10.1016/j.bmcl.2003.09.105. [DOI] [PubMed] [Google Scholar]
- 5.Breese CR, Marks MJ, Logel J, et al. Effect of smoking history on [3H]nicotine binding in human postmortem brain. J Pharmacol Exp Ther. 1997;282:7–13. [PubMed] [Google Scholar]
- 6.Court JA, Lloyd S, Thomas N, et al. Dopamine and nicotinic receptor binding and the levels of dopamine and homovanillic acid in human brain related to tobacco use. Neuroscience. 1998;87:63–78. doi: 10.1016/s0306-4522(98)00088-8. [DOI] [PubMed] [Google Scholar]
- 7.Collins AC, Marks MJ, Pauly JR. Differential effect of chronic nicotine treatment on nicotinic receptor numbers in various brain regions of mice. J Subst Abuse. 1989;1:273–286. [PubMed] [Google Scholar]
- 8.Marks MJ, Stitzel JA, Collins AC. Influence of kinetics of nicotine administration on tolerance development and receptor levels. Pharmacol Biochem Behav. 1987;27:505–512. doi: 10.1016/0091-3057(87)90355-8. [DOI] [PubMed] [Google Scholar]
- 9.Epping-Jordan MP, Picciotto MR, Changeux JP, Pich EM. Assessment of nicotinic acetylcholine receptor subunit contributions to nicotine self-administration in mutant mice. Psychopharmacology (Berl) 1999;147:25–26. doi: 10.1007/s002130051135. [DOI] [PubMed] [Google Scholar]
- 10.Maskos U, Molles BE, Pons S, et al. Nicotine reinforcement and cognition restored by targeted expression of nicotinic receptors. Nature. 2005;436:103–107. doi: 10.1038/nature03694. [DOI] [PubMed] [Google Scholar]
- 11.Tapper AR, McKinney SL, Nashmi R, et al. Nicotine activation of α4* receptors: sufficient for reward, tolerance, and sensitization. Science. 2004;306:1029–1032. doi: 10.1126/science.1099420. [DOI] [PubMed] [Google Scholar]
- 12.Mukhin AG, Gündisch D, Horti AG, et al. 5-Iodo-A-85380, an α4β2 subtype-selective ligand for nicotinic acetylcholine receptors. Mol Pharmacol. 2000;57:642–649. doi: 10.1124/mol.57.3.642. [DOI] [PubMed] [Google Scholar]
- 13.Ross SA, Wong JY, Clifford JJ, et al. Phenotypic characterization of an α4 neuronal nicotinic acetylcholine receptor subunit knock-out mouse. J Neurosci. 2000;20:6431–6441. doi: 10.1523/JNEUROSCI.20-17-06431.2000. [DOI] [PMC free article] [PubMed] [Google Scholar]
- 14.Fujita M, Seibyl JP, Vaupel DB, et al. Whole-body biodistribution, radiation absorbed dose, and brain SPET imaging with [123I]5-I-A-85380 in healthy human subjects. Eur J Nucl Med Mol Imaging. 2002;29:183–190. doi: 10.1007/s00259-001-0695-z. [DOI] [PubMed] [Google Scholar]
- 15.Ding YS, Fowler JS, Logan J, et al. 6-[18F]fluoro-A-85380, a new PET tracer for the nicotinic acetylcholine receptor: studies in the human brain and in vivo demonstration of specific binding in white matter. Synapse. 2004;53:184–189. doi: 10.1002/syn.20051. [DOI] [PubMed] [Google Scholar]
- 16.Bottlaender M, Valette H, Roumenov D, et al. Biodistribution and radiation dosimetry of 18F-fluoro-A-85380 in healthy volunteers. J Nucl Med. 2003;44:596–601. [PubMed] [Google Scholar]
- 17.Kimes AS, Horti AG, London ED, et al. 2-[18F]F-A-85380: PET imaging of brain nicotinic acetylcholine receptors and whole body distribution in humans. FASEB J. 2003;17:1331–1333. doi: 10.1096/fj.02-0492fje. [DOI] [PubMed] [Google Scholar]
- 18.Zachary RA. Shipley Institute of Living Scale. 4th. Los Angeles, CA: Western Psychological Services; 1986. [Google Scholar]
- 19.Derogatis LR, Lipman RS, Covi L. SCL-90: an outpatient psychiatric rating scale—preliminary report. Psychopharmacol Bull. 1973;9:13–28. [PubMed] [Google Scholar]
- 20.Robins L, Cottler L, Bucholz K, Compton W. Diagnostic Interview Schedule for DSM-IV. St. Louis, MO: Washington University; 1995. [Google Scholar]
- 21.Kimes AS, Chefer SI, Matochik JA, et al. Quantification of nicotinic acetylcholine receptors in the human brain with PET: bolus plus infusion administration of 2-[18F]F-A85380. Neuroimage. 2008;39:717–727. doi: 10.1016/j.neuroimage.2007.09.01. [DOI] [PMC free article] [PubMed] [Google Scholar]
- 22.Horti AG, Scheffel U, Koren AO, et al. 2-[18F]fluoro-A-85380: an in vivo tracer for the nicotinic acetylcholine receptors. Nucl Med Biol. 1998;25:599–603. doi: 10.1016/s0969-8051(98)00031-6. [DOI] [PubMed] [Google Scholar]
- 23.Shumway DA, Pavlova OA, Mukhin AG. A simplified method for the measurement of nonmetabolized 2-[18F]F-A-85380 in blood plasma using solid-phase extraction. Nucl Med Biol. 2007;34:221–228. doi: 10.1016/j.nucmedbio.2006.12.001. [DOI] [PubMed] [Google Scholar]
- 24.Chefer SI, London ED, Koren AO, et al. Graphical analysis of 2-[18F]FA binding to nicotinic acetylcholine receptors in Rhesus monkey brain. Synapse. 2003;48:25–34. doi: 10.1002/syn.10180. [DOI] [PubMed] [Google Scholar]
- 25.Innis RB, Cunningham VJ, Delforge J, et al. Consensus nomenclature for in vivo imaging of reversibly binding radioligands. J Cereb Blood Flow Metab. 2007;27:1533–1539. doi: 10.1038/sj.jcbfm.9600493. [DOI] [PubMed] [Google Scholar]
- 26.Gallezot JD, Bottlaender M, Grégoire MC, et al. In vivo imaging of human cerebral nicotinic acetylcholine receptors with 2-18F-fluoro-A-85380 and PET. J Nucl Med. 2005;46:240–247. [PubMed] [Google Scholar]
- 27.Fujita M, Ichise M, van Dyck CH, et al. Quantification of nicotinic acetylcholine receptors in human brain using [123I]5-I-A-85380 SPET. Eur J Nucl Med Mol Imaging. 2003;30:1620–1629. doi: 10.1007/s00259-003-1320-0. [DOI] [PubMed] [Google Scholar]
- 28.Staley JK, Krishnan-Sarin S, Cosgrove KP, et al. Human tobacco smokers in early abstinence have higher levels of β2* nicotinic acetylcholine receptors than nonsmokers. J Neurosci. 2006;26:8707–8714. doi: 10.1523/JNEUROSCI.0546-06.2006. [DOI] [PMC free article] [PubMed] [Google Scholar]
- 29.Wüllner U, Gündisch D, Herzog H, et al. Smoking upregulates α4β2* nicotinic acetylcholine receptors in the human brain. Neurosci Lett. 2008;430:34–37. doi: 10.1016/j.neulet.2007.10.011. [DOI] [PubMed] [Google Scholar]
- 30.Mamede M, Ishizu K, Ueda M, et al. Temporal change in human nicotinic acetylcholine receptor after smoking cessation: 5IA SPECT study. J Nucl Med. 2007;48:1829–1835. doi: 10.2967/jnumed.107.043471. [DOI] [PubMed] [Google Scholar]
- 31.Brody AL, Mandelkern MA, London ED, et al. Cigarette smoking saturates brain α4β2 nicotinic acetylcholine receptors. Arch Gen Psychiatry. 2006;63:907–915. doi: 10.1001/archpsyc.63.8.907. [DOI] [PMC free article] [PubMed] [Google Scholar]
- 32.Pauly JR, Marks MJ, Gross SD, Collins AC. An autoradiographic analysis of cholinergic receptors in mouse brain after chronic nicotine treatment. J Pharmacol Exp Ther. 1991;258:1127–1136. [PubMed] [Google Scholar]
- 33.Fujita M, Tamagnan G, Zoghbi SS, et al. Measurement of α4β2 nicotinic acetylcholine receptors with [123I]5-I-A-85380 SPECT. J Nucl Med. 2000;41:1552–1560. [PubMed] [Google Scholar]
- 34.Marks MJ, Stitzel JA, Collins AC. Time course study of the effects of chronic nicotine infusion on drug response and brain receptors. J Pharmacol Exp Ther. 1985;235:619–628. [PubMed] [Google Scholar]
- 35.Benowitz NL, Jacob P., III Nicotine and cotinine elimination pharmacokinetics in smokers and nonsmokers. Clin Pharmacol Ther. 1993;53:316–323. doi: 10.1038/clpt.1993.27. [DOI] [PubMed] [Google Scholar]
- 36.Benowitz NL, Kuyt F, Jacob P., III Circadian blood nicotine concentrations during cigarette smoking. Clin Pharmacol Ther. 1982;32:758–764. doi: 10.1038/clpt.1982.233. [DOI] [PubMed] [Google Scholar]
- 37.Wonnacott S. The paradox of nicotinic acetylcholine receptor upregulation by nicotine. Trends Pharmacol Sci. 1990;11:216–219. doi: 10.1016/0165-6147(90)90242-z. [DOI] [PubMed] [Google Scholar]
- 38.Peng X, Gerzanich V, Anand R, Whiting PJ, Lindstrom J. Nicotine-induced increase in neuronal nicotinic receptors results from a decrease in the rate of receptor turnover. Mol Pharmacol. 1994;46:523–530. [PubMed] [Google Scholar]
- 39.Gopalakrishnan M, Molinari EJ, Sullivan JP. Regulation of human α4β2 neuronal nicotinic acetylcholine receptors by cholinergic channel ligands and second messenger pathways. Mol Pharmacol. 1997;52:524–534. [PubMed] [Google Scholar]
- 40.Nashmi R, Dickinson ME, McKinney S, et al. Assembly of α4β2 nicotinic acetylcholine receptors assessed with functional fluorescently labeled subunits: effects of localization, trafficking, and nicotine-induced upregulation in clonal mammalian cells and in cultured midbrain neurons. J Neurosci. 2003;23:11554–11567. doi: 10.1523/JNEUROSCI.23-37-11554.2003. [DOI] [PMC free article] [PubMed] [Google Scholar]