

Abstract
To provide insight of their inhibition mechanism and facilitate the design of more potent ligands, a series of 59 isatin sulfonamide analogues were docked to the X-ray structure of caspase-3, one of the important cysteine aspartyl-specific execution proteases in apoptosis, and their binding conformations were analyzed by 3D-QSAR studies. Comparative Molecular Field Analysis (CoMFA) and Comparative Molecular Similarity Index Analysis (CoMSIA) studies suggest that both steric and electrostatic interactions contribute to the compounds’ binding affinity, with the major contribution arising from hydrophobic interactions. The models show excellent correlation and high predictive power even evaluated by the most stringent criteria for a QSAR model. The results of this work demonstrate that structure-based design methods (such as docking) cultivate the development of reliable QSAR models, they also illustrate the utility of this procedure in design of new potent caspase-3 ligands.
INTRODUCTION
Since their discovery more than a decade ago, caspases, the proteases mediating the signaling pathway in programmed cell death (apoptosis),1 have been studied as an important therapeutic target. Their roles in the abnormal regulation of apoptosis are implicated in a wide variety of human diseases, spanning from ischemia-reperfusion injury, cardiomyopathy, neuro-degenerative diseases to autoimmune disorders and cancers.2 Insights into their effective mediation by small molecules would therefore provide clues for the treatment of these pathologies.3, 4 Considerable efforts have been made in designing novel caspase ligands as non-invasive imaging agents to study the process of apoptosis in these pathological states, as well as to monitor the abilities of new drugs to regulate the process.5
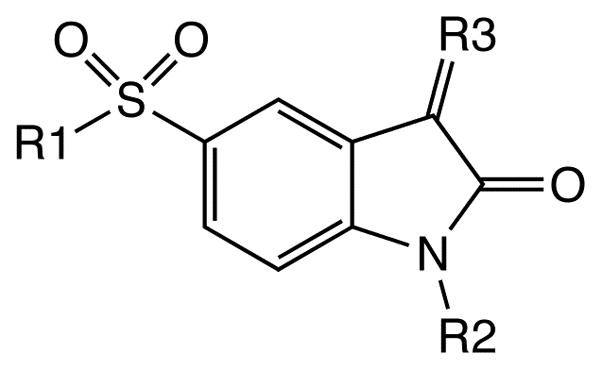
As one prototypical member in the class of executioner caspases, caspase-3 has been found to be activated in multiple signaling pathways of several different models of apoptosis.6 It has been proven to be an effective target for reducing the amount of cellular and tissue damage in cell culture and animal models by specific inhibitors.7, 8 Recently several studies reported isatin sulfonamide analogues (Figure 1) as potent and selective, nonpeptide small molecule caspase-3 inhibitors9–11 and showed their promise as therapeutic drugs and radiotracers in the in vivo imaging of apoptosis.12–14 Although an X-ray structure has been reported for caspase-3 in complex with an early isatin sulfonamide lead compound (compound 1 in Figure 1 and Table 1) at the active site,12 how the optimization of different functional groups at regions I to IV (Figure 1) defines improved binding affinity remains speculative. It has been reported that the active site of caspase-3 is conformationally flexible and multiple side chain conformations have been observed in the X-ray structures.15, 16 A detailed quantitative analysis of the structure-activity relationship on these compounds would provide insight into the mode of action for their inhibition of caspase-3 and facilitate further optimization of the ligands and in combinatorial library design.
Figure 1.

Structure of the previously reported isatin sulfonamide analogues as caspase-3 inhibitors.
Table 1.
Experimental binding affinities (IC50) of the isatin sulfonamide analogues to caspase-3 used in this study. All values represent the average (± standard error) of multiple determinations as reported in literature.10, 11
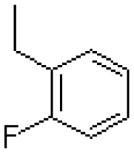
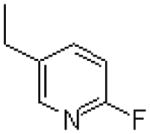
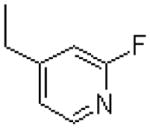
| Ligand | R1 | R2 | R3 | IC50 (nM) |
|---|---|---|---|---|
 | ||||
| Region I: Pyrrolidine analogues | ||||
| 1 |  |
—CH3 | =O | 119.2 ± 17.0 |
| 2 | 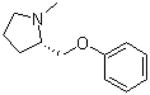 |
—H | =O | 240.0 ± 10.0 |
| 3 | 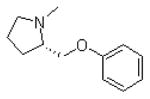 |
 |
=O | 12.2 ± 0.3 |
| 4 |  |
 |
=O | 14.5 ± 1.6 |
| 5 |  |
 |
=O | 12.1 ± 2.1 |
| 6 |  |
 |
=O | 12.4 ± 2.1 |
| 7 |  |
 |
=O | 12.0 ± 1.5 |
| 8 |  |
 |
=O | 13.5 ± 2.4 |
| 9 |  |
 |
=O | 9.85 ± 0.9 |
| 10 |  |
 |
=O | 10.3 ± 1.5 |
| 11 |  |
 |
=O | 21.3 ± 3.2 |
| 12 |  |
 |
=O | 9.1 ± 1.8 |
| 13 |  |
 |
=O | 9.7 ± 1.3 |
| 14 |  |
—H | =O | 58.3 ± 7.6 |
| 15 |  |
—CH3 | =O | 23.3 ± 3.1 |
| 16 |  |
 |
=O | 5.2 ± 1.6 |
| 17 | 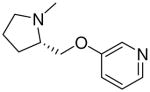 |
 |
=O | 3.9 ± 0.9 |
| 18 |  |
 |
=O | 4.4 ± 1.4 |
| 19 |  |
 |
=O | 8.4 ± 2.0 |
| 20 |  |
 |
=O | 3.9 ± 0.6 |
| 21 |  |
 |
=O | 3.6 ± 0.5 |
| 22 |  |
—H | =O | 20.4 ± 1.7 |
| 23 |  |
—H |  |
272 ± 24.7 |
| 24 |  |
—CH3 |  |
119.3 ± 4.0 |
| 25 |  |
 |
 |
27.8 ± 2.5 |
| 26 |  |
 |
 |
31.8 ± 6.2 |
| 27 |  |
 |
 |
20.1 ± 1.3 |
| 28 |  |
 |
 |
7.6 ± 1.1 |
| 29 |  |
 |
 |
7.8 ± 1.9 |
| 30 |  |
 |
 |
5.1 ± 0.7 |
| 31 |  |
 |
 |
7.8 ± 1.5 |
| Region I: Azetidine analogues | ||||
| 32 | 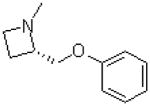 |
—H | =O | 286.7 ± 24.7 |
| 33 |  |
—CH3 | =O | 91.7 ± 7.6 |
| 34 |  |
 |
=O | 9.7 ± 1.6 |
| 35 |  |
 |
=O | 8.4 ± 1.2 |
| 36 |  |
 |
=O | 11.3 ± 1.2 |
| 37 |  |
 |
=O | 8.8 ± 1.4 |
| 38 | 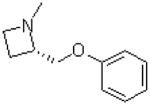 |
 |
=O | 9.4 ± 0.3 |
| 39 |  |
 |
=O | 10.9 ± 1.4 |
| 40 |  |
 |
=O | 29.2 ± 5.2 |
| 41 |  |
 |
=O | 5.8 ± 1.0 |
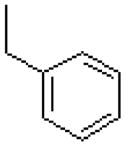
| Region I: Miscellaneous rings | ||||
| 42 |  |
 |
=O | 1430 ± 40 |
| 43 |  |
 |
=O | 1028 ± 259 |
| 44 |  |
 |
 |
583 ± 68 |
| 45 |  |
 |
 |
1405 ± 219 |
| 46 |  |
 |
 |
529 ± 69.3 |
| 47 |  |
 |
 |
4700 ± 700 |
| 48 |  |
 |
 |
4633 ± 1000 |
| 49 |  |
 |
 |
1550 ± 70.0 |
| 50 |  |
 |
 |
1454 ± 170 |
| 51 |  |
 |
 |
1672 ± 348 |
| 52 |  |
 |
 |
1993 ± 86 |
| 53 |  |
 |
=O | 114.2 ± 30.4 |
| 54 |  |
 |
 |
323 ± 15.6 |
| 55 |  |
 |
 |
718 ± 216 |
| 56 |  |
 |
 |
365 ± 48.8 |
| 57 |  |
 |
 |
671 ± 107 |
| 58 |  |
 |
 |
673 ± 31.8 |
| 59 |  |
 |
 |
724 ± 151 |
Among the many QSAR modeling methods, CoMFA17 and CoMSIA18 analyses are two popularly used ones. Their results are straightforwardly interpreted by visualizing the molecular fields generated by the ligands to affect their activities to the receptor. They have been successfully applied in the design of many new bioactive molecules.19 However, accurate conformation selection and molecular alignment remains the determining factor affecting the successful development of a CoMFA or CoMSIA model. The molecules in the training set (and test set) are expected to be aligned against each other to maximize the overlap of the pharmacophores for accurate generation of molecular fields.19 Of the different strategies to improve the alignment, molecular docking is an intuitively appealing solution when the three dimensional (3D) structure of the target protein is available. The prediction of binding conformation and pose by docking simulations for a compound library to the same target protein would quite likely produce well-aligned models for the ligands, while revealing the essential features responsible for their activities. It has been found that docking results are accurate enough for appropriately aligning the ligands and developing reliable QSAR models.20, 21 Since there is ample structural information available in the protein data bank (PDB)22 for the caspases, a combination of receptor docking and 3D-QSAR approaches would be desired for the investigation of the ligand libraries as caspase inhibitors, however only limited studies had been reported on this subject.23
The caspase fold has been well characterized15, as evident from the over 50 X-ray structures of the caspase catalytic domains for several inflammatory, initiator and executioner caspases deposited in the PDB. The major characteristic of the caspase fold seen in all of them comprises a large (17–20kDa) p17 subunit (A chain) and a small (10–12kDa) p12 subunit (B chain). The A chain and B chain tightly pack into a compact ellipsoid to form a single catalytic domain, with the active site at their interface. The catalytic domain (A and B chain heterodimer) is composed of a twisted, mostly parallel β-sheet sandwiched between two layers of α-helices. Active caspases have been referred to as “homodimers of heterodimers”15. Two identical domains fit together by alignment of the C-terminal strands in an antiparallel manner, thus generating a continuous, 12-stranded β-sheet (Figure 2). Therefore there are two identical catalytic sites in the active caspase structure. The active site for the proteolytic activity of the enzyme is at the interface of the heterodimer (A/B chain), far away from the interface of the homodimer (domain/domain), and is partially solvent exposed. The interaction between the enzyme and a ligand (substrate/inhibitor) would thus only involve a single domain (A/B chain) of the protein with the ligand, as confirmed by our survey of the 38 crystal structures of caspase-3 in complex with inhibitors deposited in the PDB to date. This is also the reason that in many crystallographic and/or molecular modeling studies focusing on the caspase-ligand interactions, only the structure of one heterodimer had been used by removing the other duplicate domain. In this work, we will adopt the same procedure.
Figure 2.

The X-ray structure of human caspase-3 exemplifies the fundamental caspase fold (pdb code: 1NMS) shown in cartoon representation and colored by chain. The bound inhibitor is shown in stick model.
Herein we report the results of molecular docking of a series of 59 isatin sulfonamide analogues, whose binding affinities (IC50) had been determined earlier or recently in our laboratory,10, 11, 24 to the X-ray structures of caspase-3 by utilizing the docking program Gold,25, 26 incorporated with enhanced conformation sampling of flexible ring in the ligands. The Gold-predicted best binding modes were utilized as the alignment of the ligands and analyzed by 3D-QSAR studies. A previous molecular modeling study had been reported for some of the compounds, and focused on the explanation of the molecular interactions between the ligands and the protein.10 We extended this later work by exploring the quantitative structure-activity relationships of this class of compounds and provide further insights into the design of non-substrate-based inhibitors of caspase-3.
MATERIALS AND METHODS
Preparation of the protein and ligand structures
The X-ray structure of caspase-3 bound with an isatin sulfonamide inhibitor (compound 1 in Table 1) (pdb code: 1GFW) was obtained from the Research Collaboratory for Structure Bioinformatics Protein Data Bank (RCSB-PDB).22 The structure was read in and manipulated with the Program Sybyl 7.2 (Tripos International, St Louis, MO, USA). In the X-ray structure, caspase-3 adopts a tetrameric conformation with two large (A chains) and two small subunits (B chains). One A chain and one B chain form the catalytic domain with the active site at their interface. Therefore, there are two identical catalytic sites in the active caspase-3 structure. Duplicate chains, empty residues, solvent molecules, counter-ions and the bound inhibitor were subsequently removed, leaving a single domain of A and B chains. Hydrogen atoms were added, and the structures were minimized using the Amber99 force field with heavy atoms fixed in position, to a gradient of 0.01 kcal/(mol●Å).
The inhibitors in this study include a series of isatin sulfonamide analogues synthesized and investigated earlier in our laboratory.10, 11, 14 In addition, we also include a new series of analogues which were synthesized and evaluated recently as potent caspase-6 inhibitors.24 They show lower in vitro potencies to caspase-3 because the 2-phenoxymethyl substitute group in region II (Figure 1) is completely missing. They were included in the study to form a compound library with binding affinities ranging from micro to nanomolar, which ensures the building of a reliable QSAR model. The structures for all the compounds and their experimental IC50 values are listed in Table 1. Two ligands, 3 as a representative for the pyrrolidine series and 34 for the azetidine series, were chosen as model systems for the potent compounds and their structures were drawn in ChemBioDraw Ultra 11.0 (Cambridgesoft, Cambridge, MA, USA). They were then exported to Omega 2.2.1 (OpenEye Scientific Software, Santa Fe, NM, USA) and subjected to conformer generation. The maximum number of conformers was set to 400, and the energy window was set to 5.0 kcal/mol. The threshold for duplicate removal was set to 1.0 Å Root Mean Square Deviation (RMSD). Default settings were used for the remaining parameters. Since Gold is capable of handling ligand flexibility, the purpose of this step is to generate a conformer library for each ligand which consists of alternative conformations for the cyclic systems (pyrrolidine or azetidine) instead of exhaustive conformational sampling for every rotatable bond.
As a preliminary screen of the resulting ligand conformer libraries, Fred 2.2.3 (OpenEye Scientific Software, Santa Fe, NM, USA) was used to dock each conformer library to the enzyme. Since the ligands were expected to form covalent binding to the thiol group of Cys163,11, 12 a constraint was specified between the carbon atom on position 3 (C3) of the isatin moiety to the sulfur atom of Cys163 thiol. Fred is able to return a subset of the conformers with ranked scores within a short period of time (seconds to minutes), so the goal of this step was to filter out the prospective conformations for the pyrrolidine or azetidine group instead of predicting the binding modes. The docking results were inspected for each ligand conformer focusing on the pyrrolidine or azetidine ring, the best ranked conformer for each distinct ring conformation was then selected and prepared for the following modification for covalent docking into the protein.
The structures were exported back to Sybyl and modified to enable a covalent bond between the ligands and the protein. It has been observed that the covalent bond is formed between the sulfur atom of the Cys163 thiol group of the enzyme and C3 of the isatin moiety of the ligands, by nucleophilic attack of the thiol nucleophile, for both the carbonyl isatin analogues (ligand 1–22, 32–43 and 53 in Table 1) and the isatin Michael acceptors (IMAs, ligand 23–31, 44–52, and 54–59 in Table 1).11, 12 The nucleophilic addition product was generated by adding a sulfur atom to C3 on the isatin moieties, forming a tetrahedral carbon with sulfur and oxyanion substituent for ligand 3 and 34. As this generates a chiral center, both enantiomers were prepared and used in docking studies. The sulfur serves as the link between the inhibitor and Cys163 of the protein. This concluded the building of a conformer (enantiomer) library for the model ligand 3 and 34. Eventually the conformers for the remaining 57 ligands were prepared by modifying the groups R1-R3 on the corresponding conformers of 3 or 34 in Sybyl.
Docking
The ligands were then docked into the enzyme using covalent constraint as implemented in Gold 3.0.1 (The Cambridge Crystallographic Data Center, Cambridge, UK). Gold utilizes an evolutionary genetic algorithm to optimize the docked pose of the inhibitor within the enzyme, with the consideration of ligand flexibility.26 Each conformer of the inhibitors was docked into the binding site, through a covalent attachment between the C3 atom of the isatin moiety and the sulfur atom of the Cys163 thiol group of the enzyme. Each molecule was docked 10 times with early termination if the top three poses are within 1.5 Å RMSD. Each pose was ranked according to its GoldScore fitness function, which consists of four components: protein-ligand hydrogen bond energy, protein-ligand van der Waals (vdw) energy, ligand internal vdw energy, and ligand torsional strain energy. For each ligand, the fitness values from all runs (every conformer for each enantiomer) were compared and the highest scoring pose was chosen as the binding conformation and used for further analysis.
3D-QSAR Analyses
The dataset which consists of the Gold-predicted bound conformations of the 59 ligands was then divided into a training set of 44 ligands and a test set of 15 ligands for 3D-QSAR study. The 15 ligands forming the test set were 2, 5, 8, 18, 22, 24, 26, 30, 33, 40, 45, 48, 52, 53 and 58 in Table 1. They were selected in such a way that their IC50 values are randomly but uniformly distributed in the range of the values for the whole set so that the model’s predictive power could be effectively evaluated. The remaining 44 ligands formed the training set. All the ligands were aligned in 3D space by using the binding conformations from the docking results, without any additional adjustment. The Gasteiger-Huckel partial charges were calculated for each ligand and used in the analyses. CoMFA and three CoMSIA models were developed for the training set within the QSAR module of Sybyl using the default settings. The QSAR equations were calculated using the partial least-squares (PLS) algorithm. The cross-validated correlation coefficient R2 (q2) were obtained by the leave-one-out (LOO) cross-validation technique. No column filtering was applied in any of the analyses. The predictive correlation coefficient (r2test) was determined by the predicted pIC50 versus the experimental observed values in the test set.
In order to thoroughly evaluate the models’ quality, a set of more rigorous criteria was used as suggested by Tropsha et. al.27–29 For a predictive model tested in the test set, beside the r2test, coefficient of determination30 and slope of regression lines when forcing the intercept through origin are also needed to assess how far the predicted values deviate from the observed activities in the absolute scale. For a set of data xi, yi), the coefficient of determination is calculated as the correlation coefficient R2 for a linear regression with the Y-intercept set to 0.0 (i.e., described by Y = KX), which is different from the conventional R2 for Y = KX +b. This is because when we compare actual vs. predicted activities, an exact fit is required instead of just a linear correlation. An intercept would imply additional adjustment for the prediction, thus higher inaccuracy.
Coefficients of determination were calculated as for predicted versus observed activities, and for observed versus predicted activities. Slopes of regression lines when forcing the intercept through origin were also calculated as K for predicted versus observed activities, and K′ for observed versus predicted activities. These statistical parameters were then compared with the recommended values to assess the QSAR models.28, 29
RESULTS AND DISCUSSION
Docking Studies
In the protein-ligand docking studies, conformational flexibility has always been one of the toughest challenges to address31 because of inadequate sampling. In comparisons of the X-ray structures of apo enzyme and enzyme-inhibitor complex for caspase-3, previous studies had found that critical side chain movements take place in the active site.16, 32 Specifically, the side chain of Tyr204 is rotated by ~90° around the χ1 angle upon binding, allocating a hydrophobic pocket S2 to accommodate the inhibitor. To address the conformational flexibility at the active site of the protein, the structure of the inhibitor-bound enzyme (pdb code: 1GFW) was utilized in our docking calculations to construct a reliable binding mode. In Gold, the ligand flexibility is treated on-the-fly during the docking process using a genetic algorithm.25, 26 A limited conformational search of cyclic systems could be enabled in Gold, by allowing free corners of rings to flip above or below the plane of their neighboring atoms, if the “flip ring corners” option is turned on. However, since a covalent constraint was applied in our studies, the flexible ring embedded in the ligands could be trapped in their starting conformations even when this option was turned on, especially for the ligands with a bulky substitute group (phenoxylmethyl moiety) on the 2 position of the pyrrolidine or azetidine group to hinder the ring flip. Therefore, distinct starting conformations were generated in Omega for the cyclic systems for ligand 3 and 34 and used in separate docking runs to enhance sampling. The conformer library generated by Omega contains 48 conformers for ligand 3 and 75 conformers for ligand 34, respectively.
After initial screening by Fred, two conformers were each identified for compound 3 (pyrrolidine) and 34 (azetidine), respectively. The two conformers mainly differ in that the free carbon atom corner near the chiral carbon atom is either above or below the ring plane, for both prrolidine and azetidine. After generation of enantiomers resulted from nucleophilic attack by Cys163 thiol, four structures were obtained for each ligand and used in the subsequent docking studies.
Out of all the docking runs for each ligand, the highest scoring pose was chosen as the binding pose. The superimposition of the binding conformations for all the 59 ligands is depicted in Figure 3. In analysis of all the docking results, the fitness scores from Gold collectively indicate that one conformer (of one enantiomer) for the pyrrolidine (and azetidine) is unambiguously favored over other conformations among the different starting conformations for each ligand. i.e., the one with free atom corner below the ring plane. The program Gold was set to allow early termination if the top three solutions are within 1.5 Å RMSD of each other for each docking run. In the docking runs of the favored ring conformer as the starting conformation, early termination was achieved for most ligands, with the top three ranked poses differing only in internal rotational freedom, basically for the phenoxylmethyl side chain exposed to solvent. For the azetidine series of compounds, by turning on the “flip ring corner” option, the other conformer had been successfully converged to the bound conformation, i.e. both conformers returned the same docking results. However, for the pyrrolidine series of compounds, even after the “flip ring corner” option had been turned on, the other conformer was trapped in the starting conformation, returning a completely different binding pose with a substantially lower fitness score. This demonstrates that, despite some docking programs’ capabilities to handle ligand flexibility automatically, for some difficult docking cases, conformational flexibility is still in need of explicit treatment, such as the cyclic systems in the present series of compounds.
Figure 3.

Superimposition of the binding conformations for the 59 ligands obtained by the current docking study. Atom color scheme: C, green; O, red; N, blue; S, orange; Cl, yellow; F, grey; and Br, maroon. Hydrogen atoms are un-displayed.
A superimposition of all the top poses for the 59 ligands is quite consistent, thanks to the covalent bonding between C-3 atom of the isatin moieties and the Cys163 thiol group, and the anchoring role of the flexible ring system. In fact, the flexible ring makes extensive hydrophobic contacts with the side chains of Phe256, Tyr204 and Trp206 at the S2 binding pocket of the enzyme, attributed to the rotation of the side chain of Tyr204. The importance of this hydrophobic pocket for conferring binding specificity to the isatin sulfonamides has been observed earlier in the X-ray structure of caspase-3 in complex with ligand 112 and confirmed by the present docking results. The Gold predicted binding pose of 1 overlays very well with its coordinates in the X-ray structure (Figure 4); giving a mass-weighted RMSD of 1.98 Å, demonstrating that the binding mode is correctly reproduced by Gold. The main discrepancy of the two poses comes from the phenoxylmethyl side chain, which shows weak electron density in the X-ray structure with high b-factors, an indication of its mobility at the binding site.12 If the phenyl group is excluded, the mass-weighted RMSD for the two modes would be only 1.00 Å.
Figure 4.

Superimposition of the binding pose for ligand 1 obtained by the docking study on the X-ray structure (1GFW) at the active site. Atom color scheme: C, green (docking result) or yellow (X-ray); O, red; N, blue; S, orange. Hydrogen atoms are un-displayed.
Aside from the hydrophobic interactions of the cyclic group at S2, the essentials of the binding modes also include the tetrahedral intermediate formed between the catalytic cysteine thiolate and the isatin ketone carbonyl or Michael addition acceptor group in region IV; the van der Waals interactions formed between the aromatic rings in region III and the side chains of Met61, Phe128 His121, and Glu123; and the electrostatic interactions formed between the sulfonamide and Arg207 backbone amide or its guanidino group (Figure 5). A major distinction also exists among the binding modes for the 59 different compounds. For the pyrrolidine series of compounds, the mobile phenoxylmethyl group with various replacements or substitutions on the phenyl ring tends to extend toward outside of the binding cleft to the solvent; while for the azetidine series, the aromatic ring in region II prefers to stack with the side chain of Phe256, forming a π-π interaction. This suggests that for this series of isatin sulfonamide analogues, although the rings in region I are anchored at the same site (S2) by hydrophobic interactions, the groups in region II could have interactions with completely different groups on the enzyme, because of the different size of their anchoring group (four versus five member ring). For the series of ligands with miscellaneous ring groups in region I lacking the phenoxylmethyl moiety, the conformations of the heteroatom rings are more varied: the most electron dense, thiomorpholine ring tends to stay out of the hydrophobic S2 pocket; while the piperidine ring is not accommodated well at the S2 pocket because of its bulkier size. The lack of any substitution on the rings explains their overall lower potencies to caspase-3.
Figure 5.

Binding interactions of the two categories of compounds with caspase-3, obtained by the docking study. a): Ligand 3 as the representative of compounds with pyrrolidine ring in region I; b): Ligand 34 as the representative of compounds with azetidine ring in region I. Binding interactions were calculated with the Program LigPlot.34
The present docking studies suggest that a reliable alignment of the ligands has been achieved to maximize the superposition of their pharmacophoric elements responsible for producing the binding affinities, a crucial step for the subsequent 3D-QSAR analyses.
3D-QSAR Models
The CoMFA and CoMSIA models were derived from the 44 ligands in the training set, based on the ligand alignment produced from docking results. To explore the effect of various fields on the predictability of the models, three separate CoMSIA models were built using different combinations of steric, electrostatic, hydrophobic, and hydrogen bond (donor and acceptor) fields. The PLS analysis results are summarized in Table 2. All the statistical indices are reasonably high, indicating they all have good predictability. All four models show comparably good correlations, with CoMSIA model 1 having the best statistical metrics (lowest SEE and highest F for the same principle component number). The overwhelmingly high statistical values indicate that the alignment obtained by docking studies accurately reflects the natural binding conformations of the ligands, and it lays the foundation of a reliable QSAR model.
Table 2.
Results from the CoMFA and several CoMSIA models for the training set.
| % Contribution |
|||||||||
|---|---|---|---|---|---|---|---|---|---|
| Model | r2 | q2 | SEE | F | PC | Steric | Electrostatic | Hydrophobic | H-bond(D/A) |
| CoMFA | 0.971 | 0.925 | 0.168 | 331.3 | 4 | 86.5 | 13.5 | - | - |
| CoMSIA1 | 0.979 | 0.945 | 0.146 | 352.7 | 5 | 67.2 | 32.8 | - | - |
| CoMSIA2 | 0.968 | 0.910 | 0.176 | 299.4 | 4 | 37.6 | 16.6 | 45.8 | - |
| CoMSIA3 | 0.967 | 0.898 | 0.183 | 222.7 | 5 | 21.1 | 9.4 | 28.6 | 12.0/28.9 |
r2: non-cross-validated correlation coefficient; q2: cross-validated correlation coefficient; SEE: standard error of estimation; PC: principal component number; D: hydrogen bond donor; A: hydrogen bond acceptor
Validation is always a crucial step in QSAR modeling. It has been found that the widely accepted LOO cross-validated q2 is inadequate to assess the predictive ability of the QSAR models,27 since some models based on the training set with randomized affinities appeared to have high q2 values, but showed low predictive power in an external test set. This could be explained by a chance correlation or structural redundancy.33 Therefore we set out to validate the models by predicting the binding affinities of the compounds in the test set using the above four models. The results are reported in Table 3. Table 4 lists the statistical parameters for the different models. Indeed, the model with the highest LOO q2 in the training set does not necessarily return the highest r2test in the test set, as has been shown before by Tropsha et. al.27–29 A set of rigorous criteria have been suggested for the evaluation of a QSAR model, including calculating the coefficients of determination30 ( and ) and slopes of regression (K and K′) when forcing the intercept to pass through the origin. A QSAR model has been concluded to have an acceptable predictive power if the following conditions are satisfied:27–29 (i) q2 > 0.5; (ii) ; (iii) and 0.85 ≤ K ≤ 1.15 or and 0.85 ≤ K′ ≤ 1.15, (iv) . Therefore, the predictive values in the test set in Table 3 were also used to calculate , K and K′ as reported in Table 4. It is clear that all the above conditions are well satisfied by any of the four models in our studies. These models show superior performance in predicting the pIC50 values in the test set, with one of them (CoMSIA1) having the strongest correlation between the predicted versus measured values. This model used a combination of steric and electrostatic fields to describe the binding affinities and achieved excellent correlations in both the training and the test set (Figure 6). The other models CoMSIA2 and CoMISA3 added hydrophobic field and hydrogen bonding donor and acceptor into the field analysis and also obtained very strong correlation in the test set (Figure 6). To further validate the models, different selections of molecules making up the test and training sets or different test set and training set size were also evaluated. Very similar QSAR models with about the same predictive power were produced (results not shown), indicating the models are robust and the results are informative for interpreting molecular interactions.
Table 3.
Predicted affinities of the test set utilizing the CoMFA and three CoMSIA models.
| Ligand | Exp.a pIC50 | CoMFA | CoMSIA1 | CoMSIA2 | CoMSIA3 | ||||
|---|---|---|---|---|---|---|---|---|---|
| Pred.b | Resi.c | Pred. | Resi. | Pred. | Resi. | Pred. | Resi. | ||
| 2 | 6.620 | 6.680 | 0.060 | 6.701 | 0.081 | 6.762 | 0.142 | 6.440 | −0.180 |
| 5 | 7.917 | 7.831 | −0.086 | 7.961 | 0.044 | 7.813 | −0.104 | 7.820 | −0.097 |
| 8 | 7.870 | 7.870 | 0.000 | 8.003 | 0.133 | 7.806 | −0.064 | 7.486 | −0.384 |
| 18 | 8.357 | 8.389 | 0.032 | 8.362 | 0.005 | 8.401 | 0.044 | 8.317 | −0.040 |
| 22 | 7.690 | 6.805 | −0.885 | 7.062 | −0.628 | 6.890 | −0.800 | 6.723 | −0.967 |
| 24 | 6.923 | 6.882 | −0.041 | 6.742 | −0.181 | 7.014 | 0.091 | 7.247 | 0.324 |
| 26 | 7.498 | 7.551 | 0.053 | 7.636 | 0.138 | 7.632 | 0.134 | 7.378 | −0.120 |
| 30 | 8.292 | 8.173 | −0.119 | 8.206 | −0.086 | 8.265 | −0.027 | 8.342 | 0.050 |
| 33 | 7.038 | 7.155 | 0.117 | 6.949 | −0.089 | 7.135 | 0.097 | 7.361 | 0.323 |
| 40 | 7.535 | 7.920 | 0.385 | 7.906 | 0.371 | 7.848 | 0.313 | 7.776 | 0.241 |
| 45 | 5.852 | 5.947 | 0.095 | 5.748 | −0.104 | 6.123 | 0.271 | 6.069 | 0.217 |
| 48 | 5.334 | 5.814 | 0.480 | 5.665 | 0.331 | 5.658 | 0.324 | 5.530 | 0.196 |
| 52 | 5.700 | 5.948 | 0.248 | 5.936 | 0.236 | 6.095 | 0.395 | 6.233 | 0.533 |
| 53 | 6.942 | 6.568 | −0.374 | 6.538 | −0.404 | 6.395 | −0.547 | 6.916 | −0.026 |
| 58 | 6.172 | 6.162 | −0.010 | 6.145 | −0.027 | 6.175 | 0.003 | 6.190 | 0.018 |
Exp. refers to experimentally measured IC50.
Pred. refers to predicted IC50.
Resi. refers to the corresponding difference between the predicted and measured IC50.
Table 4.
Statistical results from the CoMFA and three CoMSIA models.
| Model | r2 | q2 | r2test | K | K′ | ||||
|---|---|---|---|---|---|---|---|---|---|
| CoMFA | 0.971 | 0.925 | 0.889 | 0.866 | 0.997 | 0.889 | 1.001 | ||
| CoMSIA1 | 0.979 | 0.945 | 0.924 | 0.920 | 0.997 | 0.924 | 1.002 | ||
| CoMSIA2 | 0.968 | 0.910 | 0.888 | 0.862 | 1.000 | 0.887 | 0.998 | ||
| CoMSIA3 | 0.967 | 0.898 | 0.862 | 0.822 | 0.998 | 0.860 | 1.000 |
Figure 6.


QSAR modeling of the isatin analogs. a): Experimentally measured pIC50 versus the fitted values for the training-set compounds (○) and the predicted values for the test-set compounds (■) from the CoMSIA model 1, 2 and 3; b):Observed vs. predicted and predicted vs. observed pIC50 by the CoMSIA model 1, 2 and 3, using the test set. Two regression results, with (solid line) or without (dashed line) forcing the intercept to be zero are shown for each dataset.
Figure 7 shows illustrations of the molecular fields from the model which contains all the contributing factors (CoMSIA3). The steric map shows that for both region II and III, bulky groups would be disfavored and unlikely to increase the compounds’ activities. However in region III the ligands would favor some substitutions on the aromatic ring sterically, since they would create desirable close contact with the enzyme as shown in Figure 4 and 5. Substitution by small hydrophobic groups would also be desired in region II and III as suggested by the hydrophobic map. From the hydrogen bond donor fields map d), a donor on the ligand in region III is predicted to favor binding, which may be attributed to the presence of a glutamic acid residue (Glu123) near the binding site. From the acceptor fields map e), in the area near region II of the pyrrolidine series of compounds, a hydrogen bond acceptor on the ligand is predicted to favor binding. So the replacement of the phenyl ring by a pyridine ring increases the compounds’ activities. For region II it is also preferred to have some hydrophilic substitutions, or positive charge on the ring, since they are exposed to solvent. The CoMSIA results suggest that both steric and electrostatic interactions contribute to the compounds’ binding affinity, with the major contribution coming from hydrophobicity as well as hydrogen bonding of these series of ligands.
Figure 7.

Molecular field maps derived from the model (CoMSIA3), with ligand 3 and 34 illustrated. Contours of the steric map are shown in a); electrostatic map in b); hydrophobic map in c); hydrogen bond donor in d); and hydrogen bond acceptor in e). Atom color scheme: C, grey (3) or green (34); O, red; N, blue; S, yellow. Hydrogen atoms are un-displayed. The contours are displayed at 80% favored and 20% disfavored level. Increased binding affinity is correlated with: more bulk near green, less bulk near yellow in the steric map; more positive charge near blue, more negative charge near red in the electrostatic map; more hydrophobic near orange, less hydrophobic near violet in the hydrophobic map; more hydrogen bond donor near cyan, less hydrogen bond donor near purple in the hydrogen bond donor map; more hydrogen bond acceptor near magenta, and less hydrogen bond acceptor near red in the hydrogen bond acceptor map.
Caspase-3 has a stringent substrate specificity to have an aspartic residue (Asp) at the S1 site and to a lesser degree at S4, thus most peptide-based inhibitors show poor cell permeability in spite of their high potency in vitro.32 Much of the effort to develop therapeutic agents or radiotracers has been to remove undesirable formal charges on the inhibitors. For this series of compounds, the QSAR results in the current study show that hydrophobic interactions are the dominant contributors in binding to caspase-3, which explains why they possess potent caspase inhibitory activity despite the lack of significant interactions with the S1 subsite of the enzyme. The binding poses obtained in the docking study suggest that their potencies come from the anchoring role of the pyrrolidine or azetidine at subsite S2, as a result of the plasticity of the enzyme conformation. The inhibition mechanism of the isatin sulfonamide analogues revealed in this work exemplifies the feasibility to design non-substrate based inhibitors by exploring alternative warheads and/or binding modes.
CONCLUSIONS
In this work, we have utilized the structure and ligand-based approaches of docking and 3D-QSAR to explore the intermolecular interactions of isatin sulfonamide analogues as caspase-3 inhibitors. The docking study not only confirmed that the essentials of the binding mode for these compounds are consistent with that observed in the X-ray -structure, but also provided the information on how lead optimization improved the activities. Most importantly, it helped to build reliable 3D-QSAR models by constructing the alignments of the ligands in the library to achieve the maximum pharmacophore overlap. The models’ high qualities measured by a set of rigorous criteria show their predictive power and help confirm the docking results. At present scoring functions used in conjunction with docking programs such as Gold can reliably predict favorable docking poses, but are still unreliable for predicting bioactivities of dissimilar ligands. The use of a 3D-QSAR approach complements the docking analysis by providing a “custom” scoring function for the particular protein studied capable of predicting bioactivities for ligands similar to those found in the training sets. In addition visualization of the molecular field maps can provide an intuitive understanding of the molecular interactions, unlike a simple summation of pairwise interactions obtainable from the analysis of a docked ligand where we have no information of the relative importance of a given interaction.
The current study reinforces the observation that information from the two paradigms in molecular modeling of structure-based design (such as docking) and ligand-based approaches (such as QSAR) are mutually strengthened and best exploited by coherent integration. It also sheds light on the inhibition mechanism of this series of compounds on caspase-3, revealing that the majority of their activities come from the compounds’ hydrophobic property and hydrogen bonding strengthens their specificity. This observation from the isatin sulfonamide analogues would be helpful in the design of new caspase-3 inhibitors.
Supplementary Material
Acknowledgments
This work was supported by grants HL13851 awarded by the National Heart, Lung and Blood Institute and CA121952 awarded by the National Cancer Institute.
Footnotes
Supporting Information Available. The structures of the molecules in their best poses from docking results and used in the QSAR study are available as a mol2 file. This material is available free of charge via the Internet at http://pubs.acs.org.
References
- 1.Jacobson MD, Weil M, Raff MC. Programmed cell death in animal development. Cell. 1997;88:347–54. doi: 10.1016/s0092-8674(00)81873-5. [DOI] [PubMed] [Google Scholar]
- 2.Thompson CB. Apoptosis in the pathogenesis and treatment of disease. Science. 1995;267:1456–62. doi: 10.1126/science.7878464. [DOI] [PubMed] [Google Scholar]
- 3.Reed JC. Apoptosis-based therapies. Nat Rev Drug Discov. 2002;1:111–21. doi: 10.1038/nrd726. [DOI] [PubMed] [Google Scholar]
- 4.Jana S, Paliwal J. Apoptosis: potential therapeutic targets for new drug discovery. Curr Med Chem. 2007;14:2369–79. doi: 10.2174/092986707781745569. [DOI] [PubMed] [Google Scholar]
- 5.Schoenberger J, Bauer J, Moosbauer J, Eilles C, Grimm D. Innovative strategies in in vivo apoptosis imaging. Curr Med Chem. 2008;15:187–94. doi: 10.2174/092986708783330647. [DOI] [PubMed] [Google Scholar]
- 6.Porter AG, Janicke RU. Emerging roles of caspase-3 in apoptosis. Cell Death Differ. 1999;6:99–104. doi: 10.1038/sj.cdd.4400476. [DOI] [PubMed] [Google Scholar]
- 7.Garcia-Calvo M, Peterson EP, Leiting B, Ruel R, Nicholson DW, Thornberry NA. Inhibition of human caspases by peptide-based and macromolecular inhibitors. J Biol Chem. 1998;273:32608–13. doi: 10.1074/jbc.273.49.32608. [DOI] [PubMed] [Google Scholar]
- 8.Hotchkiss RS, Chang KC, Swanson PE, Tinsley KW, Hui JJ, Klender P, Xanthoudakis S, Roy S, Black C, Grimm E, Aspiotis R, Han Y, Nicholson DW, Karl IE. Caspase inhibitors improve survival in sepsis: a critical role of the lymphocyte. Nat Immunol. 2000;1:496–501. doi: 10.1038/82741. [DOI] [PubMed] [Google Scholar]
- 9.Lee D, Long SA, Murray JH, Adams JL, Nuttall ME, Nadeau DP, Kikly K, Winkler JD, Sung CM, Ryan MD, Levy MA, Keller PM, DeWolf WE. Potent and selective nonpeptide inhibitors of caspases 3 and 7. J Med Chem. 2001;44:2015–26. doi: 10.1021/jm0100537. [DOI] [PubMed] [Google Scholar]
- 10.Chu W, Zhang J, Zeng C, Rothfuss J, Tu Z, Chu Y, Reichert DE, Welch MJ, Mach RH. N-benzylisatin sulfonamide analogues as potent caspase-3 inhibitors: synthesis, in vitro activity, and molecular modeling studies. J Med Chem. 2005;48:7637–47. doi: 10.1021/jm0506625. [DOI] [PubMed] [Google Scholar]
- 11.Chu W, Rothfuss J, d’Avignon A, Zeng C, Zhou D, Hotchkiss RS, Mach RH. Isatin sulfonamide analogs containing a Michael addition acceptor: a new class of caspase 3/7 inhibitors. J Med Chem. 2007;50:3751–5. doi: 10.1021/jm070506t. [DOI] [PubMed] [Google Scholar]
- 12.Lee D, Long SA, Adams JL, Chan G, Vaidya KS, Francis TA, Kikly K, Winkler JD, Sung C, Debouck C, Richardson S, Levy MA, DeWolf WE, Keller PM, Tomaszek T, Head MS, Ryan MD, Haltiwanger RC, Liang P, Janson CA, McDevitt PJ, Johanson K, Concha NO, Chan W, Abdel-Meguid SS, Badger AM, Lark MW, Nadeau DP, Suva LJ, Gowen M, Nuttall ME. Potent and Selective Nonpeptide Inhibitors of Caspases 3 and 7 Inhibit Apoptosis and Maintain Cell Functionality. J Biol Chem. 2000;275:16007–16014. doi: 10.1074/jbc.275.21.16007. [DOI] [PubMed] [Google Scholar]
- 13.Chapman JG, Magee WP, Stukenbrok HA, Beckius GE, Milici AJ, Tracey WR. A Novel nonpeptidic caspase-3/7 inhibitor, (S)-(+)-5-[1-(2-methoxymethylpyrrolidinyl) sulfonyl] isatin reduces myocardial ischemic injury. Eur J Pharmacol. 2002;456:59–68. doi: 10.1016/s0014-2999(02)02484-6. [DOI] [PubMed] [Google Scholar]
- 14.Zhou D, Chu W, Rothfuss J, Zeng C, Xu J, Jones L, Welch MJ, Mach RH. Synthesis, radiolabeling, and in vivo evaluation of an 18F-labeled isatin analog for imaging caspase-3 activation in apoptosis. Bioorg Med Chem Lett. 2006;16:5041–6. doi: 10.1016/j.bmcl.2006.07.045. [DOI] [PubMed] [Google Scholar]
- 15.Fuentes-Prior P, Salvesen GS. The protein structures that shape caspase activity, specificity, activation and inhibition. Biochem J. 2004;384:201–32. doi: 10.1042/BJ20041142. [DOI] [PMC free article] [PubMed] [Google Scholar]
- 16.Ni CZ, Li C, Wu JC, Spada AP, Ely KR. Conformational restrictions in the active site of unliganded human caspase-3. J Mol Recognit. 2003;16:121–4. doi: 10.1002/jmr.615. [DOI] [PubMed] [Google Scholar]
- 17.Cramer R, Patterson D, Bunce J. Comparative Molecular Field Analysis (CoMFA). 1. Effect of Shape on Binding of Steroids to Carrier Proteins. J Am Chem Soc. 1988;110:5959–5967. doi: 10.1021/ja00226a005. [DOI] [PubMed] [Google Scholar]
- 18.Klebe G, Abraham U, Mietzner T. Molecular similarity indices in a comparative analysis (CoMSIA) of drug molecules to correlate and predict their biological activity. J Med Chem. 1994;37:4130–46. doi: 10.1021/jm00050a010. [DOI] [PubMed] [Google Scholar]
- 19.Yang GF, Huang X. Development of quantitative structure-activity relationships and its application in rational drug design. Curr Pharm Des. 2006;12:4601–11. doi: 10.2174/138161206779010431. [DOI] [PubMed] [Google Scholar]
- 20.Lushington GH, Guo JX, Wang JL. Whither combine? New opportunities for receptor-based QSAR. Curr Med Chem. 2007;14:1863–77. doi: 10.2174/092986707781058814. [DOI] [PubMed] [Google Scholar]
- 21.Dean PM, Lloyd DG, Todorov NP. De novo drug design: integration of structure-based and ligand-based methods. Curr Opin Drug Discov Devel. 2004;7:347–53. [PubMed] [Google Scholar]
- 22.Berman HM, Westbrook J, Feng Z, Gilliland G, Bhat TN, Weissig H, Shindyalov IN, Bourne PE. The Protein Data Bank. Nucleic Acids Res. 2000;28:235–42. doi: 10.1093/nar/28.1.235. [DOI] [PMC free article] [PubMed] [Google Scholar]
- 23.Kulkarni SS, Kulkarni VM. Three-dimensional quantitative structure-activity relationship of interleukin 1-beta converting enzyme inhibitors: A comparative molecular field analysis study. J Med Chem. 1999;42:373–80. doi: 10.1021/jm9708442. [DOI] [PubMed] [Google Scholar]
- 24.Chu W, Rothfuss J, Chu Y, Zhou D, Mach RH. Synthesis and in vitro evaluation of sulfonamide isatin Michael acceptors as small molecule inhibitors of caspase-6. J Med Chem. 2009;52:2188–91. doi: 10.1021/jm900135r. [DOI] [PubMed] [Google Scholar]
- 25.Jones G, Willett P, Glen RC. Molecular recognition of receptor sites using a genetic algorithm with a description of desolvation. J Mol Biol. 1995;245:43–53. doi: 10.1016/s0022-2836(95)80037-9. [DOI] [PubMed] [Google Scholar]
- 26.Jones G, Willett P, Glen RC, Leach AR, Taylor R. Development and validation of a genetic algorithm for flexible docking. J Mol Biol. 1997;267:727–48. doi: 10.1006/jmbi.1996.0897. [DOI] [PubMed] [Google Scholar]
- 27.Golbraikh A, Tropsha A. Beware of q2! . J Mol Graph Model. 2002;20:269–76. doi: 10.1016/s1093-3263(01)00123-1. [DOI] [PubMed] [Google Scholar]
- 28.Golbraikh A, Shen M, Xiao Z, Xiao YD, Lee KH, Tropsha A. Rational selection of training and test sets for the development of validated QSAR models. J Comput Aided Mol Des. 2003;17:241–53. doi: 10.1023/a:1025386326946. [DOI] [PubMed] [Google Scholar]
- 29.Tropsha A, Golbraikh A. Predictive QSAR modeling workflow, model applicability domains, and virtual screening. Curr Pharm Des. 2007;13:3494–504. doi: 10.2174/138161207782794257. [DOI] [PubMed] [Google Scholar]
- 30.Sachs L. Applied Statistics A Handbook of Techniques. Springer-Verlag; 1984. p. 349. [Google Scholar]
- 31.Erickson JA, Jalaie M, Robertson DH, Lewis RA, Vieth M. Lessons in Molecular Recognition: The Effects of Ligand and Protein Flexibility on Molecular Docking Accuracy. J Med Chem. 2004;47:45–55. doi: 10.1021/jm030209y. [DOI] [PubMed] [Google Scholar]
- 32.Becker JW, Rotonda J, Soisson SM, Aspiotis R, Bayly CI, Francoeur S, Gallant M, Garcia-Calvo M, Giroux A, Grimm E, Han Y, McKay D, Nicholson DW, Peterson E, Renaud J, Roy S, Thornberry N, Zamboni R. Reducing the peptidyl features of caspase-3 inhibitors: a structural analysis. J Med Chem. 2004;47:2466–74. doi: 10.1021/jm0305523. [DOI] [PubMed] [Google Scholar]
- 33.Clark RD, Sprous DG, Leonard JM. In: Holtje HD, Sippl W, editors. Validating models based on large dataset; 13th European Symposium on Quantitative Structure-Activity Relationships, 2001; Prous Sci; 2001. pp. 475–485. [Google Scholar]
- 34.Wallace AC, Laskowski RA, Thornton JM. LIGPLOT: a program to generate schematic diagrams of protein-ligand interactions. Protein Eng. 1995;8:127–34. doi: 10.1093/protein/8.2.127. [DOI] [PubMed] [Google Scholar]
Associated Data
This section collects any data citations, data availability statements, or supplementary materials included in this article.