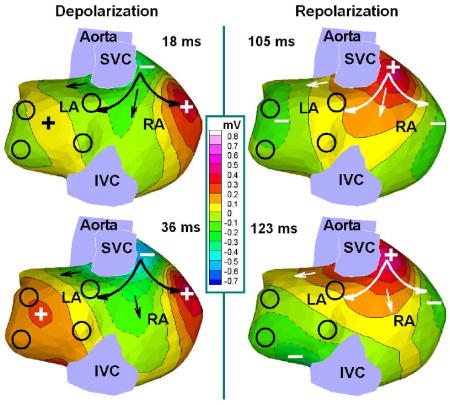
Knowledge of normal atrial activation and repolarization patterns provides an important baseline for understanding atrial arrhythmias. We recently published images of normal atrial activation under complete physiological conditions, using a novel noninvasive imaging modality developed in our laboratory, called Electrocardiographic Imaging (ECGI).1 256 carbon electrodes organized in strips are applied to the patient's torso surface to obtain body surface potentials (BSP) and the patient undergoes thoracic noncontrast gated CT with the electrodes in place. The BSP and anatomical information from the CT scan (torso-heart geometrical relationship) are combined mathematically by ECGI algorithms to noninvasively construct epicardial potential maps, electrograms and activation sequences (isochrones) and repolarization patterns.2 Here we provide images of normal atrial repolarization obtained from a 49-year-old male with normal atrial activity. The figure shows ECGI images of atrial surface potentials at two instances during depolarization (left panel, 18ms and 36ms from onset of P wave) and repolarization (right panel, 105ms and 123ms from onset of P wave); arrows show propagation of zero potential lines, + is potential maximum, - is potential minimum. The sequence of repolarization (white arrows) is determined by and follows the sequence of depolarization (black arrows), unlike the ventricles where the repolarization sequence is determined by local repolarization properties.2 A close similarity between potential patterns during depolarization and repolarization is evident in the image and is consistent with previous invasive mapping in canine experiments.3 The patterns are almost identical, except that the polarity is reversed. This indicates that the repolarization sequence follows the depolarization sequence, because differences in action potential durations across the atria are much smaller than differences in atrial activation times, as expected in the absence of a specialized conduction system involvement. LA: left atria; RA: right atria; SVC: superior vena cava; IVC: inferior vena cava; PV: pulmonary veins (denoted by the four black circles).

Acknowledgments
This study was supported by NIH-NHLBI Merit Award R37-HL-33343 and Grant R01-HL-49054 (to Yoram Rudy) and by a Whitaker Foundation Development Award. Yoram Rudy is the Fred Saigh distinguished professor at Washington University in St Louis.
Footnotes
Disclosures: Dr Rudy chairs the scientific advisory board of and holds equity in CardioInsight Technologies. CardioInsight Technologies does not support any research conducted by Dr Rudy, including that presented here.
Publisher's Disclaimer: This is a PDF file of an unedited manuscript that has been accepted for publication. As a service to our customers we are providing this early version of the manuscript. The manuscript will undergo copyediting, typesetting, and review of the resulting proof before it is published in its final citable form. Please note that during the production process errors may be discovered which could affect the content, and all legal disclaimers that apply to the journal pertain.
Contributor Information
Yong Wang, Cardiac Bioelectricity Center, 260 Whitaker Hall, Campus Box 1097, One Brookings Dr. Saint Louis, Missouri, 63130-4899, Tel : (314) 935-8163 Fax : (314) 935-8168 Email : wangyong@wustl.edu
Yoram Rudy, Cardiac Bioelectricity Center, 290 Whitaker Hall, Campus Box 1097, One Brookings Dr. Saint Louis, Missouri, 63130-4899, Tel : (314) 935-8160 Fax : (314) 935-8168 Email : rudy@wustl.edu
References
- 1.Ramanathan C, Ghanem RN, Jia P, et al. Noninvasive electrocardiographic imaging for cardiac electrophysiology and arrhythmia. Nat Med. 2004;10:422–8. doi: 10.1038/nm1011. [DOI] [PMC free article] [PubMed] [Google Scholar]
- 2.Ramanathan C, Jia P, Ghanem R, et al. Activation and repolarization of the normal human heart under complete physiological conditions. Proc Natl Acad Sci U S A. 2006;103:6309–14. doi: 10.1073/pnas.0601533103. [DOI] [PMC free article] [PubMed] [Google Scholar]
- 3.Spach MS, King TD, Barr RC, et al. Electrical potential distribution surrounding the atria during depolarization and repolarization in the dog. Circ Res. 1969;24:857–73. doi: 10.1161/01.res.24.6.857. [DOI] [PubMed] [Google Scholar]


