Abstract
Time correlated single photon counting allows luminescence lifetime information to be determined on a single molecule level. This paper develops a formalism to allow information theory analysis of the ability of luminescence lifetime measurements to resolve states in a single molecule. It analyzes the information content of the photon stream and the fraction of that information that is relevant to the state determination problem. Experimental losses of information due to instrument response, digitization, and different types of background are calculated and a procedure to determine the optimal value of experimental parameters is demonstrated. This paper shows how to use the information theoretical formalism to evaluate the number of photons required to distinguish dyes that differ only by lifetime. It extends this idea to include distinguishing molecular states that differ in the electron transfer quenching or resonant energy transfer and shows how the differences between the lifetime of signal and background can help distinguish the dye position in an excitation beam.
Keywords: Information Theory, Shannon Information, Single Molecule Spectroscopy, Photon Counting, FRET, PET, etc
I. INTRODUCTION
A. Purpose
This paper extends the information theory formalism developed for two channel[1] single molecule measurements and interphoton-time (intensity) measurements for dye counting[2] to include measurements of the excited state sojourn time (lifetime) that can be obtained using TCSPC (time-correlated single-photon counting). The “interphoton time” and “excited state sojourn time” are the random variables that are, respectively, the observed time between arrival of two photons and the time between excitation pulse and photon pulse in TCSPC. The “intensity” and “lifetime” are parameters deterministically related to the state of the system.
The analyses in this paper are made in the context of the state assignment problem. The system must dwell in the state long enough to collect enough photons to provide the information to assign a particular state over the other possibilities. This is the fundamental limit of the state assignment problem and the main point of the paper. Following this introduction, the paper derives the specific equations in information theory required to evaluate TCSPC measurements and the losses of information in the photon stream due to digitization and instrument response for typical TCSPC experiments. A two-state version of the mutual information of a multi-photon observation for the number of photons is used to provide a given probability for the state assignment. It then applies these equations to several typical problems involving TCSPC measurements of excited state sojourn time in single molecule measurements by solving for the mutual information and plotting it for the different applications. The experimental details of TCSPC affect the quantity of information that is communicated about a system. Information is lost due to the finite response of different single photon timing detectors and by digitizing the TCSPC data set. Information theory is used to evaluate the impact of the amount and source of background on the measurement of the system. The mutual information between the system and the observation is used to characterize the resolution of FRET measurements and of PET and of other lifetime-based measurements. The final application of information theory analyzes a TCSPC-based sub-diffraction position measurement.
B. Single Molecule Luminescence
Spectroscopic measurements performed on single molecules have become commonplace in the last decade, the methods and results of which have been extensively reviewed.[3–10] Most early single molecule measurements focussed only on the intensity or interphoton time as the observable of choice. As technology developed, the inclusion of the excited state sojourn time, t, by using TCSPC became feasible and common.[11] Though many of the technological challenges associated with making single molecule measurements have been solved, the form of the resulting data requires a fundamentally different way of thinking about experimental design and data reduction. Intermittency was of the first such characteristics observed in single molecule signals.[7, 12] Another challenge that arose was large uncertainties in parameters calculated from the data due to propagation of the statistical variations associated with photon counting that have become collectively known as “shot noise.”[7, 13]
There have been many approaches to this problem of distinguishing between states in the presence of what is often called “shot noise.” These include thresholding either with or without the data first being filtered using ad hoc,[14, 15] optimal,[16] or nonlinear[17] methods. Complete use of the information present in the data requires a photon-by-photon approach.[18–20]
Several different approaches have been used to account for the statistical effects that arise in single molecule measurements so that states can be distinguished. Early work used Monte Carlo simulations to estimate shot noise[16], or used ad hoc,[14, 15] optimal,[16, 21] or nonlinear[17] methods filtering to allow state changes to be resolved. Theoretical approaches include the reaction diffusion description[22], self-consistent pathways [23], generating function methods [24], generalized master equation approach to counting statistics [25], generalized optical Bloch equations[26], and statistical analysis of distributions[27], hidden Markov modeling [2, 20] and detailed statistical analyses[19, 28, 29]. Many of these approaches implicitly assume ergodicity or binned data values in their analyses. Optimal use of the information in single molecule data requires a photon-by-photon approach.[2, 18–20, 28–30] However, even a photon-by-photon approach cannot always assign states at a given degree of confidence. Information theory is one approach to allow determination if a particular state assignment is, in general, possible given the observation of a finite number of photons before the state changes.
C. Time-correlated single-photon counting
Because TCSPC determines the luminescence decay based on single photon events, it is particularly useful for single molecule measurements. TCSPC is accomplished by repetitively exciting the sample with a short-duration (≲100 ps) pulsed laser.[31] A time-to-amplitude converter (TAC) is used to determine the elapsed time between the excitation pulse and the arrival of an emitted photon. Even dyes with strongly overlapping spectra can be resolved using the additional information available from the excited state sojourn time.[11] Many environmental changes can influence the fluorescence lifetime including the local dielectric environment, hydrogen bonding, protonation state, proximity to electron donors or acceptors, proximity to resonant dipoles, and proximity to electric field gradients.[32] The orientation of the dye with respect to light collection optics can influence the signal intensity but will not influence the fluorescence lifetime, unless the dye is near a dielectric interface in which case the lifetime of the dye will depend on the orientation of its dipole with respect to that interface.[33]
D. Information theory
Information theory is a mature and active field with many excellent reviews and texts.[34–36]. Information theory’s early applications to coded messages and communication theory[37] leads naturally to applications in genomics. Information theory approaches to statistical thermodynamics[38, 39] and Bayesian statistical approaches to measurement theory[35] combine naturally with the coding applications to give a useful framework for single molecule experimental design and interpretation.[1] Information Information theory has also found application to other fields with weak signals such as astronomy.[40] Surprisal analysis of state-to-state kinetic measurements is based on an information theory perspective of both the measurement and the statistical thermodynamics of the system.[41] This paper expands on the use of Shannon information theory as a tool for evaluating single molecule experiments that was introduced in Talaga (2006).[1] That treatment did not include the information available from the excited state sojourn time as measured by TCSPC. The following section summarizes necessary notation and formulae to expand the information theory formalism to include TCSPC excited state sojourn time information.
Two approaches to information theory have been developed: a parametric form due to Fisher,[42, 43] and a nonparametric form due to Shannon.[37] Both forms have found useful applications in single molecule measurements.[1, 2, 18, 28, 30] Fisher information has been previously used to analyze TCSPC data neglecting the effects of instrumental response.[43] Fisher information is most directly related to the variance of a distribution, whereas Shannon information is sensitive to all moments of a distribution. These are just two of the many different functionals that are maximized and minimized for the one-dimensional distributions that represent minimal and maximal knowledge of the system. If one imposes the additional requirement that the functional be maximized for a multidimensional distribution when the variables/observables are independent, then the following form of entropy is uniquely defined to within a proportionality constant that depends on the choice of base of the logarithm. Entropy ( ) is the expectation value of information:
| (1) |
𝕆 = {𝒪1, ⋯, 𝒪m} represents all possible outcomes of the experiment. The choice of base 2 for the logarithm gives information in the familiar unit of bits.
1. Observables and System State
It is convenient for clarity in the notation to use different symbols for the random variables directly observed (i.e. photon properties 𝕆 = {𝒪1, ⋯, 𝒪m}) and the random variable(s) about which inference is made (i.e. the state of the system 𝕊 = { 1, ⋯,
1, ⋯,  w}), though there is no mathematical requirement for the distinction. For an observable to be useful, it must be conditionally dependent on the state of the system. In the present application the observables are the time between photon observations (interphoton time, T) and the time between absorption of the photon and emission of the photon (excited state sojourn time, t). Both of these observables 𝕆T, 𝕆t depend on the state of the system,
  j. However, as long as the molecule remains in the same state during the excited state sojourn time and the effects of anti-bunching are negligible (i.e. the interphoton is long compared to excited state sojourn time), then the observation of a particular 𝕆t is independent of the 𝕆T. Some detectors exhibit a non-negligible intensity-dependence to their propagation delay.[44] This effect is usually negligible over series of photons with a given average intensity as is expected for a given state. The assumption of a particular state is valid in the sense that the point of this analysis is to determine the number of photons required to assign the state prior to a state change. Hence, in this analysis, the observables are conditionally independent of each other.
| (2) |
Note that this does not imply that the observables do not have any correlation upon a state change nor that they are independent of the state. This conditional dependence of the distribution of observable values is the conduit for information about the system state.
| (3) |
Therefore it is the conditional information-theoretical quantities that are most relevant to the present analysis.
2. Mutual Information
The conditional entropy,  (𝕊|𝕆) is the information expected to be still undetermined in the state of the system, 𝕊 = {
 1,···,
  w}, once an observation 𝕆 has been made. The average amount of information that the measurement 𝕆 conveys about the system 𝕊 is the mutual information,
  (𝕊, 𝕆). The amount of information that the observation communicates about the system is equal to the decrease in system entropy that occurs as a result of the measurement.
Most comparisons are best made using the mutual information,
| (4) |
which is the amount of information that a measurement of 𝕆 conveys, on average, about the system 𝕊. For a two-state system 𝕊 = { 1,
1, 2} and
  (𝕊) = 1 bit. The mutual information is equivalent to the amount that the entropy of the observer’s knowledge of the system is reduced as a result of the measurement. Equation 4 is the quantitative expression of the idea that the amount of information delivered by an experiment is the difference between the uncertainty before and after the observation is made.
3. Multiple Observables
Often there are multiple observables recorded jointly in an experiment that are independent for a given state, e.g. the excited state sojourn time and interphoton time may be simultaneously recorded. To treat multiple sources of information about the system, the mutual information must be generalized to multiple observables.’ Observables that can be simultaneously measured can be divided into two classes. The first class includes properties of the photons, such as wavelength and polarization, that can be determined by multiple detection channels, with 𝒪n being the detector number. As discussed above, the interphoton time essentially independent of the excited state dwell time and is therefore also essentially independent of the detector number. The interphoton time is related to the total intensity. The second type of additional observable is independent of the photon observation and could include force or electrical measurements, 𝒪f. The information and entropy of multiple instances of groups of jointly measured conditionally independent observables can be treated using the following probability expression:
| (5) |
The conditional self-information of the state  j given observations 𝒪t, 𝒪T, 𝒪n, 𝒪f is:
| (6) |
The conditional entropy of the set of all states S given the set of all observables 𝕆t, 𝕆T, 𝕆n, 𝕆f is:
| (7) |
which, because of the relationships of the variables can be written as:
| (8) |
Using Eq. 8 in Eq. 4 allows the information contributions from multiple jointly measured observables to be included.
4. Multiple Observations
In general, a single observation of multiple variables will rarely be sufficient to resolve states. For multiple observations, n, of a discrete (digitized) observable, 𝒪l the general form for the probability distribution function is:
| (9) |
with l⃗ being a vector of the n observations. Eq. 9 is used in Eq. 4. In many cases Eq. 9 will simplify to special forms. For example, if  (𝒪l|
(𝒪l| j) is an exponential distribution, the multiple observation case will be a gamma distribution.
II. COMPUTATIONAL METHODS
Where numerical results are shown, the appropriate formulas were evaluated numerically using Mathematica 6.0 and Igor Pro 6.01. Figures were rendered in Mathematica, Igor Pro, and OmniGraffle Pro.
III. RESULTS AND DISCUSSION
A. Information content of photon stream
Talaga (2006)[1] previously analyzed continuous-wave–excited photon streams from arbitrary and single molecule sources. The information content of a generic photon stream is limited by the time-bandwith product of electromagnetic radiation.[1] The photophysical properties of chromophores further limits the information content of a single molecule photon stream.[1, 2] The photon stream arising from a single dye that is periodically excited by an ultrafast (effectively a delta function) pulse often shows exponentially distributed excited state sojourn times, t with detection rate k,
| (10) |
The average information present in the delay between excitation and emission of the photon (i.e. the excited state sojourn time) is
| (11) |
Since Eq. 11 is evaluated over a continuous probability density, the entropy calculated is most useful when evaluated relative to other continuous densities to determine changes or differences in entropy, such as those that occur as part of the TCSPC measurement process. The finite-range normalized uniform distribution is a useful reference.
1. Two-State Information
Normally the point of making the measurement is to determine the state of the system. Important to the design of an experiment is the fraction of the total photon stream information that encodes the state of the system. The amount of information present about the system is typically a small fraction of the information recorded. A two-state formalism is sufficient to examine the system information present in the photon stream. For systems with more states, this limit is still useful since it can be understood as distinguishing between the two states are most likely given the data. The other states would have negligible probability in this case. When examining continuous properties, such as a distance, the formal pair of states can be understood as bracketing the uncertainty of the measurement.[1]
Two dyes with different lifetimes can be distinguished even if they have the same observed intensity. To compare two states with different lifetime, consider the following simplified notation. If one dye (or two different dyes) can exhibit two different lifetimes τ1, τ2 dependent on the state of the system, define the average decay rate k̅ and reduced rate difference Δ according to:
| (12) |
The sojourn time, state joint probability distribution function is
| (13) |
where  (
( j) is the steady-state probability of state
  j and kj is the excited-state decay rate of state j ∈ {1,2}. The marginal likelihood of the sojourn time is
| (14) |
The mutual information between observed excited state sojourn time and the molecular state is
| (15) |
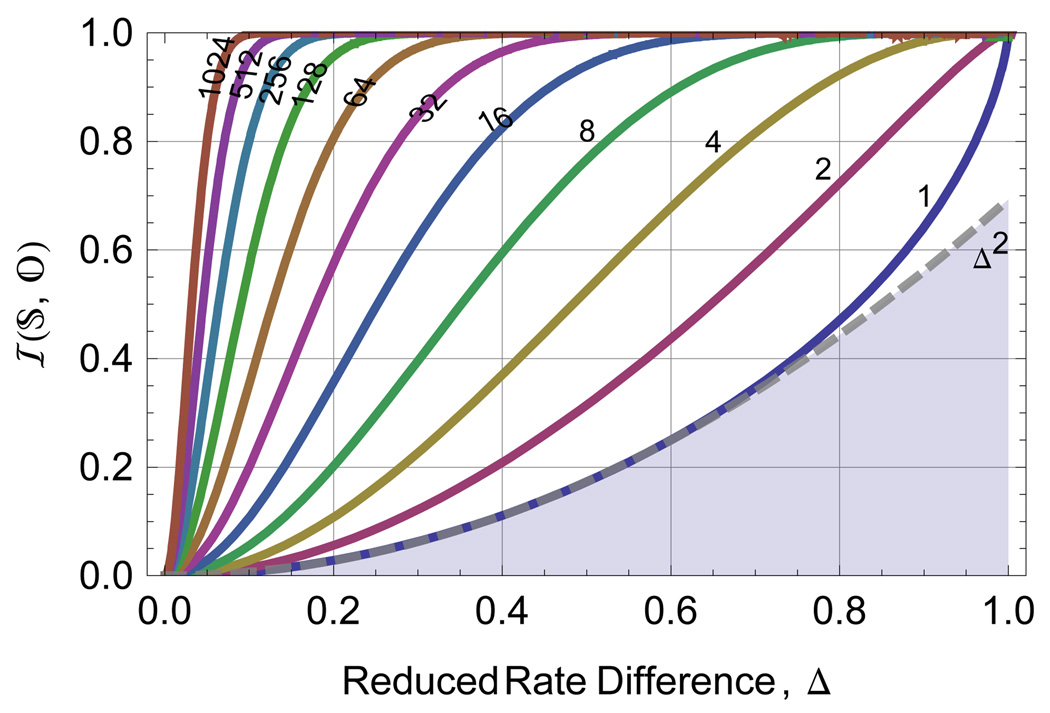
The blue curve in Fig. 2 shows the numerical integration of Eq. 15 as a function of Δ for a two state system with equal prior probabilities . This is the maximum system information available from a photon sojourn time measurement; instrumental limitations can only reduce this quantity. In most experiments the resolution of multiple states will be limited by the pair of states with the smallest difference in mutual information with the observable, rendering the two-state analysis useful in nearly all circumstances. Extension of Eq. 15 to more than two-states requires only specifying the equilibrium or prior probabilities,  (s), and rates, ks for all states and extending the sum.
FIG. 2.
The system information (from Eq. 16) for observing n photons (see labels on solid lines) when attempting to distinguish two exponentials. This information does not include any losses due to background, instrument response, or digitization. For modest differences, Δ, in excited state decay rate, the per-photon mutual information is adequately represented by the approximation formula in Eq. 15 shown as the dashed line.
State assignments will usually require observation of the excited state sojourn time from multiple photons. The excited-state sojourn time of a Poisson emitter will be exponentially distributed. When the IRF is narrow compared to the lifetime being measured, the PDF for the observed TCSPC can be taken to be a simple exponential function and the observation of multiple sequential excited-state sojourn times from a Poisson emitter will be gamma-distributed.
| (16) |
In this case t is the total time for the n events drawn from an exponential distribution of average lifetime τ. Substituting Eq. 16 into Eq. 4 gives
| (17) |
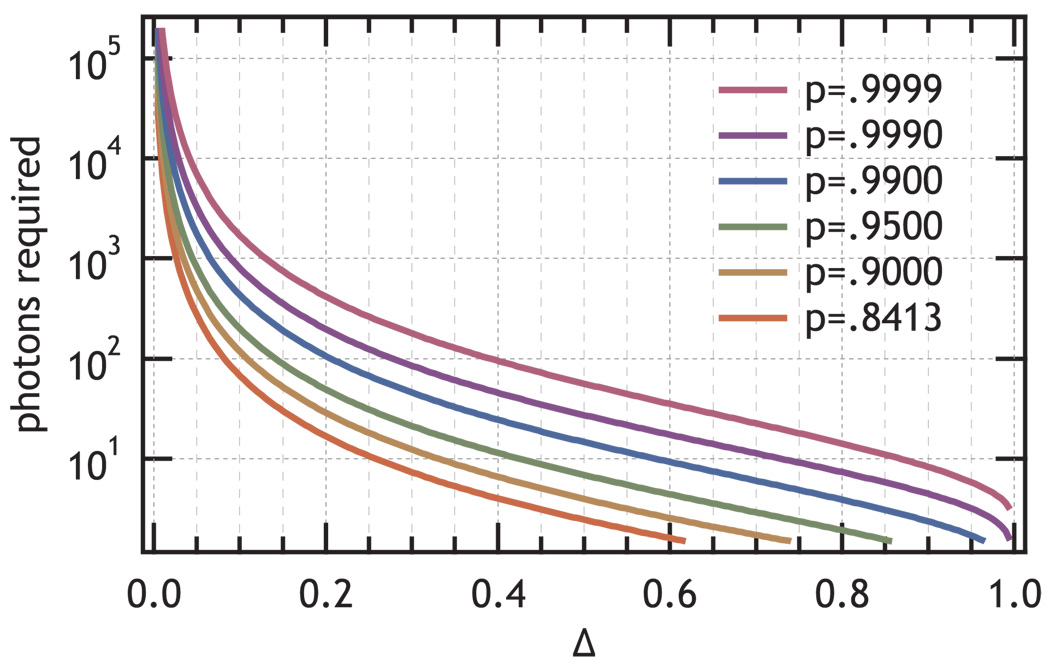
The curves for n > 1 in Fig. 2 were evaluated using Eq. 17. Figure 3 shows the results of solving Eq. 17 for the number of photons required to provide information equivalent to the posterior likelihood of one of the states reaching a given probability as labeled in the graph. The figure illustrates the strong dependence of the required number of photons on the difference in the exponential rate, Δ. For small values of Δ, all the photons from the experiment prior to photobleaching would be required to determine the state with confidence. Fortunately many experiments will have Δ in the reasonable range of 0.05 and 0.4 where the number of photons required will be between 10 and 103.
FIG. 3.
Contours of constant information evaluated for different values of Δ and p for  (𝕊,𝕆) equivalent to a likelihood, p, of determining a state, as indicated in the figure, that show the number of photons required to resolve two states that differ by Δ as defined by Eq. 12. The green p=0.95 line (n ≍ (ln(2)
 (𝕊, 𝕆))−1) is used to convert information per photon to number of photons required for p=0.95.
B. Information losses in TCSPC
This section evaluates how the choices of TCSPC experimental parameters and the presence of different types of background result in a loss of information about the system. Real measurements will provide less mutual information due to a variety of sources. The information theoretical analysis allows the investigator to determine how experimental parameters need to be adjusted according to the system being studied.
1. Time-to-amplitude-converter (TAC)
Both systematic and random errors occur during the time-to-amplitude-convertion (TAC) process in TCSPC. Under most circumstances the loss of information due to these errors are included in the the losses due to instrument response. In cases where the TAC response is non-linear, then the uncorrected observations will not follow their theoretical (i.e. exponential) distributions. This type of experimental issue is best resolved with calibration and control experiments.
2. Digitization Losses
Digitization of the analog voltage provided by the TAC is another potential source of information loss. The largest potential effect on the information is due to non-linearity in this process. This problem can be eliminated by explicitly included by calibrating the digitizer and including the non-uniformity of bin width into the expression for the probability. A simple two-step calibration can provide this information first by measuring the bin-wise uniformity of an uncorrelated classical light source, followed by systematically measuring instrument responses using known spatial delays. Though potentially a large effect, any loss of information due to digitizer non-linearity is simple to eliminate and not fundamental to the measurement, and will therefore not be considered further.
Even ideal digitization of the signal can reduce the amount of information present in the photon stream. The amount of information present in a discretized exponential distribution is less than that in the continuous arrivals of the photon stream, potentially reducing the ability of the experiment to distinguish between molecular states based on the lifetime τ = 1/k. The digitizer resolution (δt) and depth (n) determine its range (δtn) and whether a given excited state decay rate (k) can be accurately measured. The likelihood of digitized photon arrival times (neglecting instrument response) is given by the finite-range discrete exponential distribution:
| (18) |
here i = {0, ⋯, n − 1} is the bin number, k is the exponential decay, δt is the digitizer least-significant-bit resolution and n is the number of bins for the full range of the digitizer.
The loss of information can be characterized by taking the difference between the continuous and discrete entropies with the following expression.
| (19) |
If the decay of the excited state is effectively complete by the end of the TCSPC window, then the infinite range expression can be substituted:
| (20) |
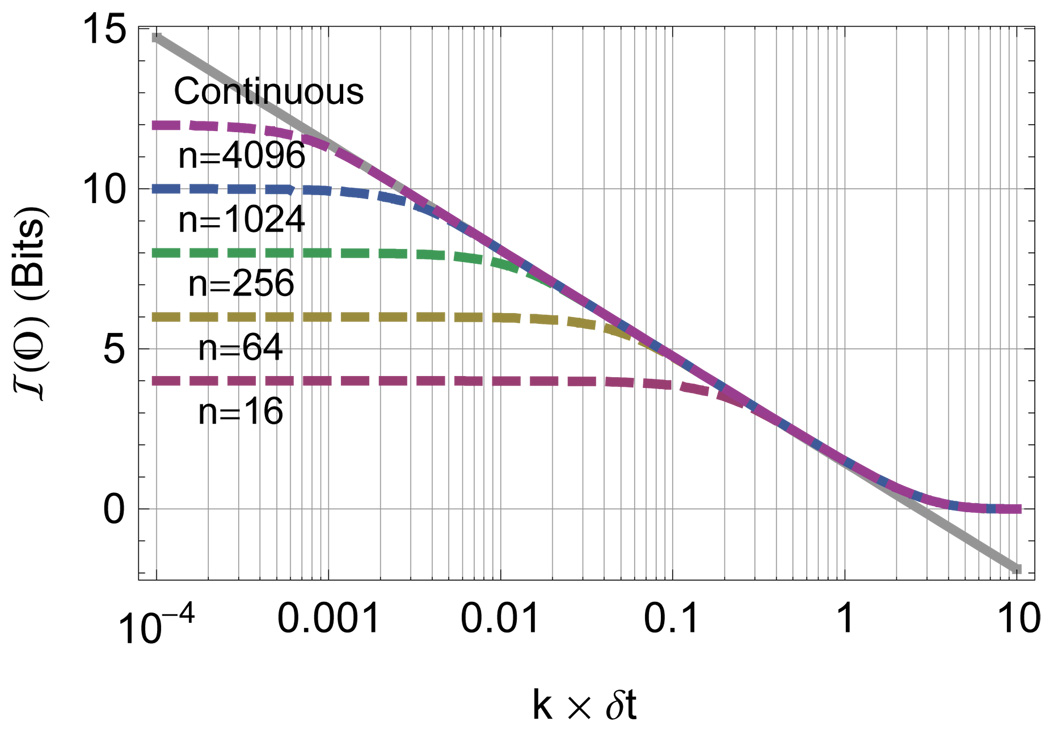
The difference between the discrete entropy and the continuous entropy become apparent when k becomes comparable to 2/δt or 3/(n δt). The maximum value of k that can be observed losing no more than  loss bits of information from the photon stream is:
| (21) |
Under most circumstances the fast rates are limited by instrument response and the slow rates by the laser repetition rate.
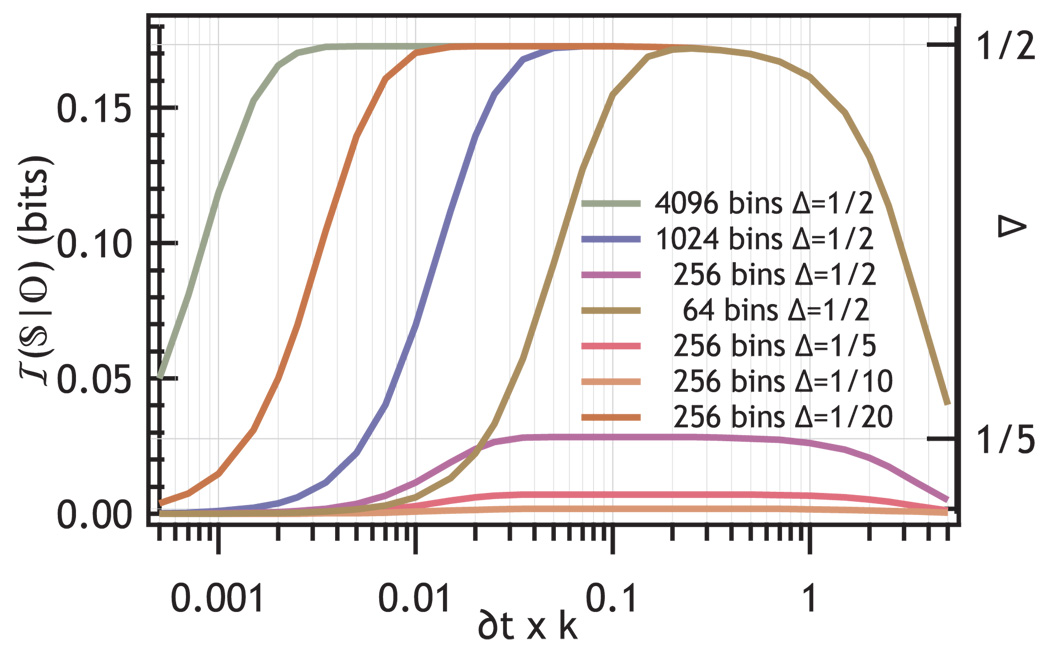
Figure 5 shows the influence of ADC settings on the information content as a function of k for several different values of the reduced rate difference Δ and digitizer bins. In the center of the range the information approaches the value determined by Eq. 15. The loss of information at δt comparable to 1/k̅ occurs because most of the photons arrive in a single bin. When nδt < 1/k̅ the range is inadequate to represent the decays.
FIG. 5.
Effect of choice of TAC resolution and TAC range on the system information communicated by a TCSPC photon stream with average rate k̅ and rate difference Δ as labeled in the figure. The horizontal grid lines show the lossless limit for different values of Δ indicated on the right axis.
The TCSPC parameters for a given experiment are optimized when the mutual information is at a maximum. Because the system entropy is independent of the experimental parameters maximizing mutual information, Eq. 4 is equivalent to minimizing the expression for the conditional entropy, Eq. 7. Differentiating Eq. 7 for a single observable with respect to one of the experimental parameters simplifies to:
| (22) |
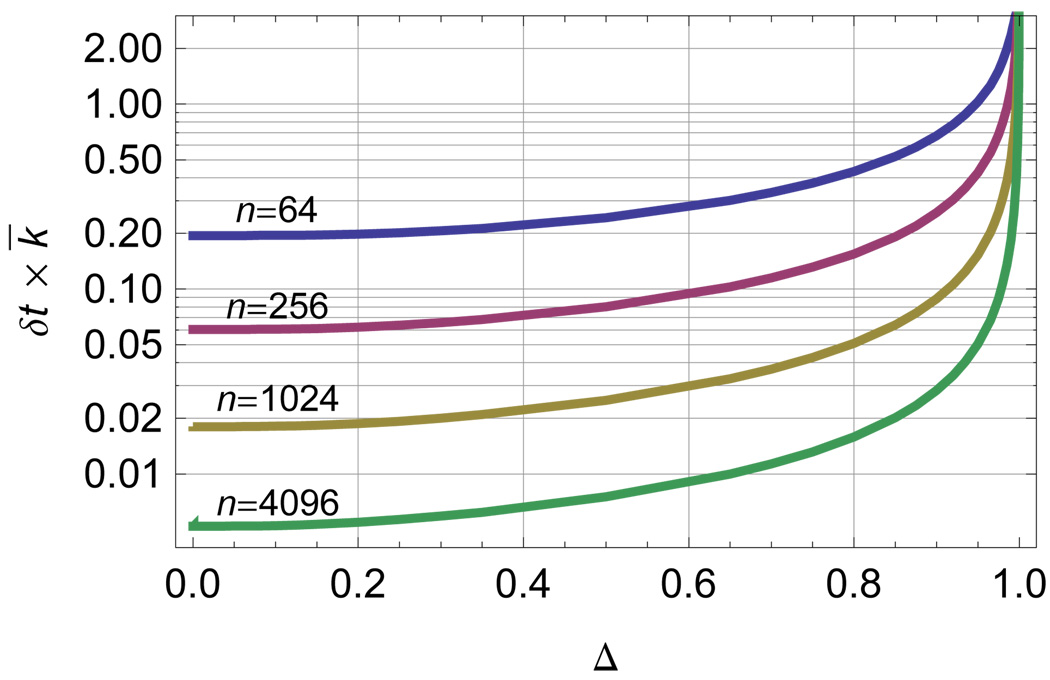
Fig. 6 shows the optimal value of δt, in units of 1/k̅, for various ADC resolutions as a function of the reduced rate difference, Δ. The values determined by information theory are similar to those an experienced experimentalist would choose based on physical intuition. Information theory provides a way to determine if ad hoc choices of experimental parameters are reasonable and do not result in the loss of information. Moreover they provide a way to choose the minimum number of bins consistent with full acquisition of system information in a particular experiment.
FIG. 6.
The digitizer resolution can be optimized by finding the extremum of the mutual information using Eq. 22. The value of the ADC resolution, δt, in units of 1/k̅ that maximizes mutual information between the system and observation is plotted versus the reduced difference in excited state decay rate Δ for several digitization depths n as labeled on the figure.
Fig. 5 shows that when an optimal choice of the data acquisition parameters is made, there is always a reasonable range of lifetimes that can be measured without significant loss of information due to digitization. In the applications of the theory that follow, such an optimal choice of the TCSPC parameters has been assumed.
3. Instrument Response Losses
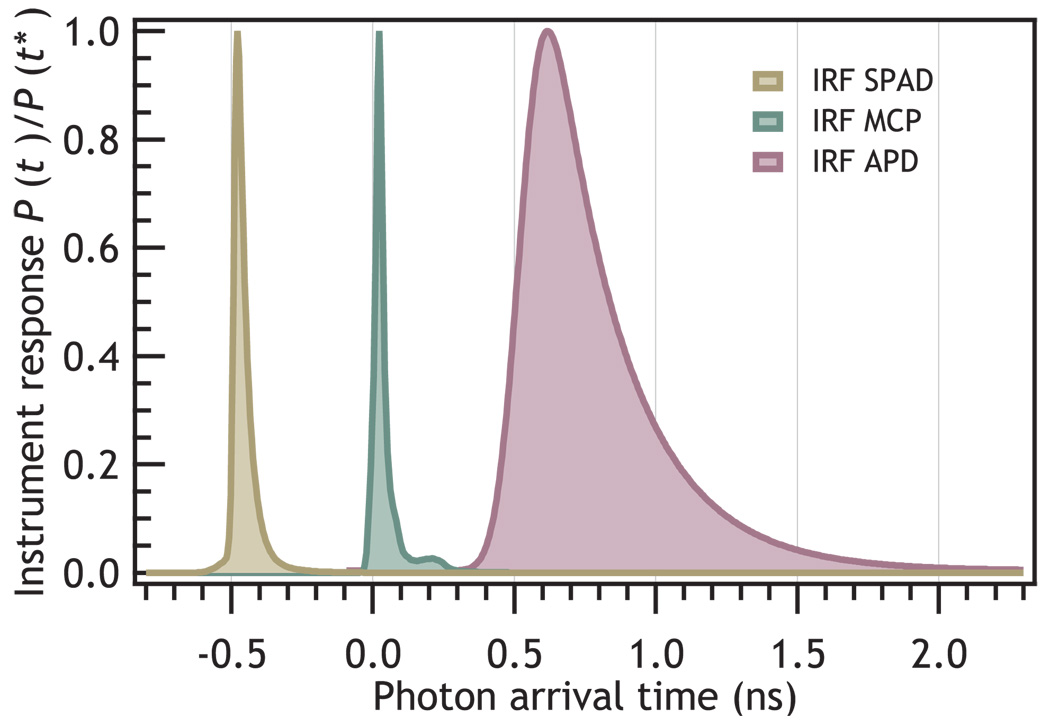
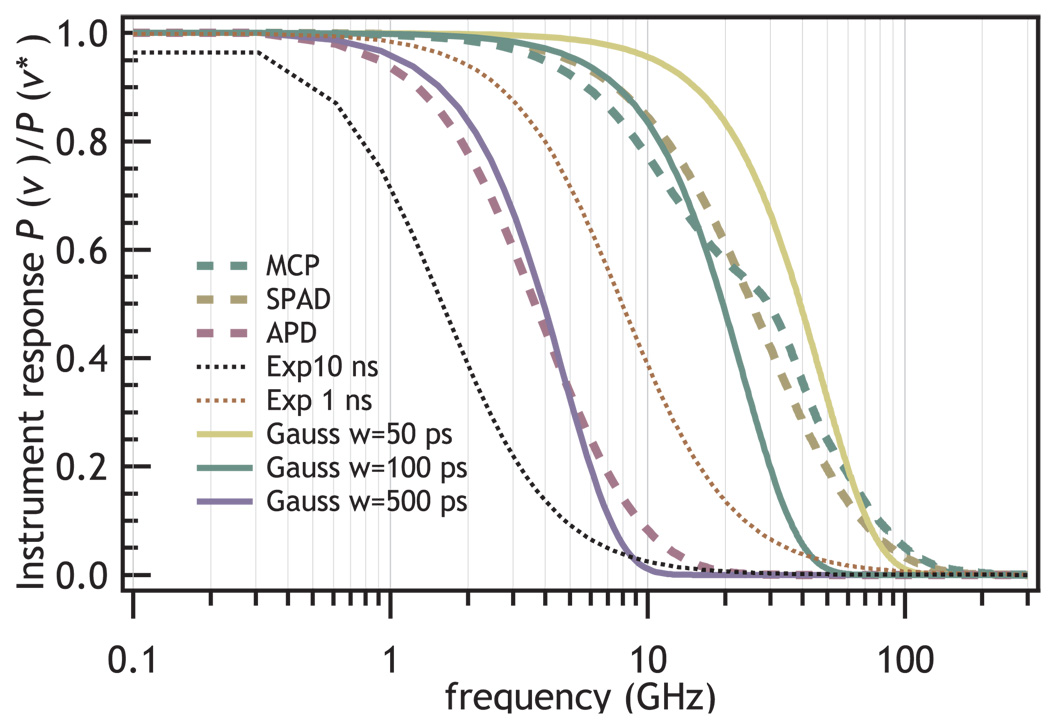
Electronic timing of photon arrivals introduces uncertainty due to the instrument response. The finite instrument response function (IRF) always reduces the amount of information in a single photon counting based single molecule measurements. The amount of information that is lost due to the IRF depends on the detection system used. The most commonly used detectors are microchannel plate photomultipliers, and avalanche photo-diodes. Figure 7 shows three different experimental IRFs. The instrumental response limits δt in Eq. 19. With current hardware there is a trade off between detection sensitivity and bandwidth. (Fig. 8)
FIG. 7.
This figure shows three different experimental instrument response functions. Center: The instrument response of a microchannel plate photomultiplier, Left: from a small area avalanche photodiode, and Right: from a large-area APD. The zero-time has been offset for clarity
FIG. 8.
Figure illustrating the effective bandwidth and how it depends on instrument response. The dashed lines show the power spectrum of the experimental instrument response function shown in Fig. 7. The solid lines show the theoretical power spectrum for Gaussian IRFs. The dotted lines show the power spectrum for Poisson emitter with a 1 or 10 ns excited state lifetime.
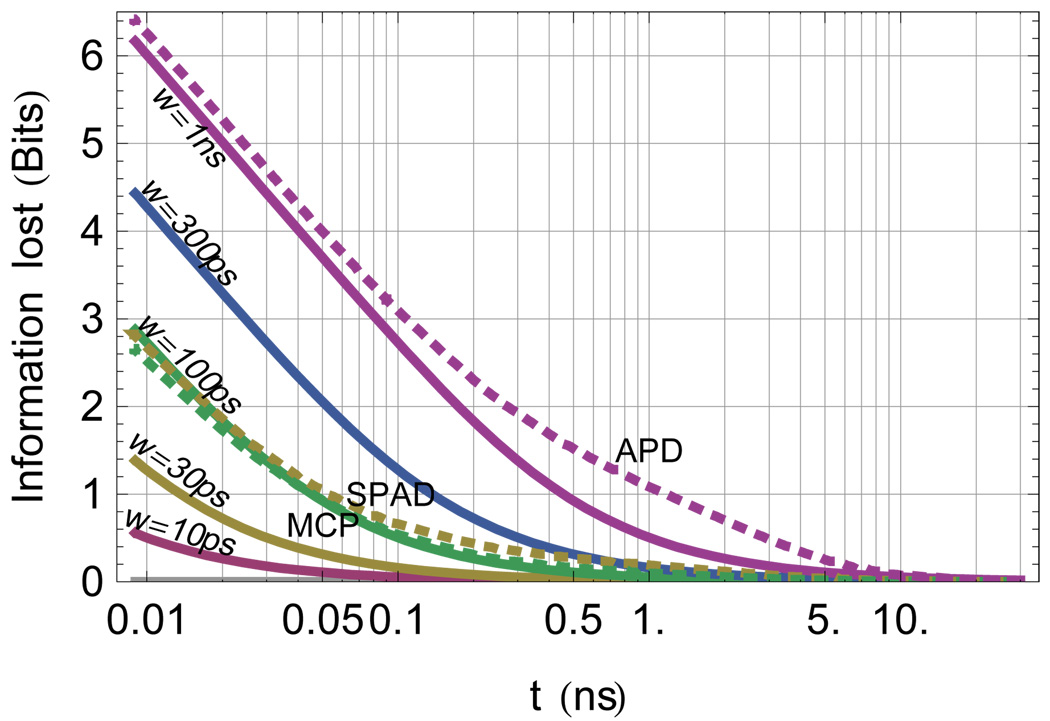
The IRF does not affect the information content of every single molecule signal equally. The information content of short-lifetime signals will be more greatly affected than will be long lifetime signals because of the finite bandwidth of the instrument. Fig. 8 compares the bandwidth of different signals to different real and idealized detectors. The resolution of the lifetime decreases as the lifetime approaches the limit of instrument response.
In this case the the original  (t) is a simple exponential and it has been corrupted by the instrument response,
  (t). Idealizing the IRF as a Gaussian with similar bandwidth:
The measured signal is the convolution of the source exponential  (t) and the instrument response
  (t)
(t)
Since the effect of  (t) is typically to “smear out” the signal
  (t) the net result is an increase in the entropy, given by
| (23) |
| (24) |
and the loss of information is given by the difference between the entropy of the source, Eq. 24, and the observed signal, Eq. 23,
| (25) |
In this case the the source,  (t), is a simple exponential and it has been corrupted by the instrument response,
  (t). If the IRF is approximately Gaussian then
| (26) |
| (27) |
| (28) |
| (29) |
Where w is the fwhm, σ is the Gaussian standard deviation τ is the average exponential lifetime and t is the randomly observed excited state sojourn time.
Evaluating Eq. 25 using Eq. 26 and Eq. 27 gives the bold line in Fig. 9. Using the instrument responses in Fig. 7 illustrates how detector choice influences the information content measured from the photon stream. Fig. 9 suggests that a Gaussian of appropriate fwhm is a good approximation of the IRF for predicting the information content of the data. Fig. 4, Fig. 5, 10 and 11 also illustrate the loss of information by plotting the information directly rather than evaluating Eq. 25 for those cases.
FIG. 9.
The effect of the instrument response is to reduce the information measurable in the photon stream. This effect is most noticeable for short lifetimes. The solid lines show the loss due to Gaussian instrument response at various fwhm values from 10 ps to 1 ns as labeled in the figure. The dotted lines show the corresponding losses for experimentally derived instrumental response functions from microchannel plate photomultiplier, and avalanche photodiodes from two sources. This figure illustrates the loss of mutual information between the system and the measurement that occurs versus lifetime for a given instrument function. The effect of the instrument response function on the information content per photon in a TCSPC measurement depends strongly on the lifetime to be measured and weakly on the nature of the instrument response function.
FIG. 4.
Effect of digitization on the per photon information content from the exponential lifetime. The information content of the photon stream is displayed before (solid) and after (dashed) varying digitization at depth n as labeled in the figure as a function of the excited state decay rate (k) in units of reciprocal digitizer resolution (1/δt). In the limit of small δt compared to k the average information is the maximum entropy value log2 n. The range over which the discrete approximation is valid is visible as the region of correspondence between the continuous line and the digitized lines and is given by Eq. 21.
FIG. 10.
Effect on information of Raman-type background (top) long-lived background (center) or dark counts and fluorescent background (bottom) on the information delivered per photon about a system with a lifetime difference given by Δ=0.1 detected by an instrument with a 100 ps fwhm response. The values of the signal-to-background ratio, γ, are labeled on the traces. The γ = ∞ trace is the same for all three panels. The dashed lines represent the reduction of information expected if the background photons fall outside the TAC range and gives the pure information dilution limit.
FIG. 11.
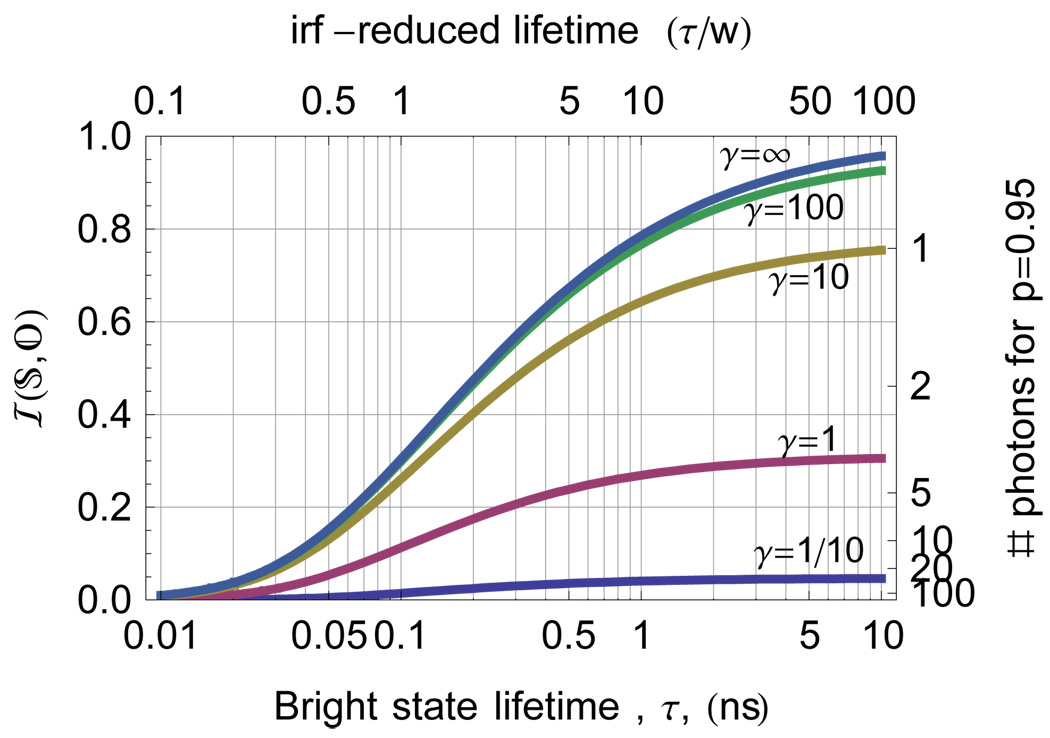
The mutual information between a dark state and a bright state as a function of bright state lifetime for different levels γ=S:B of Raman-type background. The right axis shows the equivalent number of photons expected to distinguish the dark state at p=0.95.
4. Information Losses due to Background
If the distribution of the observable arises from two (or more) sources (e.g. signal and background) then a mixture model can be used to describe the information content of the system. For example if the signal-to-background ratio is defined as S: B = γ then the overall PDF is:
| (30) |
where  (Ot|
(Ot| ) and
) and  (Ot|
(Ot| ) represent the set of likelihoods of observations for signal and background, respectively. An analogous formula can be used to describe a molecule that is exchanging between two environments on a time scale that is fast compared to the interphoton time but slow compared to the excited state lifetimes.
Background photons carry no information about the state of the system. As a result they dilute the average information delivered.[1] This dilution effect is
| (31) |
In addition the distribution of  (Oi|
(Oi| ) may confound determination of the state in a way that depends on the source of the background.
Prompt background arising from Raman scattering in the sample is 100% correlated with the excitation pulse and appears as an instrument-response-limited contribution to the overall sojourn time distribution.
One would, therefore, expect large amounts of Raman background to cause difficulties distinguishing the short-sojourn time end of the distribution. Figure 10(a) shows this effect.
Uncorrelated background appears as an increase in the baseline of the TCSPC trace because it is essentially uncorrelated with the excitation pulse.
Such signals will typically arise from two types of sources. The first type includes dark counts and room lights and is independent of laser intensity. The second type arises from the presence of impurities that have luminescence lifetimes that are substantially longer than the inter-pulse time determined by the laser repetition rate. This second source will increase with laser intensity until the impurity excited states become saturated. Of the two types the second is more likely to cause experimental difficulties because its contribution to γ = S:B cannot be reduced by increasing laser intensity. Figure 10(b) shows the effect of uncorrelated background on the mutual information.
Pernicious sources of background such as those that have a lifetime comparable to that of the species being measured corrupt a large region of the available experimental range of a sojourn time experiment.
Figure 10(c) shows that, as expected, the information goes through a minimum at the lifetime, τb, characteristic of the background.
Consider that amount of information per photon from the system is not as greatly reduced. However, maximum rate of information obtained is reduced because of the requirement of TCSPC to detect only one photon per excitation pulse. This analysis considers the background to be identical in the two states. Section III D will treat a case where this is not true and show that it is simple to include such effects.
5. Interference from dark states
The presence of transient dark states due to dye intermittency can interfere with distinguishing a state. Fig. 11 shows the mutual information between a dark state and a bright state as a function of bright state lifetime for different levels γ=S:B of Raman-type background. The right axis shows the equivalent number of photons expected to distinguish the dark state by decreasing the system entropy to a level consistent with  =0.95 in Eq. 1.
C. Distinguishing spectrally identical dyes by lifetime
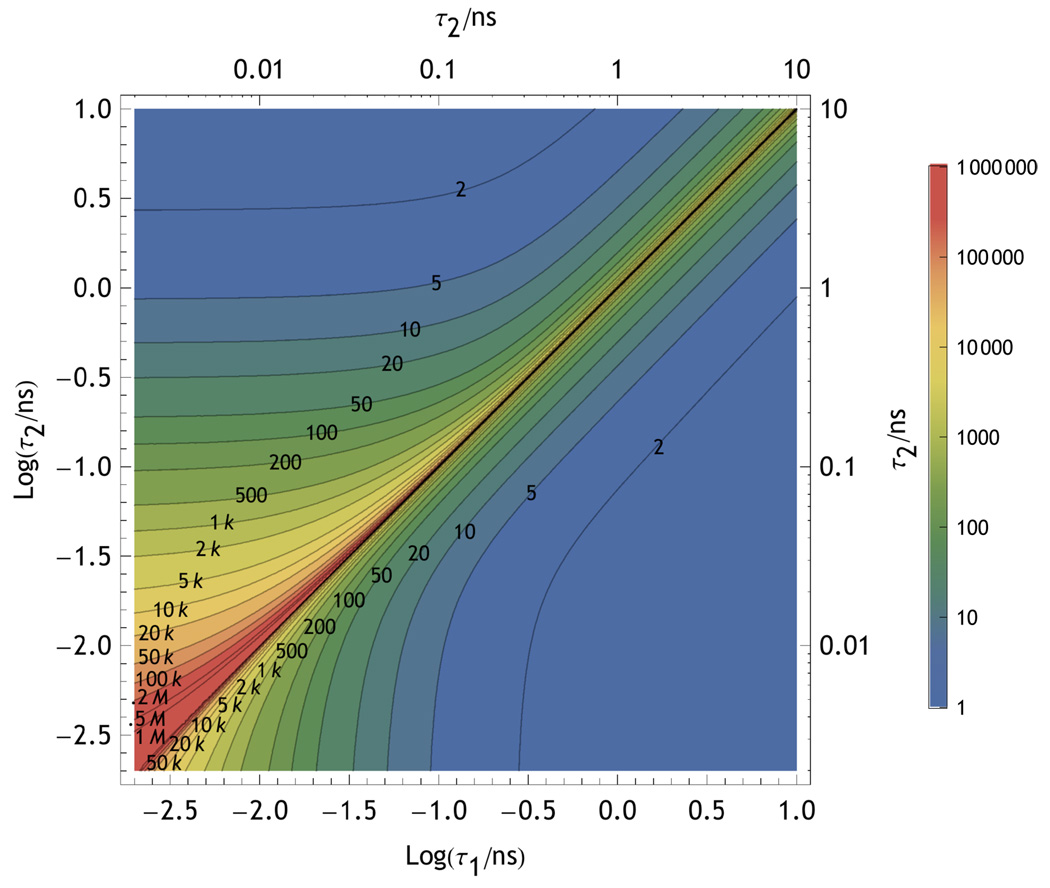
This section evaluates the content and resolution of experiments involving differences in luminsecence lifetime. There are two common situations where the experimental goal would be to distinguish between dyes that are spectrally identical but have different luminescent lifetimes.[45] The first is when two different dyes have essentially overlapping spectra, yet have different luminescent lifetimes. The second is when the same dye can be observed in two different environments that change its luminescence lifetime. Using Eq. 29 in Eq. 15 evaluates the ability to distiguish the dyes changes with the difference in lifetime as well as the lifetime relative to the width of the IRF.
The diagonal contours of Fig. 12 are consistent with the resolution depending principally on the relative difference between the lifetimes of the dyes, consistent with the results shown in Fig. 2. The instrument function degrades the information at short lifetimes as does the presence of increasing amounts of background. There is no system information discernible when the two states have the same lifetime: zero information along the diagonal. Above the diagonal in Fig. 12, the information for short lifetime states is reduced for the 1 ns IRF compared to the 100 ps IRF below the diagonal, consistent with the results of Fig. 9 For the organic dyes used in single molecule measurements, the lifetime will rarely be shorter than ∼1 ns in the absence of quenching. As a result the background contribution will usually be greater for dyes with very short lifetimes as they will have lower quantum yields.
FIG. 12.
Contours of constant photon number as labeled on the figure that give  (𝕊, 𝕆) equivalent to 95% likelihood of distinguishing two dyes (or states) with lifetimes τ1 and τ2. The contours above the diagonal include the effects of a w=1 ns Gaussian instrument response whereas those below the diagonal include a w=100 ps Gaussian IRF. The green zone on the plot shows the ideal region for single molecule measurements.
D. Resolution of a PET distance measurement
This example uses the formalism to analyze the ability of a single molecule TCSPC measurement to distinguish molecular states that differ in the degree of photo-induced electron transfer quenching of the luminscence. Information theory shows how to determine the number of photons required for a given resolution of the electron transfer distance measurement. Certain details of this analysis are specific to electron transfer in proteins, however those details can be readily adapted to other systems. This analysis includes only the information available from the excited state sojourn time. The intensity can include be modulated by the orientation and position of the molecule with respect to the optics of the instrument. If the molecule is translationally immobilized and rotationally either completely free or completely immobilized, then the intensity information can be included as in Messina et al. (2006). [2]
1. Formulation
Many dyes can act as electron donors or acceptors when in the excited state making electron transfer a process that competes with radiative decay.[46, 47] Electron transfer can occur via multiple pathways and mechanisms in proteins.[48] Direct electron transfer between a fluorescent dye and single redox partner on the protein — usually an amino acid side chain — via the superexchange mechanism is most relevant to single molecule measurements. At very long and very short distances other mechanisms will also contribute. The superexchange mechanism is usually described by a semi-classical theory that treats the nuclear degrees of freedom classically and the electron transfer quantum mechanically. For a fixed donor-acceptor geometry, the semiclassical theory predicts that the electron transfer rate, ket, can be computed as:
| (32) |
ΔG° is the electronic component of the free energy change of electron transfer and λ is the component associated with nuclear reorganization.[49] HAB is the quantum mechanical electronic coupling between the donor and acceptor at the transition state. The exponential decrease in HAB with donor-acceptor separation dominates the distance and orientation effects on ket for a given donor-acceptor pair. Retaining only this dependence and combining the remaining constants gives a useful phenomenological result:
| (33) |
with k0 being the electron transfer rate at closest contact, r0, of the donor-acceptor separation, r.
Where β is an empirical scaling parameter that depends on the nature of the amino acids and their structure that separate the dye and quencher. β typically ranges between 1.1±0.04 Å−1 depending on the intervening protein structure.[50] The preexponential factor depends on the dye-quencher pair used and is often interpreted as the electron transfer rate at closest approach of dye and quencher. The resulting sensitized lifetime is τet = 1/(1/τ0 − ket). Note that uncertainty in the unsensitized lifetime and knowledge of the scaling factor β can contribute greatly to errors in the absolute distance determination, but not the relative distance. Since β can depend on the state of the system the uncertainty in distance is less meaningful than that of the state assignment.
Consider two states that differ in distance between the dye-quencher pair, the electron transfer rates are,
if the conformational change has not altered β or k0. Therefore the resulting two excited state decay rates generate the following dependence of the reduced rate parameters on distance change between states as:
Changes in driving force and reorganization energy are reflected through their effect on k0 The exponential scaling parameter, β, depends on, among other things, the orbital overlap through the intervening polypeptide chain and is modulated by the changes in protein backbone geometry.[48, 50]
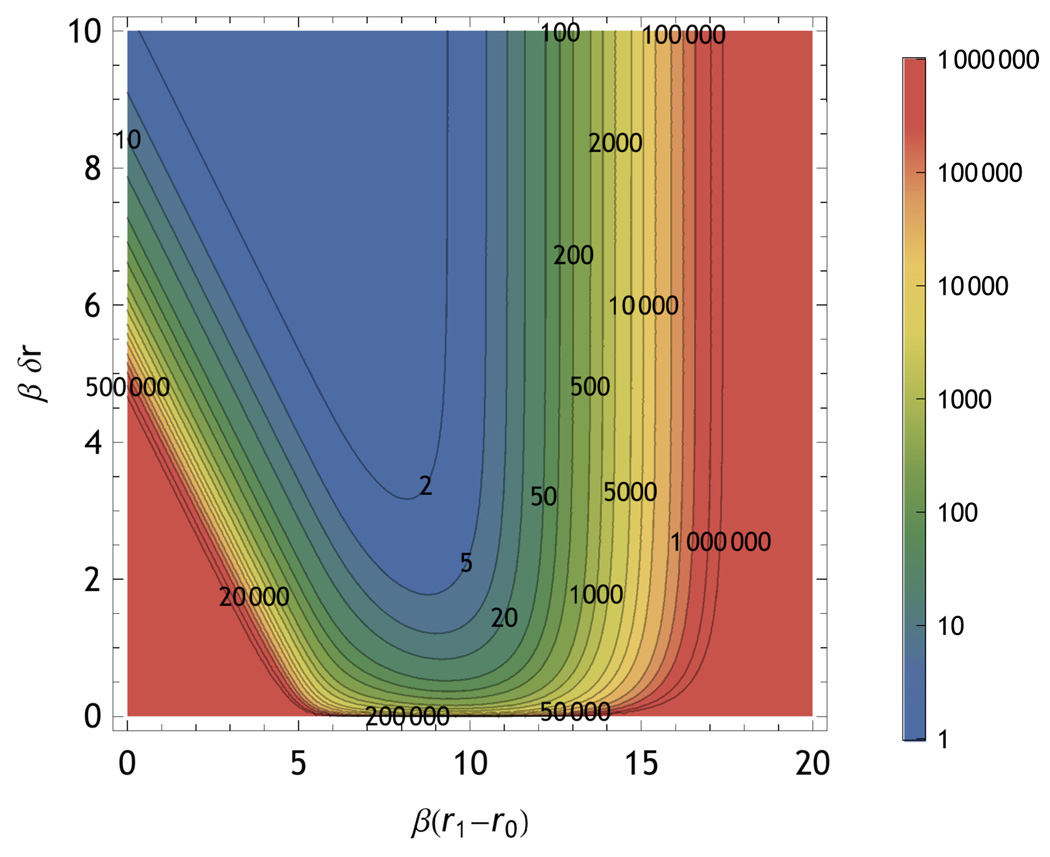
The measurable range of r in a PET measurement depends primarily on the value of k0 relative to kr. kr typically falls between 0.1 and 1 GHz for dyes that are appropriate for single molecule measurements. The range is limited on the short side by the lack of signal photons due to quenching and due to the loss of information from the IRF. On the long distance side the range is limited by the diminishing change in lifetime as the quenching becomes negligible. Figure 13 shows the resolution for two-state PET measurements for different numbers of detected photons. Values of kr=0.1 GHz, k0 = 104 GHz γ0= 10 were used to generate Fig. 13.
FIG. 13.
Information of Photoinduced electron transfer experiments: Contours of constant photon number as labeled on the figure that give  (𝕊, 𝕆) equivalent to 95% likelihood of distinguishing a PET-quenched state at the position given by the horizontal axis and a second state that is a distance farther away as given by the vertical axis. The green zone on the plot shows the ideal region for single molecule measurements.
Background is particularly important in an PET measurement. Since PET results in fewer photons being emitted, the S:B will change with state. If γ0 is the S:B in the absence of quenching then a state’s S:B will depend on the PET distance, ri as:
| (34) |
As a result background limits closest approach/highest quenching. This analysis includes Raman-type background. Accordingly states with short PET distances lose information because of increased dilution using Eq. 34 in Eq. 31 as well as due to the lifetime being comparable to the width of the IRF. The dilution causes an overall decrease in the the amount of mutual information with decreasing γ0, while the confounding effect of the IRF causes a shift of the maximum of mutual information to longer PET distances consistent with the results of Fig. 10(a).
The radiative rate (kr)and maximum electron transfer rate (k0) influence the mutual information by shifting the range of convenient distances over which PET distance changes can be detected. As kr increases the lifetime decreases and the the optimal range of β(r1 − r0) shifts to smaller dimensionless values because faster electron transfer rates are needed to make a measurable difference in the lifetime. The amount of information per photon also decreases with increasing kr due to the IRF. Changes in k0 behave the same a shift in r0. These effects are illustrated in the supplement.
Optimal electron transfer measurements require that the electron transfer rate be within approximately one order of magnitude of the natural excited state decay rate. Values too far outside this range will either completely quench the dye or cause a negligible change in its lifetime. As shown in Sec. III B 3, the instrumental response limits the fastest lifetimes observable. (This section uses a Gaussian IRF with w=100 ps for PET measurements.) The distance between the donor-acceptor pair and their quantum mechanical properties influence ket. The range of distances measurable depends on the location of the dye in the protein and the dynamics of the protein. The maximum electron transfer rate, k0, can be adjusted by choosing a dye-quencher pair with a different driving force and/or reorganization energy according to Eq. 32.
The exponential scaling parameter, β, depends on the structure of the protein between the donor and acceptor.[48, 50] This suggests that fluctuations in local secondary structure could be resolved through their influence on β. Finally, the location of the dye could be re-engineered if it was incorporated in a site-directed manner.
The unsensitized excited state decay rate, kr determines the optimal distances for the measurement. The rate at closest approach k0 also dictates the natural distances measured. At short distances the signal becomes difficult to distinguish from photobleaching except by the sojourn time. [2]
E. Resolution of FRET measurements
1. Lifetime measurement of FRET
Fluorescence resonant energy transfer is commonly used to determine structure and distances in single molecule measurements through the (R0/R)6 dependence of the energy transfer rate. TCSPC sojourn time information allows direct evaluation of the FRET efficiency Φx and distance R using:
| (35) |
where τx is the donor lifetime of the FRET-active species and τ0 is the lifetime of the donor in the absence of acceptor and R0 is the usual Förster radius.
The same formalism described in Sec. III A 1 can be applied to FRET. Using the reduced parameter description from Eq. 12, the efficiency, Φi, i ∈ {1, 2}, of the different states is:
2. Ratiometric vs. Full TCSPC
As discussed in Talaga (2006)[1] the intensity/interphoton part of the mutual information for a ratiometric single molecule FRET experiment can be formulated using a Bernoulli distribution for a single event and a binomial distribution for multiple events. The overall intensity in a FRET measurement only changes as a result of differences in donor and acceptor unsensitized quantum yields and detection efficiencies as can be see be examining the following expression:
where Φx is the FRET efficiency, kex is the rate of donor excitation, ϕdetd and ϕdeta are the donor and acceptor detector efficiencies, and ϕd and ϕa are the donor and acceptor quantum yields. Quantum yield and detection efficiency are mathematically equivalent in terms of their effect on the total intensity. When ϕaϕdeta − ϕdϕdetd == 0 there is no dependence of the total intensity/interphoton time on Φx. The relative intensity of donor and acceptor is taken into account by changing their relative weights in the joint probability distribution function. The TCSPC distribution depends on the source of the photon as illustrated in Fig. 14 so the formulation from Talaga (2006)[1] must include a conditional distribution for each type of photon weighted by the parameters that describe the system and the experimental conditions:
| (36) |
FIG. 14.
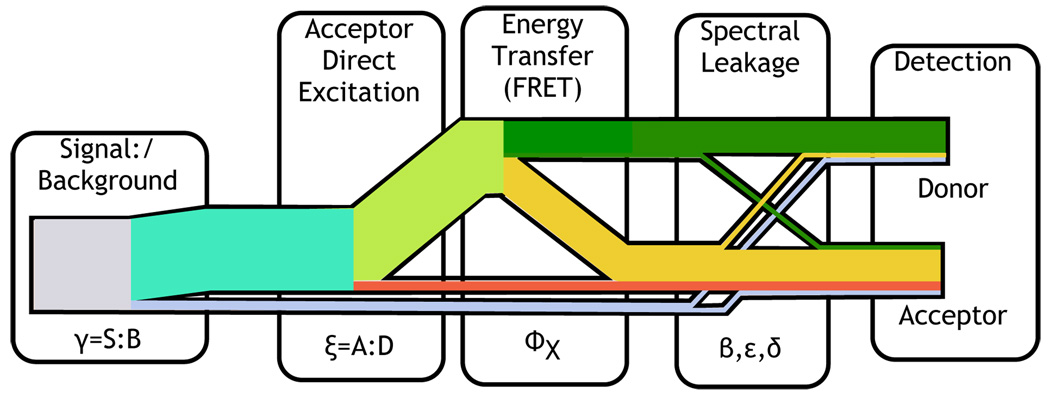
When cross-talk between channels is non-negligible, there are four contributions to the donor and acceptor channels: Directly-excited acceptor emission, FRET acceptor emission, donor emission, and background. These contributions appear in Eq. 36.
The parameters controlling the signal contributions are the signal-to-background ratio (γ), the acceptor:donor excitation ratio (ξ), the spectral leakage from the donor into the acceptor channel (ε), the spectral leakage from the acceptor into the donor channel (δ) with the directly excited acceptor decay, and the ratio of the background in the acceptor and donor channels (β). This distribution includes the information available from the channel intensity ratio and the lifetimes. The TCSPC signal contributions include decay from directly excited acceptors,
| (37) |
from acceptors excited by energy transfer,
| (38) |
from donors,
| (39) |
and from background,  b(t). (See Sec. IIIB4) Because this formulation is based on a photon-by-photon approach, the observable variables are slightly different than in the case of binned photons. The bnned approach gives the number of donor photons, the number of acceptor photons, the lifetime of donor, and the lifetime of acceptor. The interphoton approach gives a probability given the detected photon color (donor vs. acceptor) and the observed excited state sojourn time. The intensity ratio dependence is carried by relative weights of the detector probability. As discussed above, the absolute total intensity contains little or no information.
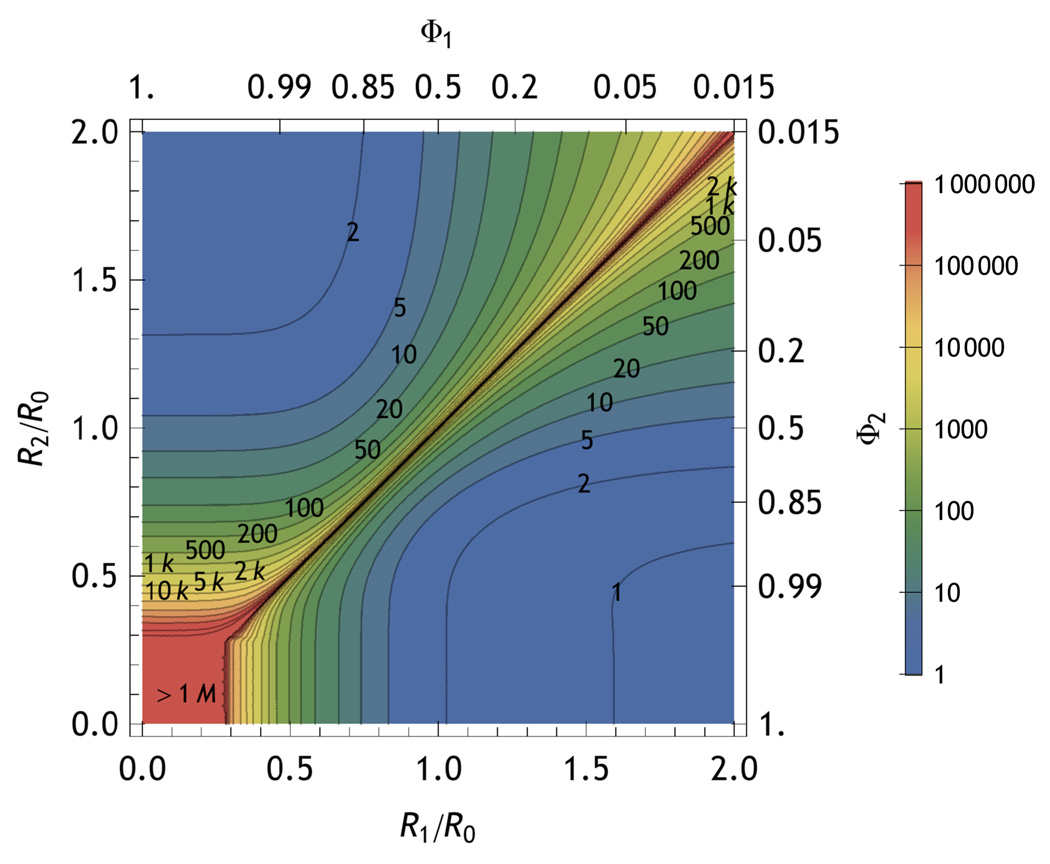
Fig. 15 compares the information obtained from the intensity-only ratiometric measurement and the full TCSPC measurement in terms of the number of photons required for p = 0.95 as discussed earlier. The full measurement typically more than doubles the information extracted from the photon stream. Inspection of Fig. 15 suggests that most of the useful range is within ∼30% of the Förster radius. This suggests that selection of the dye pair for an optimal R0 is the most important part of the experiment to optimize. This section assumes that the Förster radius remains unchanged between the two states. Many phenomena could alter R0, including changes in the averaged orientation of the dyes (κ2) and changes in the non-FRET non-radiative relaxation pathways of the dyes (quantum yield changes).
FIG. 15.
Contours of constant photon number as labeled on the figure that give  (𝕊, 𝕆) equivalent to 95% likelihood of distinguishing two states at FRET distances of R1/R0 and R2/R0. The contours above the diagonal include only the intensity information whereas those below the diagonal include both the interphoton time and the sojourn time information. Plot was generated for kr d=1/(10 ns),knra = knrd =1/(100 ns),kra1/(2 ns),
  (
( i)=1/2, w=100 ps, γ=10, β=1, ξ = δ = ε = 0
If the non-radiative rates knr a and knr d change with state, then additional information will be available from the interphoton times, otherwise all the state information available from the intensity is present in the count of photons in each channel. Note that a photon-by photon approach is still more favorable since it allows grouping constant numbers of photons which provides a more consistent amount of information per bunch than binning by time and also allows rebinning by different numbers of photons which allows one to vary the amount of information present in the bin.[28]
3. Donor and Acceptor contributions to total information
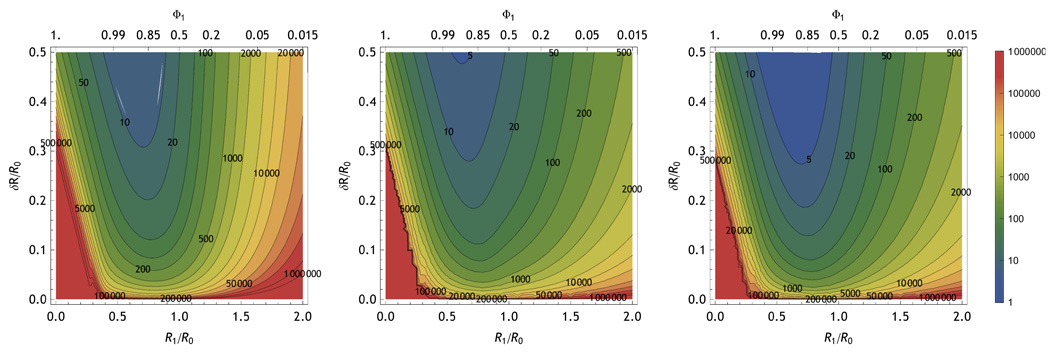
To obtain the information present only in the sojourn time part of the measurement, calculate the mutual information conditioned on the detector number. This is accomplished by marginalizing the distribution in Eq. 36 with respect to the TCSPC microtime, t and using the values obtained for each detector to normalize the conditional probabilities. Information about FRET is present in for the donor and acceptor TCSPC signals. However, the influence of FRET on the observed TCSPC distribution is different as seen in Eq. 37–Eq. 39. The donor gives more information per photon at longer distances but fewer photons. The acceptor gives more information per photon at shorter distances, but also fewer photons. By measuring both acceptor and donor, the maximum amount of information can be obtained across the entire range of distances. This is illustrated in Fig. 16 where the effective resolution is plotted on the vertical axis given a closest state shown on the horizontal axis. The shift in the per-photon marginal information of the donor vs. acceptor with position is visible when comparing the left and center panels. Once the intensity of the donor and acceptor are taken into account the full information is apparent in the right panel. The resolution limits for a given system depend on the position of the states with respect to the Förster radius and the number of photons available.
FIG. 16.
Contours of constant photon number as labeled on the figure that give  (𝕊, 𝕆) equivalent to 95% likelihood of distinguishing two states at FRET distances of R1/R0 and (R1 + δR)/R0. The left panel shows the contribution from donor photons, the center panel shows the contribution from acceptor photons, and the right panel shows contributions from both. Experimental parameters are the same as in Fig. 15
4. Optimizing FRET experiments
This section discusses how properties of the dyes and detection influence the information available. The information available from the FRET photon stream can be optimized by careful choice of detection filters and dyes as parameterized in Fig. 14. Contour plots showing the position of the two states are most useful when the details of the experiment such as the dyes being used, the detection leakage, etc. are already known and one is examining the range of detectable state changes. These plots are useful for determining the number of photons needed to make a measurement. When optimizing experimental parameters, such as those that depend on the choice of dye and dichroic filters, it is useful to plot a cut of the surface for several values of the parameter in question as the changes are easier to see on a 2-D line plot. (See supplement.)
The radiative rate of the donor, kr d, will influence the information available in a single molecule FRET measurement. The principle effect is on the amount of quenching, kx that can occur before the lifetime becomes comparable to the IRF. By contrast, increasing kr d dramatically reduces the acceptor contribution to the information and shifts the optimal position of R1 toward R0. The net effect is a decrease of total information with increasing kr d with the effect being more pronounced on the short-distance side of the distribution. The long-distance side of the distribution showed little effect. (See supplement.)
The natural radiative rate of the acceptor (kra) has no effect on the donor information. It does, however, make a difference in the acceptor part of the total mutual information. The the TCSPC distribution for the acceptor has a rising as well as a falling exponential contribution. Because the acceptor lifetime can appear as either the rise or the falling contribution to the TCSPC distribution depending on the exact value of the kra. When the donor and acceptor lifetimes are the same they swap and the exact FRET distance where this occurs depends on the difference in acceptor and the unquenched donor lifetimes. This effect on the acceptor contribution to the information is most noticeable when R1 < R0. The information in this region decreases as kra increases. The optimal position for R1 shifts toward R0 as kra increases while the total information decreases.
Background (γ) principally acts to dilute the information present in the photon stream as discussed in Sec. III B 4. For background that resembles the IRF there is little effect other than dilution. For other sources of background the effect will be more pronounced as was illustrated in Fig. 10(c).
In interphoton-time-only experiments, direct excitation of the acceptor (ξ) reduces the system information by a small amount, but can be greatly beneficial in allowing acceptor dark states to be distinguished from low-FRET states.[1] The same principle holds for full TCSPC measurements. The principal effect of ξ on full TCSPC measurements is to dilute the information content of the acceptor since direct acceptor excitation contains no information about the energy transfer. When dark acceptors and donors are significant, a small amount of information dilution is worth the ability to identify them.
The presence of spectral leakage (ε, δ) mixes the sojourn time signals from the two dyes. This behaves somewhat like a fluorescent source of background in terms of loss of information. However, the leaked distribution changes with the state so, unlike in purely ratiometric intensity-based experiments, there is still information present in the TCSPC distribution even when the leakage parameters approach 50%. Leakage of the acceptor contribution into the donor channel, δ, has a much greater effect than the opposite leakage, ϵ. The effect of δ on the total mutual information was 3–4 times that of ϵ. (See supplement.)
F. Position in beam
As a molecule passes through the focus of a single molecule microscope (either due to scanning or diffusion) no only does the intensity vary, but also the shape of the TCSPC curve. This is reflected in a position-dependent γ that depends on the distance from the optical axis in cylindrical coordinates, ρ for a molecule rapidly reorienting and confined to the focal plane. To write down γ as a function of the position in the beam, assume a circular Gaussian beam intensity profile with width wρ. Using
| (40) |
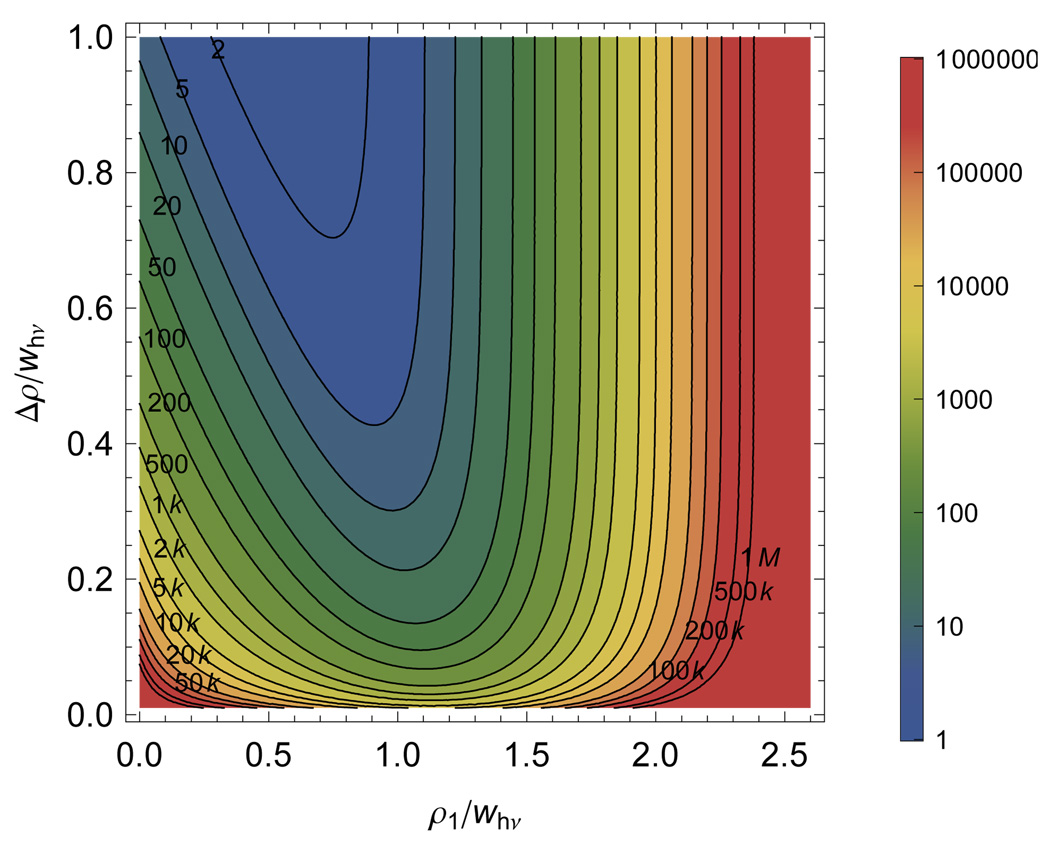
in Eq. 30 allows calculation of the information present when attempting to resolve the distance from the optical axis. This suggests that additional information about the position of the particle in the radiation field is available from TCSPC when the lifetime of the molecule is long compared to the temporal resolution of the instrument when the background is primarily due to prompt (∼ δ–function) processes such as Raman scattering. This additional information arises because only the photons arriving during same window as the prompt background are corrupted.
IV. CONCLUSIONS
This paper derived the information theoretical formulas required to analyze TCSPC-based single molecule luminescence lifetime measurements. It then showed how information theory can be used to evaluate the TCSPC instrumentation including digitization and instrumental response to a finite impulse. It showed how the effect of background on the information content depends upon the lifetime of the source of the background. Information theory shows why the source of the background photons can make a very significant difference on TCSPC measurements. Luminescent background with lifetimes comparable to those being measured is particularly harmful. By contrast, uncorrelated background needs to be present at extremely high levels to begin to corrupt the measurement. The source of the background is irrelevant when measuring only intensity.[1] These formulas were applied to several common types of single molecule TCSPC measurements including resolution of spectrally identical dyes, photoinduced electron transfer, fluorescence resonant energy transfer, and sub-diffraction dye localization.
The information theory analysis was able to take qualitative ideas about experimental design and show how to make them quantitative. Information theory provides new insight into the importance of the lifetime of the dyes in terms of the resolution of FRET experiments. Information theory showed that spectral leakage in a FRET measurement is more detrimental when the acceptor leaks into the donor channel, providing a principle for dichroic mirror choice when the donor and acceptor fluorescence spectra have substantial overlap.
Extension to more complicated cases is straightforward from what was illustrated in this paper.
Supplementary Material
FIG. 1.
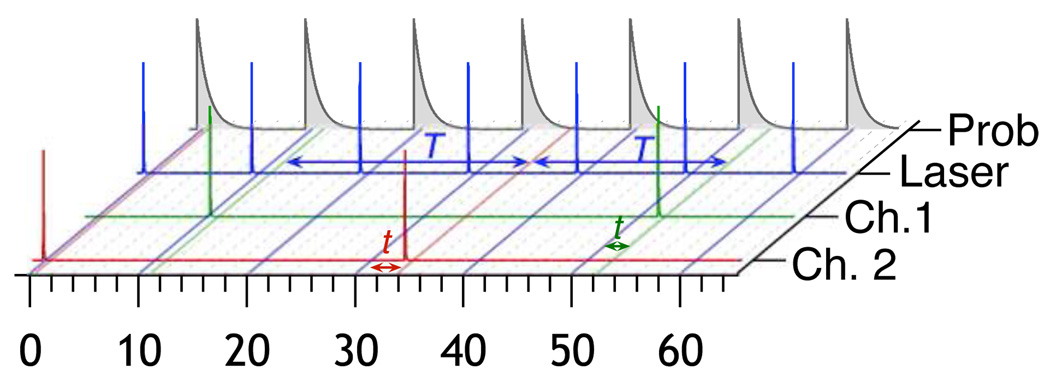
This figure illustrates the basic concept of time correlated single photon counting. The blue trace represents the intensity of the laser excitation pulses. The green and red traces represent the arrival of photons at different detectors that are resolved using a dichroic mirror. The gray decay functions represents the probability density for photon emissision. t is the excited state sojourn time (microtime) controlled by the lifetime and T is the interphoton time (macrotime) related to the total emission intensity. An information theoretical analysis of two-channel macrotime measurements has been previously published.[1]
FIG. 17.
Contours of constant photon number as labeled on the figure that give  (𝕊, 𝕆) equivalent to 95% likelihood of distinguishing two positions in a Gaussian excitation beam. The contours above the diagonal include the effects of a 100 ps Gaussian instrument response whereas those below the diagonal include a 100 ps Gaussian IRF.
ACKNOWLEDGMENTS
This work was supported by grant #R01GM071684 from the National Institutes of Health (USA).
Footnotes
References
- 1.Talaga DS. J. Phys. Chem. A. 2006;110:9743. doi: 10.1021/jp062192b. [DOI] [PMC free article] [PubMed] [Google Scholar]
- 2.Messina TC, Kim H, Giurleo JT, Talaga DS. J. Phys. Chem. B. 2006;110:16366. doi: 10.1021/jp063367k. [DOI] [PMC free article] [PubMed] [Google Scholar]
- 3.Rigler R, Edman L, Foldes-Papp Z, Wennmalm S. Springer Series in Chemical Physics. 2001;67:177. [Google Scholar]
- 4.Basche T, Nie S, Fernandez JM. Proc. Natl. Acad. Sci. U. S. A. 2001;98:10527. doi: 10.1073/pnas.191365898. [DOI] [PMC free article] [PubMed] [Google Scholar]
- 5.Moerner WE. J. Phys. Chem. B. 2002;106:910. [Google Scholar]
- 6.Moerner WE, Fromm DP. Rev. Sci. Instrum. 2003;74:3597. [Google Scholar]
- 7.Kulzer F, Orrit M. Annu. Rev. Phys. Chem. 2004;55:585. doi: 10.1146/annurev.physchem.54.011002.103816. [DOI] [PubMed] [Google Scholar]
- 8.Michalet X, Weiss S, Jaeger M. Chem. Rev. (Washington, DC, U. S.) 2006;106:1785. doi: 10.1021/cr0404343. [DOI] [PMC free article] [PubMed] [Google Scholar]
- 9.Deniz AA, Mukhopadhyay S, Lemke EA. J. R. Soc. Interface. 2008;5:15. doi: 10.1098/rsif.2007.1021. URL http://www.journals.royalsoc.ac.uk/content/0x116338np247206/fulltext.html. [DOI] [PMC free article] [PubMed]
- 10.Walter NG, Huang C-Y, Manzo AJ, Sobhy MA. Nat. Methods. 2008;5:475. doi: 10.1038/nmeth.1215. [DOI] [PMC free article] [PubMed] [Google Scholar]
- 11.Kuhnemuth R, Seidel CAM. Single Molecules. 2001;2:251. [Google Scholar]
- 12.Moerner WE. Science (Washington, D. C.) 1997;277:1059. [Google Scholar]
- 13.Enderlein J, Robbins DL, Ambrose WP, Keller RA. J. Phys. Chem. A. 1998;102:6089. [Google Scholar]
- 14.Enderlein J, Robbins DL, Ambrose WP, Goodwin PM, Keller RA. Bioimaging. 1997;5:88. URL http://dx.doi.org/10.1002/1361-6374(199709)5:3<88::AID-BIO2>3.0.CO;2-2.
- 15.Jia Y, Talaga DS, Lau WL, Lu HSM, DeGrado WF, Hochstrasser RM. Chem. Phys. 1999;247:69. [Google Scholar]
- 16.Talaga DS, Lau WL, Roder H, Tang J, Jia Y, DeGrado WF, Hochstrasser RM. Proc. Natl. Acad. Sci. U. S. A. 2000;97:13021. doi: 10.1073/pnas.97.24.13021. [DOI] [PMC free article] [PubMed] [Google Scholar]
- 17.Haran G. Chem. Phys. 2004;307:137. [Google Scholar]
- 18.Yang H, Xie XS. J. Chem. Phys. 2002;117:10965. [Google Scholar]
- 19.Watkins LP, Yang H. J. Phys. Chem. B. 2005;109:617. doi: 10.1021/jp0467548. [DOI] [PubMed] [Google Scholar]
- 20.Andrec M, Levy RM, Talaga DS. J. Phys. Chem. A. 2003;107:7454. doi: 10.1021/jp035514+. [DOI] [PMC free article] [PubMed] [Google Scholar]
- 21.Talaga DS, Jia Y, Bopp MA, Sytnik A, DeGrado WA, Cogdell RJ, Hochstrasser RM. Springer Ser. Chem. Phys. 2001;67:313. [Google Scholar]
- 22.Wang J, Wolynes P. J Chem Phys. 1999;110:4812. URL http://apps.isiknowledge.com/InboundService.do?product=WOS&action=retrieve&SrcApp=Papers&UT=000078831900018&SID=2EjI4Ai4K6Na8jhNek1&SrcAuth=mekentosj&mode=FullRecord&customersID=mekentosj&DestFail=http%253A%252F%252Faccess.isiproducts.com%252Fcustom_images%252Fwok_failed_auth.html.
- 23.Cao J, Silbey RJ. J Phys Chem B. 2008;112:12867. doi: 10.1021/jp803347m. URL http://pubs.acs.org/doi/abs/10.1021/jp803347m. [DOI] [PubMed]
- 24.Brown F. Accounts Chem Res. 2006;39:363. doi: 10.1021/ar050028l. [DOI] [PubMed] [Google Scholar]
- 25.Sung J, Silbey R. Chemical Physics Letters. 2005;415:10. URL http://www.sciencedirect.com/science?_ob=ArticleURL&_udi=B6TFN-4H4T0YJ-5&_user=526750&_rdoc=1&_fmt=&_orig=search&_sort=d&view=c&_acct=C000023759&_version=1&_urlVersion=0&_userid=526750&md5=6d554d645e3a3ed9527366096bf0b1bf.
- 26.Zheng Y, Brown F. Phys. Rev. Lett. 2003;90:238305. doi: 10.1103/PhysRevLett.90.238305. URL http://prola.aps.org/abstract/PRL/v90/i23/e238305. [DOI] [PubMed]
- 27.Kalinin S, Felekyan S, Antonik M, Seidel CAM. J Phys Chem B. 2007;111:10253. doi: 10.1021/jp072293p. URL http://pubs.acs.org/doi/abs/10.1021/jp072293p. [DOI] [PubMed]
- 28.Watkins LP, Yang H. Biophys. J. 2004;86:4015. doi: 10.1529/biophysj.103.037739. [DOI] [PMC free article] [PubMed] [Google Scholar]
- 29.Hanson JA, Yang H. J Chem Phys. 2008;128:214101. doi: 10.1063/1.2931943. URL http://scitation.aip.org/getabs/servlet/GetabsServlet?prog=normal&id=JCPSA6000128000021214101000001&idtype=cvips&gifs=yes. [DOI] [PMC free article] [PubMed]
- 30.Yang H, Xie XS. Chem. Phys. 2002;284:423. [Google Scholar]
- 31.Becker W, Bergmann A. Rev. Fluoresc. 2005;2:77. [Google Scholar]
- 32.Lakowicz JR. Principles of Fluorescence Spectroscopy. New York: Springer; 1999. [Google Scholar]
- 33.Kreiter M, Prummer M, Hecht B, Wild UP. J. Chem. Phys. 2002;117:9430. [Google Scholar]
- 34.MacKay D. Information Theory, Inference, and Learning Algorithms. Cambridge, U.K.: Copyright Cambridge University Press; 2005. [Google Scholar]
- 35.Jaynes ET. Probability Theory: The Logic of Science. Cambridge: Cambridge univ. Press; 2003. [Google Scholar]
- 36.Jones DS. Elementary Information Theory. Oxford: Oxford University Press; 1979. [Google Scholar]
- 37.Shannon CE, Weaver W. The Mathematical Theory of Communication. Univ. of Illinois Press; 1949. [Google Scholar]
- 38.Jaynes ET. Physical Review. 1957;106:620. [Google Scholar]
- 39.Jaynes ET. Annu. Rev. Phys. Chem. 1980;31:579. arthur Holly Compton Lab. Phys., Washington Univ., St. Louis, MO, USA. [Google Scholar]
- 40.Gull S. Maximum-Entropy and Bayesian Methods in Science and Engineering: Volume 1: Foundations. New York: Springer; 1988. pp. 53–73. chap. Bayesian inductive inference and maximum entropy. [Google Scholar]
- 41.Levine R, Kinsey J. Information Theory Approach to Molecular Collisions in Atom-Molecule Collision Theory: a Guide for the Experimentalist. New York: Plenum; 1978. pp. 693–750. [Google Scholar]
- 42.Fisher R. Proceedings of the London Mathematica Society. 1928;30:199. [Google Scholar]
- 43.Köllner M, Wolfrum J. Chemical Physics Letters. 1992;1,2:199. [Google Scholar]
- 44.Rech I, Luo G, Ghioni M, Yang H, Xie X, Cova S. Ieee J Sel Top Quant. 2004;10:788. URL http://ieeexplore.ieee.org/search/wrapper.jsp?arnumber=1343965.
- 45.Zander C, Sauer M, Drexhage K-H, Wolfrum J, Brand L, Eggeling C, Seidel CA. Proceedings of SPIE-The International Society for Optical Engineering. 1997:2980. (Advances in Fluorescence Sensing Technology III 2980, 107 (1997). [Google Scholar]
- 46.Neuweiler H, Sauer M. Curr. Pharm. Biotechnol. 2004;5:285. doi: 10.2174/1389201043376896. [DOI] [PubMed] [Google Scholar]
- 47.Marme N, Knemeyer J, Sauer M, Wolfrum J. Bioconjugate Chem. 2003;14:1133. doi: 10.1021/bc0341324. URL http://pubs.acs.org/doi/abs/10.1021/bc0341324. [DOI] [PubMed]
- 48.Gray HB, Winkler JR. Proc. Natl. Acad. Sci. U. S. A. 2005;102:3534. doi: 10.1073/pnas.0408029102. [DOI] [PMC free article] [PubMed] [Google Scholar]
- 49.Marcus N, Sutin RA. Biochimica et Biophysica Acta, Reviews on Bioenergetics. 1985;811:265. [Google Scholar]
- 50.Shin Y-GK, Newton MD, Isied SS. J. Am. Chem. Soc. 2003;125:3722. doi: 10.1021/ja020358q. [DOI] [PubMed] [Google Scholar]
Associated Data
This section collects any data citations, data availability statements, or supplementary materials included in this article.


