Abstract
Elevations in branched chain amino acids (BCAAs) in human obesity were first reported in the 1960s. Such reports are of interest because of the emerging role of BCAAs as potential regulators of satiety, leptin, glucose, cell signaling, adiposity and body weight (mTOR and PKC). To explore loss of catabolic capacity as a potential contributor to the obesity-related rises in BCAAs, the first two enzymatic steps catalyzed by mitochondrial branched chain amino acid aminotransferase (BCATm), branched chain α-keto acid dehydrogenase (BCKD, E1α subunit) complex were assessed in two rodent models of obesity (ob/ob mice and Zucker rats) and after surgical weight loss intervention in humans. Obese rodents exhibited hyperaminoacidemia including BCAAs. Whereas no obesity-related changes were observed in rodent skeletal muscle BCATm, pS293 or total BCKD E1α or BCKD kinase, in liver, BCKD E1-α was either unaltered or diminished by obesity, and pS293 (associated with the inactive state of BCKD) increased, along with BCKD kinase. In epididymal fat, obesity-related declines were observed in BCATm and BCKD E1α. Plasma BCAAs were diminished by an overnight fast coinciding with dissipation of the changes in adipose tissue, but not liver. BCAAs were also reduced by surgical weight loss intervention (Roux-en-Y gastric bypass) in human subjects studied longitudinally. These changes coincided with increased BCATm and BCKD E1α in omental and subcutaneous fat. Our results are consistent with the idea that tissue specific alterations in BCAA metabolism, in liver and adipose tissue but not muscle, may contribute to the rise in plasma BCAAs in obesity.
Keywords: Obesity, branched chain amino acids, mitochondrial branched chain amino acid transaminase (BCATm), branched chain keto acid dehydrogenase, branched chain keto acid dehydrogenase kinase, ob/ob mice, diet induced obesity, Zucker rats, bariatric surgery, humans
Introduction
Plasma concentrations of branched chain amino acids (BCAAs) are elevated in humans and animal models of obesity (4, 11, 12, 31, 37, 46, 48, 52, 56). While the plasma levels of other amino acids may also change in obesity, the rises in the BCAAs are of particular interest because they appear to have unique obesity related effects. Indeed it has been posited that BCAAs may be responsible for some of the beneficial effects of high protein diets, improving body weight control and adiposity (1, 9, 18, 29, 30, 39). Similarly, BCAAs improve muscle glucose uptake, whole body glucose metabolism and oxidation (7, 8, 43). Further, they have been shown to regulate leptin secretion from fat and food intake at the level of the hypothalamus via mTOR signaling, which has also been implicated in obesity (6, 13, 28, 32, 34, 47). Finally, rises in plasma BCAAs due to a block in BCATm have been also associated with improvements in glucose tolerance and resistance to diet induced obesity (50).
Consequently an improved understanding of the mechanism(s) underlying obesity-related rises in BCAAs is important. BCAAs might be elevated simply because obese individuals eat more food, however in humans, rises in BCAAs are still seen after an overnight fast (11, 12). Another potential explanation for the rise in BCAAs in obesity is increased protein catabolism secondary to insulin resistance. Jensen and Haymond (26) reported that proteolysis is elevated in moderate upper body obesity, and that insulin’s antiproteolytic action is impaired. Luzi et al (33) also concluded that the increased proteolysis in obesity was a result of impaired anti-proteolytic action of insulin. An idea, which has received less attention, is that a reduction in BCAA metabolism might be involved (31). In lean animals, BCAA metabolism is highly regulated by changes in cellular BCAA concentrations due to alterations in dietary intake (20, 51). Studies in transgenic mice with disruption of mitochondrial branched chain amino aminotransferase (BCATm) or branched chain α-keto acid dehydrogenase kinase (BCKD kinase) support the idea that dysregulation of BCAA metabolism results in sustained changes in plasma BCAA concentrations (27, 50). Furthermore, in other nutritional states in which BCAAs are elevated, such as starvation or protein malnutrition, BCAA metabolism and proteolysis may both contribute to changes in BCAAs (20, 51). Given the robust regulation and capacity of the BCAA metabolic pathway, it seems unlikely that a rise in the plasma concentration of BCAAs, (e.g., due to increased proteolysis or food intake) in obesity could be sustained in the absence of some alteration in BCAA disposal. In support of this idea, microarray studies have suggested that mRNA for enzymes involved in BCAA metabolism in adipose tissue are depressed in mutant or transgenic animals with an obese phenotype (21, 40).
The current study examines the possibility that key enzyme components of BCAA metabolism are altered in obesity. We examined the first two steps in the catabolic pathway catalyzed by the BCATm and branched chain α-keto acid dehydrogenase (BCKD) enzyme complex. BCATm catalyzes the first step of BCAA metabolism in the mitochondrial matrix in most tissues outside the central nervous system (54). It transfers the amino group of a BCAA to α-ketoglutarate to form glutamate and the corresponding branched chain α-keto acid, for example α-ketoisocaproate (KIC) from leucine. This reaction is rapid and of high capacity in muscle and fat. The second step is regulated by the BCKD complex. The complex catalyzes oxidative decarboxylation of the branched chain α-keto acids forming the branched chain acyl-CoA derivatives, CO2, and NADH. The multicomponent enzyme complex contains three enzymes, an associated kinase and phosphatase (19). E1 catalyzes oxidative decarboxylation of the branched chain α-keto acids and has an α2β2 structure with a covalently bound thiamine pyrophosphate cofactor. E2 is the dihydrolipoyl transacylase; and E3 is a flavin-linked dihydrolipoyl dehydrogenase that is not unique to the BCKD complex (19). Because BCATm is not expressed in rodent liver, BCAAs from dietary protein bypass first metabolism in liver. This may contribute to the sharp rise of plasma leucine in response to a meal, thereby promoting leucine signaling in peripheral tissues that respond to leucine (34). BCKD kinase phosphorylates the E1α subunit of BCKD at two sites, termed sites 1 and 2 (45). Site-directed mutagenesis studies (60) have shown that phosphorylation at site 1 [rat E1α Ser293 (S293α)] inhibits BCKD activity. The importance of BCKD kinase in the regulation of BCKD was recently demonstrated in BCKD kinase knockout mice in which BCKD activity and BCAA catabolism were elevated in all tissues except liver; and BCAA concentrations in plasma and various tissues were markedly decreased (27). Changes in the expression of the hepatic BCKD kinase occur in metabolic states associated with changes in dietary protein intake or plasma thyroid hormone concentrations (19).
To examine the potential role of BCAA metabolism in obesity associated elevations in plasma BCAAs, BCATm and/or BCKD complex concentrations and BCKD E1α phosphorylation status were examined in muscle, liver and fat from obese rodents. We also examined these enzymes in visceral and subcutaneous adipose tissue from morbidly obese humans before and after a weight loss intervention, gastric bypass surgery. The results are consistent with the hypothesis that alterations in BCAA metabolism in liver and adipose tissue may contribute to the rise in BCAAs in obesity
Materials and Methods
Animals and human subjects
All animal experiments were reviewed and approved by the Animal Care and Use Committee at the Pennsylvania State University College of Medicine and adhered to the National Institutes of Health guidelines for the care and use of experimental animals. Mice (ob/ob, lean controls, and C57BL/6J) were purchased from Jackson Laboratory. Zucker fatty and lean control rats were purchased from Charles River Laboratory. Animals were housed in the Penn State College of Medicine animal facility with an ambient temperature of 21 to 23°C on a 12-hour light/dark cycle and given free access to water and a rodent chow diet (Harland Teklad 2018, Madison, Wisconsin). For diet-induced obesity, 5-week old C57BL/6J mice were fed a 60% high fat diet (D12492, Research Diets, New Brunswick, NJ) for 11 weeks. Tissues were obtained from freely fed or overnight fasted animals that were euthanized with pentobarbital (100–150 mg/kg) and clamped between plates cooled to the temperature of liquid nitrogen.
Anonymous human tissue samples were obtained from the PA Department of Health obesity tissue bank. Recruitment of the subjects and operation of the tissue bank is approved by the College of Medicine Institutional Review Board. Plasma and adipose tissue (subcutaneous and omental) samples were obtained for male and female subjects who underwent open gastric bypass surgery for treatment of morbid obesity (Table 1). Informed consent was obtained from these subjects before surgery. Subjects were N.P.O. after midnight the day before surgery and tissue collection. Two samples were collected from each subject, one at the initial bariatric surgery, the other, in a smaller number of subjects, at a second surgical procedure performed an average of 17 months after the first surgery. The second surgery was medically necessary for hernia repair, gall bladder disease or excess skin removal.
Table 1.
Body and organ weights, and plasma concentration of insulin and metabolites in ob/ob mice
| Lean | ob/ob | percent change | |
|---|---|---|---|
| Body wt (g) | 28.9 ± 0.6 | 48.5 ± 0.7*** | 68% |
| Gastrocnemius wt (g) | 0.34 ± 0.01 | 0.27 ± 0.01*** | −22% |
| Epididymal fat wt (g) | 0.46 ± 0.03 | 3.53 ±0.14*** | 667% |
| Liver wt (g) | 1.13 ± 0.04 | 2.78 ± 0.09*** | 146% |
| Heart (g) | 0.16 ±0.00 | 0.15 ± 0.00* | −6% |
| Fed blood glucose (mg/dl) | 178 ± 10 | 237 ±39 | ns |
| Fasting plasma insulin (ng/ml) | 0.41 ± 0.04 | 4.0 ± 0.81*** | 876% |
| Fasting BUN (mg/dl) | 19.0 ± 1.5 | 19.6 ± 0.7 | ns |
Values are means ± SE.
p < 0.05,
p < 0.001 compared with lean mice; ns donates not significant, n=8/group. Body and organ weights are values after an overnight fast. BCAAs were measured by the
BCAT and BCKD enzyme activity assays
Frozen powdered adipose tissue was suspended in buffer (1 g/3 ml extraction buffer) containing 25 mM HEPES (pH 7.4), 0.4% CHAPS, 1 mM EDTA, 1 mM EGTA, 1 mM dithiothreitol and protease inhibitors (53). The tissues suspension was subjected to freeze-thaw sonication and centrifuged at 10,000 × g for 30 min. The supernatant was assayed for BCAT activity as described previously (23). Briefly, activity was measured at 37°C in 25 mM potassium phosphate buffer, pH 7.8, which contained 50 μM pyridoxal phosphate, 5 mM DTT, 12 mM isoleucine and 1 mM α-keto [1-14C] isovalerate. A unit of activity was defined as 1 μmol valine formed/min at 37°C. Tissue extraction and BCKD activity were carried out as described previously (41). BCKD complex was precipitated from whole tissue extracts using 9% polyethylene glycol. BCKD activity was determined spectrophotometrically by measuring the rate of NADH production resulting from the conversion of α-ketoisovalerate to isobutyryl CoA. A unit of enzyme activity was defined as 1 μmol NADH formed/min at 30°C. BCKD activity was confirmed by the radioactive assay, which measured 14CO2 release from 3-keto [1-14C] isovalerate. A unit of activity was defined as 1 μmol 14CO2 formed/min at 30°C.
Western blot analysis
Equivalent weights of frozen powdered liver, muscle or adipose tissues were homogenized on ice using a Polytron in either 3 (adipose tissue) or 7 volumes of a phospho-preserving homogenization buffer. The components of that buffer (in mM) were: 20 HEPES, pH 7.4 (buffer pH adjusted with 1 or 10 mM NaOH); 2 EGTA; 50 NaF; 100 KCl; 0.2 EDTA, pH 7.4; 50 β-glycerophosphate; 0.1 4-(2-aminoethyl) benzenesulfonyl fluoride HCL (AEBSF), 1 benzamidine, 0.5 sodium vanadate, 1 M microcystin LR, 0.4% 3-[(3-cholamidopropyl) dimethylammonio]-1-propanesulfonate (CHAPS), and 1% Triton X-100. The homogenate was centrifuged at 10,000 g for 10 min at 4°C. An aliquot of the supernatant was reserved for protein assay using the BCA protein assay kit (Pierce, Rockford, IL), and the rest was added to an equal volume of 2 or 5× Laemmli sodium dodecyl sulfate (SDS) sample buffer. After assaying the protein concentration in the homogenates, equal amounts of protein were then electrophoresed on Tris·HCl gels and proteins transferred to PVDF membranes. Western blots of the transferred proteins were conducted as previously described (35, 54). Densitometric analysis of immunoblots was performed using NIH Image J. The antibodies against BCATm (41.7 kDA), total BCKD E1 (45.5 kDA), and phospho- [C-YRIGHH- (phospho-Ser)-TSDDSS] peptide corresponding to phosphorylation site 1 on the E1α subunit of BCKD E1 (45.5 kDA) were generated and characterized as previously described (35, 54). To determine pS293/E1α ratios when the amount of E1α was found to be significantly different between conditions, the samples were re-electrophoresed and analyzed by loading approximately the same amount of total BCKD E1α on the SDS-PAGE gels. Resulting blots were immunoblotted for pS293 immunoreactivity followed by stripping and reprobing for total E1α. BCKD kinase (46.1 kDA) was monitored with previously described polyclonal antibodies (53) and with monoclonal antibodies; the latter being a generous gift from Dr Yoshiharu Shimomura (Nagoya Institute of Technology, Nagoya, Japan). Loading control antibodies were to β-Actin (42 kDa, Sigma Aldrich, St Louis) and tubulin (55 kDa, Thermoscientific, Freemont, CA).
Analytical procedures
Plasma BCAA concentrations were measured using either an enzymatic spectrophotometric assay as described by Beckett (2) or as part of a complete amino acid determination using an HPLC coupled fluorometric method (57). For the spectrophotometric assay, bacterial Leucine dehydrogenase (Toyobo, New York, NY) was used to catalyze the oxidation of BCAAs. Production of NADH was measured at 340 nm using a spectrophotometer.
For the HPLC assay of amino acids, the method described by Wu and Knabe (57) was used. Plasma and muscle samples were deproteinized with 1.5 M HClO4 and neutralized with 2 M K2CO3 (vol/vol 1:1:0.5). Prior to amino acid analysis, 0.1 ml of the neutralized plasma extract was mixed with 0.1 ml of a 1.2% benzoic acid solution (prepared with saturated K2B4O7) and brought to a total volume of 1.6 ml with HPLC grade H2O. Standards were subjected to the same protocol with final concentrations ranging from 0.01 nmol/ml–1.875 nmol/ml. The sample solution (25 μl) was mixed with 25 μl of o-phthaldialdehyde (OPA) reagent (50 mg of o-phthaldialdehyde in 1.25 ml of methanol to which 11.2 ml of 0.04 M sodium borate buffer, pH 9.5, 50 μl of mercaptoethanol, and 0.4 ml of Brij-35 were added). After mixing, the solution was incubated for 2 minutes in the WATERS 2695 HPLC system before injection and separation of the o-phthaldialdehyde derivatives. Separation was made by gradient elution from a Supelcosil™ LC-18 column (15cm × 4.6 mm, 3μM) (Sigma) with a mobile phase of 86% solvent A (0.1 M sodium acetate, pH 7.2, containing 9% methanol and 0.5% tetrahydrofuran) and 14% of solvent B (100% methanol). The gradient used excitation and emission wavelengths are described in (57). Detection was made with a JASCO FP-152 detector
Blood glucose was measured using an OneTouch Ultra glucometer (Lifescan/Johnson & Johnson Company, Milpitas, California). Plasma insulin concentrations were measured using human, rat or mouse insulin specific ELISA kits (ALPCO Diagnostics, Salem NH) as appropriate for the species. Plasma Urea was measured using the Vitros Chemistry System (DT60 II and DTSc II modules; Ortho-Clinical Diagnostics, Rochester, NY).
Statistical analysis
Initial studies compared nutritional states separately; that is, fed and fasted data were initially derived from two separate blots at different times. However some differences in the regulation of endpoints between the fed and fasted states made it necessary to reanalyze stored samples together on the same blots, where possible. To compare them together, the remaining samples were electrophoresed on the same blot and reanalyzed together, however there was insufficient material to rerun all of the ob/ob samples. In that case, the original data are shown for those endpoints and a two-tailed Student t-test was used to compare the lean and obese states only (p< 0.05 was taken as showing statistical significance). The other reanalyzed samples were compared between lean and obese as well as nutritional status using an ANOVA, followed automatically, when statistical differences were observed, with a Student-Newman-Keuls Multiple Comparisons post-test (Values are means ± SE; and p < 0.05 was considered significantly different). The statistical analyses were conducted using Prism and Instat computer programs (Graphpad Software, San Diego, CA).
Results
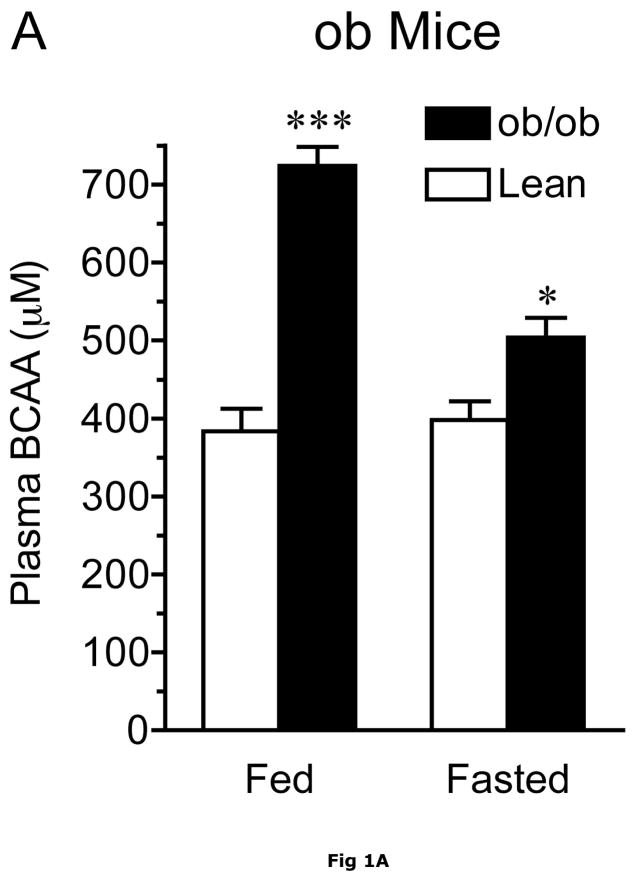
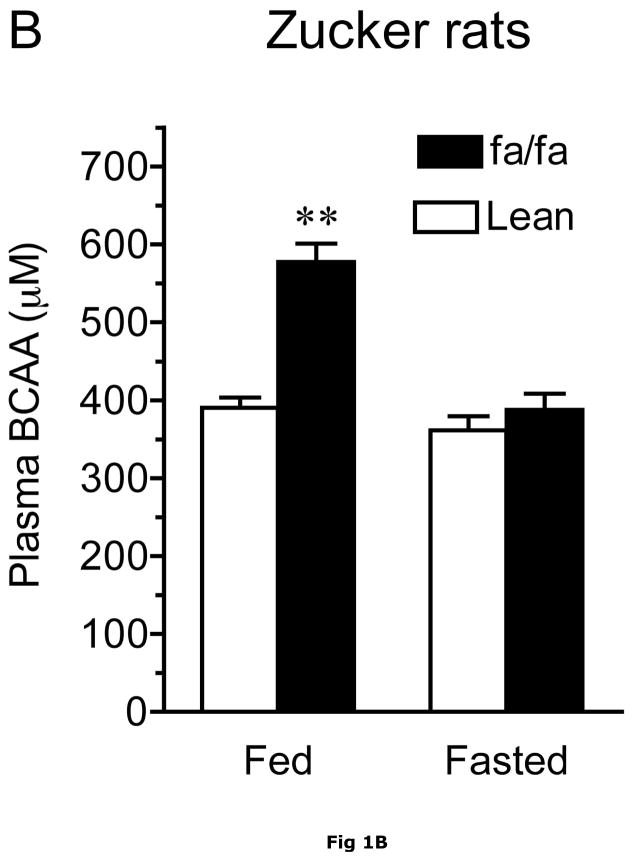
At 13–14 weeks of age, ob/ob mice exhibited severe obesity compared to their lean counterparts. This was reflected in their body, epididymal fat pad and liver weights which were 1.7-, 8-and 2.5-fold greater, respectively, than lean animals (Table 1). In addition, their gastrocnemius muscle and heart weights were significantly diminished. As shown by the ~10-fold increase in fasting plasma insulin concentrations, the obese ob/ob mice also had severe insulin resistance (Table 1). Plasma BCAAs measured by either the spectrophotometric or HPLC methods were elevated in the postabsorbtive state, however the differences tended to decline with food deprivation in ob/ob mice and Zucker rats (Fig. 1A and Table 2). Thus, when compared to control lean animals, combined plasma BCAA concentrations were 89% and 26% higher in the postabsorptive (blood collected at ~10 a.m. in random fed animals) and overnight fasted animals, respectively (Fig 1A). In agreement with a previous report (46), total BCAA concentrations were 48% higher in fed obese Zucker rats when compared to Zucker lean rats (Figure 1B). Plasma BCAA concentrations were greatly depressed by overnight food-deprivation, and were not statistically different after an overnight fast.
Fig. 1. Effect of obesity on plasma BCAA concentrations.
Plasma BCAAs were measured using the spectrophotometric assay. Panel A. Random fed (fed) and overnight food-deprived (fasted) plasma BCAA concentrations in 13-week old ob/ob male and age-matched lean control mice fed a normal chow diet. Asterisks indicate, *p < 0.05, ***p < 0.001, compared to control in the same nutritional state, n=8/group. Panel B. Random fed (fed) and overnight food-deprived (fasted) plasma BCAA concentrations in ~13 week old Zucker fatty and age-matched lean control rats. Asterisks indicate, **p < 0.01, vs. lean controls in the same nutritional state, n=10/group.
Table 2.
Plasma amino acid concentrations (μM) in lean and ob/ob mice
| Fed |
Fasted |
|||||
|---|---|---|---|---|---|---|
| lean | ob/ob | lean | ob/ob | |||
| ASP | 12.4 ± 1.3 | 14.1 ± 1.2 | ns | 9.7 ± 0.7 | 11.7 ± 1.0 | ns |
| GLU | 46.3 ± 5.1 | 62.5 ± 7.6 | ns | 32.8 ± 2.7 | 59.5 ± 6.9** | 81% |
| ASN | 41.7 ± 2.3 | 54.8 ± 4.0** | 31% | 55.5 ± 4.3 | 42.7 ± 2.1* | −23% |
| SER | 117.8 ± 4.8 | 152.6 ± 12.2* | 30% | 122.2 ± 12.1 | 98.9 ± 2.8 | ns |
| GLN | 606.7 ± 35.2 | 614.9 ± 17.1 | ns | 640.7 ± 38.9 | 671.7 ± 13.8 | ns |
| HIS | 60.2 ± 3.2 | 72.7 ± 5.4 | ns | 67.8 ± 8.3 | 55.3 ± 5.6 | ns |
| GLY | 253.8 ± 14.8 | 210.2 ± 22.3 | ns | 242.1 ± 16.5 | 164.0 ± 6.9** | −32% |
| THR | 150.6 ± 5.8 | 197.7 ± 12.9** | 31% | 163.9 ± 14.3 | 110.4 ± 4.7** | −33% |
| CIT | 51.4 ± 3.2 | 71.4 ± 2.0*** | 39% | 48.0 ± 3.1 | 52.3 ± 3.4 | ns |
| ARG | 131.4 ± 9.2 | 99.9 ± 7.7* | −24% | 125.2 ± 9.9 | 29.4 ± 4.6** | −77% |
| B-ALA | 9.5 ± 0.6 | 7.8 ± 0.6 | ns | 2.0 ± 1.0 | 1.1 ± 0.6 | ns |
| TAU | 445.6 ± 38.8 | 637.8 ± 53.7** | 43% | 701.7 ± 48.2 | 735.3 ± 86.9 | ns |
| ALA | 390.6 ± 18.1 | 583.3 ± 48.1** | 49% | 326.1 ± 19.4 | 272.7 ± 16.4* | −16% |
| TYR | 78.4 ± 3.7 | 125.3 ± 7.8*** | 60% | 62.7 ± 3.0 | 58.3 ± 1.5 | ns |
| TRP | 76.6 ± 5.6 | 123.0 ± 5.2*** | 60% | 67.9 ± 5.3 | 129.6 ± 3.3** | 91% |
| MET | 66.1 ± 3.7 | 74.5 ± 4.7 | ns | 66.4 ± 3.8 | 42.5 ± 1.4** | −36% |
| VAL | 166.3 ± 7.4 | 282.4 ± 17.5*** | 70% | 178.6 ± 14.4 | 215.8 ± 12.7 | ns |
| PHE | 65.0 ± 3.2 | 101.4 ± 5.2*** | 56% | 85.4 ± 4.2 | 78.7 ± 1.7 | ns |
| ILE | 68.7 ± 3.8 | 126.2 ± 7.2*** | 84% | 79.9 ± 6.8 | 101.0 ± 5.9* | 26% |
| LEU | 144.2 ± 5.3 | 234.5 ± 17.5*** | 63% | 157.3 ± 14.7 | 177.7 ± 9.4 | ns |
| ORN | 96.8 ± 4.2 | 190.3 ± 9.6*** | 96% | 73.8 ± 12.1 | 173.6 ± 5.6** | 135% |
| LYS | 307.3 ± 23.0 | 323.0 ± 15.2 | ns | 299.0 ± 15.4 | 209.4 ± 7.6** | −30% |
Values are means ± SE.
p < 0.05,
p < 0.01,
p < 0.001 compared with lean mice in each nutritional state; ns donates not significant, n=8/group
The results in the fasted ob/ob mice and previous studies on fasted humans suggest that the obesity-related differences in plasma BCAAs are not due solely to higher food intake in obese animals. In contrast to the elevated BCAAs in obesity, fed plasma glucose concentrations were not significantly different between lean and obese animals (Table 1). In contrast, BCAAs were unaltered by an overnight fast in Zucker lean rats (Fig. 1B).
As shown in table 2, in addition to the BCAAs, obesity had effects on other amino acids. In the post-absorptive state, the largest changes were observed in the large neutral amino acids which include the aromatic amino acids (Phe, Tyr, Trp) and BCAAs (Leu, Ile, Val) with concentrations ranging from 56% to 84% higher in ob/ob mice compared to the lean control values. The urea cycle intermediates, ornithine and citrulline were elevated, respectively, by 96 and 39%, whereas plasma Arg concentrations were lower (−24%) than in lean controls. Plasma levels of dispensable amino acids, Ser, Asn, Thr, were also significantly higher (~30%) in fed obese animals than in lean controls. In the fasting state, plasma concentrations of 7 amino acids were less, and 4 amino acids were greater in ob/ob mice than in control mice. Notably, plasma concentrations of Orn, Trp and Ile were elevated in both fed and fasting states in ob/ob mice compared to the lean mice. The gluconeogenic amino acids, Ser, Thr and Ala, which were elevated in the fed state, were lower in obese ob/ob animals than in lean controls during fasting. Gly was also lower than in lean controls during fasting.
Obesity related differences in the plasma concentrations of amino acids were sometimes dependent on whether the plasma was from random fed or overnight food-deprived animals (Table 2). In lean controls, concentrations of most plasma amino acids did not change significantly in response to an overnight fast. Exceptions were Glu, Asn, taurine, Tyr, Phe, and the urea cycle intermediate, Orn. Food deprivation had a greater effect on the plasma amino acid pattern in the obese ob/ob mice, with most amino acids showing statistically significant decreases with respect to fed animals. Plasma BCAA changes in response to fasting were different in lean controls and ob/ob mice (Figure 1A and Table 1). Compared to the fed levels, fasting plasma BCAAs did not differ in lean animals, however, they were decreased by 30% (p < 0.001) in the ob/ob mice. Thus, the BCAAs in obese animals were more sensitive to fasting than the lean controls.
Table 3 shows the plasma concentrations of the transamination products of BCAAs, the branched chain α-keto acids, in the fed and fasted state in ob/ob mice and lean controls. In fed state, plasma branched chain α-keto acids were higher in when ob/ob mice were compared to lean animals with the increases in the α-keto acid of leucine, KIC, reaching statistical significance. Consistent with a previous report in rats (24), in lean mice plasma branched chain α-keto acids were elevated by fasting when compared to the fed state (p< 0.001). In ob/ob mice, fasting plasma branched chain α-keto acids were also elevated when compared to fed obese mice (p <0.006 and p < 0.05 for KIV and KIC, respectively).
Table 3.
Plasma concentrations of α-branched chain keto acids (μM)
| Fed | Fasted | |||
|---|---|---|---|---|
| lean | ob/ob | lean | ob/ob | |
| KIV | 15.4 ± 1.7 | 17. 3± 1.6 | 20.7 ± 1.5 | 23.0 ± 1.0 |
| KIC | 17.2 ± 1.1 | 24.3 ± 2.8* | 32.2 ± 1.9 | 31.1 ± 1.9 |
| KMV | 21.5 ± 2.2 | 29.2 ±3.9 | 33.9 ± 2.8 | 35.7 ± 2.2 |
Values are means ± SE.
p < 0.05 compared with lean mice in each nutritional state, n=8–10/group
The obesity-related differences in plasma BCAAs may not be due solely to higher food intake in obese animals. For example, while the obesity related changes in BCAAs became statistically insignificant with fasting in Zucker rats, in ob/ob mice plasma BCAAs were still elevated in the fasted state (Fig 1 and Table 2) and two of the keto acids were also elevated in fasted ob/ob mice. As mentioned earlier, BCAAs are also elevated in other obesity models as well as fasted obese humans (11, 12, 31). To begin to understand the molecular basis for the elevated plasma BCAA concentrations in obese animals, we examined the protein concentrations and activities of the enzymes catalyzing the first two key steps in body BCAA metabolism: mitochondrial BCATm and the BCKD enzyme complex in lean and obese ob/ob mice and Zucker rats.
Effect of obesity on enzymes in the BCAA catabolic pathway in skeletal muscle, liver and adipose tissue
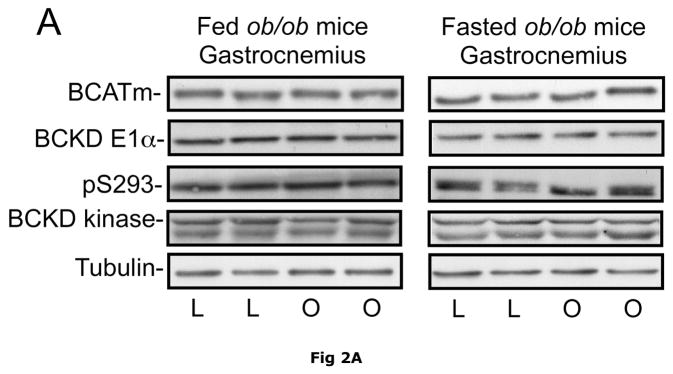
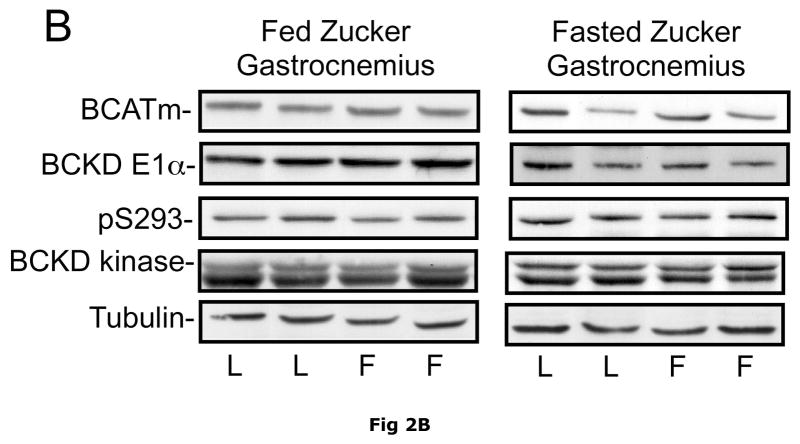
Due to its large mass (~40% of body weight in lean animals) and high level of BCATm activity relative to BCKD activity, skeletal muscle plays a significant role in body BCAA transamination and is a major source of plasma branched chain α-keto acids (24). However, when comparing ob/ob mice and their sibling lean controls, no differences were observed in the relative concentrations of skeletal muscle BCATm, BCKD E1-α subunit, BCKD kinase or E1-α pS293 phosphorylation (Fig. 2). These results suggest that BCAA metabolism in skeletal muscle is unaltered in the obese state and there is limited oxidation of BCAAs in muscle as observed in non obese animals and it is likely that skeletal muscle is a major source of plasma BCAAs in obese animals as well as lean animals. Similar results were found in the skeletal muscle of Zucker fatty rats (Fig 2).
Fig. 2. BCAA catabolic enzymes and pS293 E1α immunoreactivity in skeletal muscle of ob/ob mice and Zucker rats.
Gastrocnemius muscle was obtained from random fed or overnight fasted ob/ob mice and Zucker rats. Equal amounts of muscle lysate protein from lean control (L) and obese (O) mice (Pane A) or lean (L) and obese “fatty” (F) Zucker rats (Panel B) were then separated by SDS-PAGE and transferred to PVDF. These blots were probed for antibodies against BCATm, BCKD E1α, pS293 E1-α and BCKD kinase (arrow, bottom band is non-specific). Tubulin was used as a loading control. No statistical difference was found in the concentration of any of the antigens between the lean and obese state when replicates were analyzed (p>0.05, n=8, densitometry not shown).
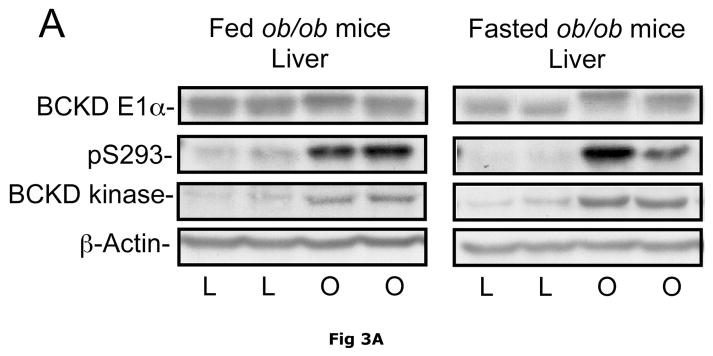
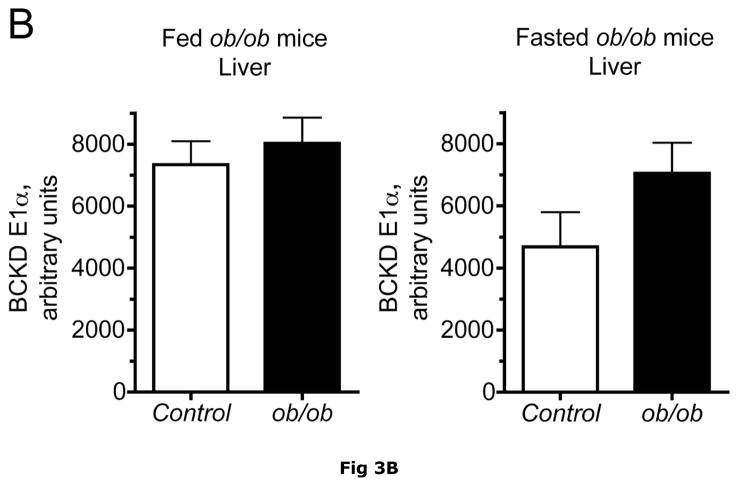
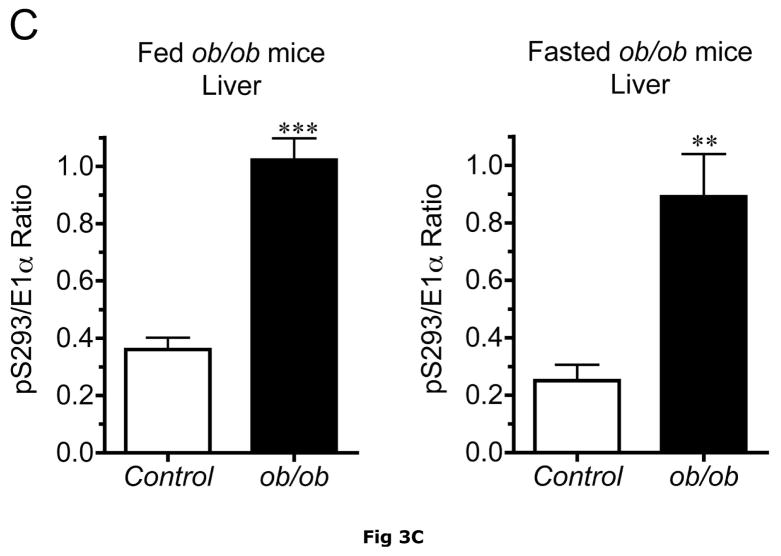
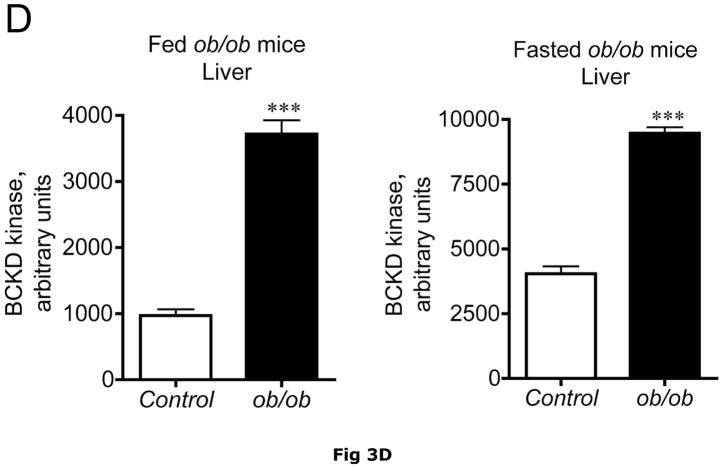
BCATm is not expressed in adult rodent liver (23, 25), whereas liver contains the highest concentration of BCKD complex activity and is thought to be the major site of branched chain α-keto acid oxidation (53). On a standard rodent chow diet, liver BCKD complex is nearly 100% phosphorylated in the active state and has low BCKD kinase activity, i.e., the E1-α subunit Ser293 is largely unphosphorylated (17, 19, 35). As in muscle, amounts of BCKD E1α subunit were unaltered by obesity in ob/ob mice when compared to lean controls (Fig. 3A). However, BCKD kinase expression was elevated 2–3 fold in fed or overnight fasted ob/ob mice compared to lean controls (Fig. 3D). The increase in kinase expression was associated with a 2–3 fold increase in the ratio of E1α pS293 phosphorylation to total E1α in both fed and overnight fasted livers from ob/ob compared to lean sibling control mice (Fig. 3C). We have shown previously a strong correlation between decreases in liver BCKD activity and immunoreactivity of the pS293 antibody in rats, however we have not conducted similar experiments in mice. Therefore BCKD activity was examined. Hepatic BCKD activity was depressed in obese ob/ob mice based on either gm wt or mg protein (Table 4).
Fig. 3. Total and pS293 phosphorylated BCKD E1α and BCKD kinase immunoreactivity in liver from ob/ob mice.
Liver protein lysates, made from frozen lean (L) and ob/ob (O) rat liver powders, were equalized for protein content, separated by SDS-PAGE and transferred to PVDF for immunoblotting. Panel A shows representative immunoblots of total BCKD E1α (liver does not express BCATm), pS293 E1α, BCKD kinase and β-Actin (loading control). Other panels show densitometric analysis of replicates for BCKD E1α (Panel B), pS293 E1α/BCKD E1α ratio (Panel C) and BCKD kinase (Panel D). Fed and Fasted data were initially derived from two separate blots at different times. To compare them together, the remaining samples were electrophoresed on the same blot and reanalyzed together, however there was insufficient material to rerun the BCKD kinase. The original data are shown for that endpoint; a t-test was used to compare the lean and obese states only (*** p < 0.001, n=6/group). The other reanalyzed samples were compared between lean and obese as well as nutritional status using an ANOVA. Asterisks indicate where statistical differences between the lean and obese condition in the corresponding nutritional state was observed based upon a Student-Newman-Keuls Multiple Comparisons post-test (*P<0.05, *** p < 0.001). No differences were observed between the lean and fasted states for any antigen. Western blotting for β-Actin was used as a loading control. The densitometry values were 7539 ± 665; 7358 ± 692; 6835 ± 532 and 6833 ± 578 for fed lean, fed obese, fasted lean and fasted obese mouse liver, respectively (N.S., p>0.05).
Table 4.
BCKD activity in livers from lean control and ob/ob mice in the fed and fasted state
| Lean | ob/ob | % Change | ||
|---|---|---|---|---|
| Fed | Actual Activity1 | |||
| nmol/min/mg protein | 16.4 ± 0.9 | 13.0 ± 0.3 | ↓ 21%* | |
| nmol/min/g tissue | 1103 ± 39 | 592 ±− 32 | ↓ 46%** | |
| Activity State2 | 1.12 ± 0.05 | 1.14 ± 0.03 | NS | |
| Fasted | Actual Activity | |||
| nmol/min/mg protein | 13.4 ± 0.4 | 10.3 ± 0.6 | ↓ 23%** | |
| nmol/min/g tissue | 768 ± 32 | 476 +/− 22 | ↓ 38%** | |
| Activity State | 1.23 ± 0.08 | 1.07 ±− 0.08 | NS | |
Actual and total activities refer to BCKD activity measured in tissue extracts before (actual) and after dephosphorylation (total, data not shown).
Activity state is the ratio of actual to total activity.
p < 0.05,
p < 0.001 difference between Lean control and ob/ob mice.
Overnight fasting does not normally have an effect on the phosphorylation state and activity of BCKD in rats, whereas longer term starvation results in diminished BCKD activity (19) Indeed, there was a trend towards lower levels of total BCKD E1α subunit in overnight-fasted mice, but differences were not statistically significant. Nevertheless, average BCKD activity tended to be lower for both groups (table 4). Thus an overnight fast in mice may be more representative of a starvation response in rats in terms of this activity. The lowered hepatic BCKD activity during fasting compared to the fed state is consistent with elevated branched chain α-keto acids during fasting (Table 3) and the major role of liver in branched chain α-keto acid oxidation in lean animals (53).
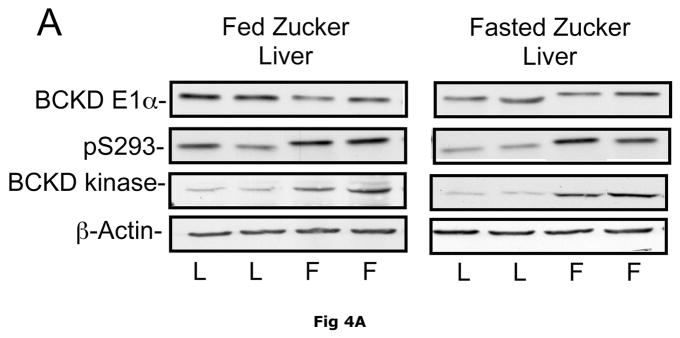
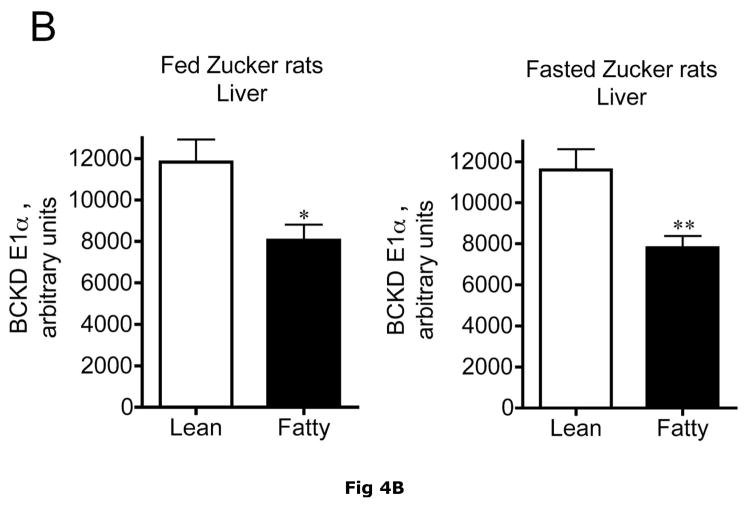
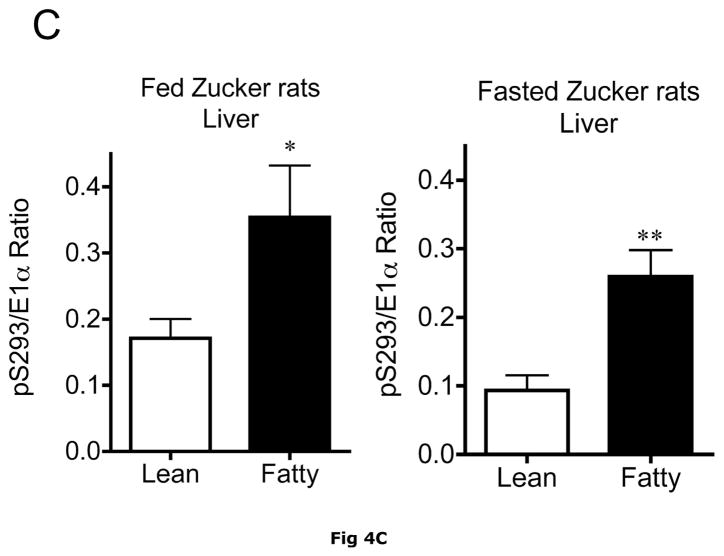
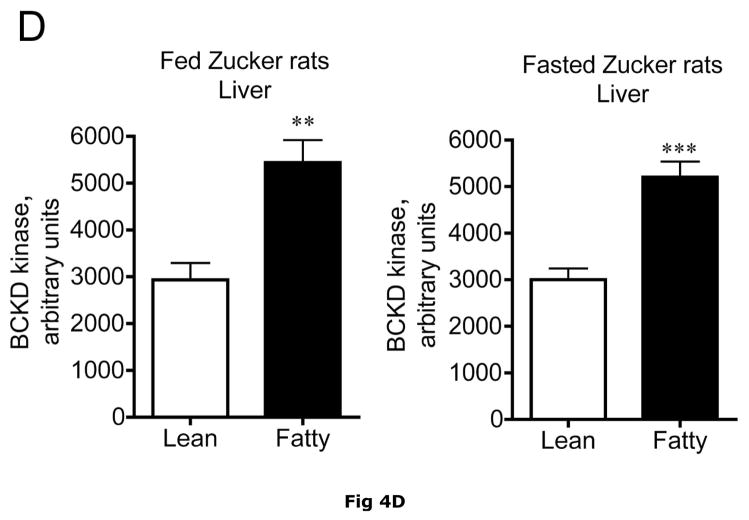
Changes in hepatic BCKD complex enzymes were also observed in Zucker rats. In contrast to ob/ob mouse liver, however, statistical changes occurred in both total BCKD and its phosphorylation state (Fig 4). Total BCKD E1α protein level was decreased by over 30% in the fed and fasted state by obesity in Zucker Fatty livers (Fig. 6A). Despite the decrease in total BCKD E1α, as observed in ob/ob animals, the ratio of pS293 E1α to E1α were also elevated ~2 fold (Fig. 4B). This was also independent of nutritional status. Consistent with changes in ob/ob mouse liver, hepatic BCKD kinase expression was elevated ~2 fold in both fed and overnight fasted Zucker fatty rats compared to lean controls (Fig. 4C). This is a potential explanation for the increased S293 E1α phosphorylation we observed. In contrast to these changes, no changes were observed in the loading controls in mice or rats by obesity or nutritional status (Fig 3E and 4E).
Fig 4. Total and pS293 phosphorylated BCKD E1α and BCKD kinase immunoreactivity in liver from Zucker rats.
Liver lysates made from frozen lean (L) and fa/fa Fatty Zucker (F) rat liver powders, were equalized for protein content, separated by SDS-PAGE and transferred to PVDF. Panel A shows representative immunoblots of BCKD E1α (liver does not express BCATm), pS293 E1α and BCKD kinase from random fed lean (L) and ob/ob (O) mice. Thus the other panels show the densitometric analysis of these blots for BCKD E1α (Panel B), pS293 E1α/BCKD E1α ratio (Panel C) and BCKD kinase (Panel D). An ANOVA was first used to compare the lean and obese states as well as across the fed and fasted states followed by a Student-Newman-Keuls Multiple Comparisons post test. Asterisks indicate where statistical differences between the fatty and lean condition in the corresponding nutritional state was observed (** p < 0.01, *** p < 0.001). No statistical differences were detected between expression levels of any of the antigens when random fed and fasted states were compared. Western blotting for β-Actin was used as a loading control. The densitometry values were 6270 ± 703; 6198 ± 255; 6297 ± 20 and 6786 ± 599 for fed lean, fed obese, fasted lean and fasted obese rat liver, respectively (p>0.05).
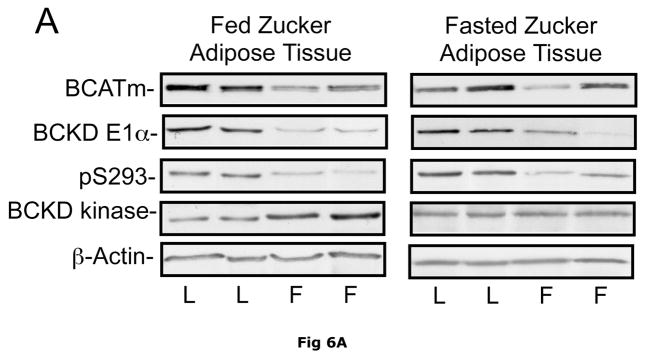
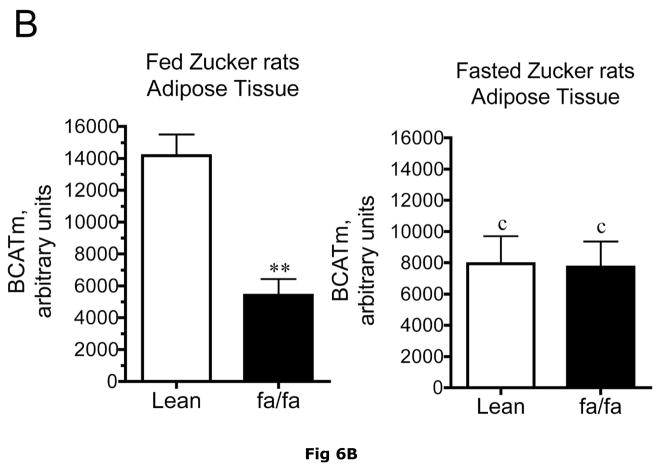
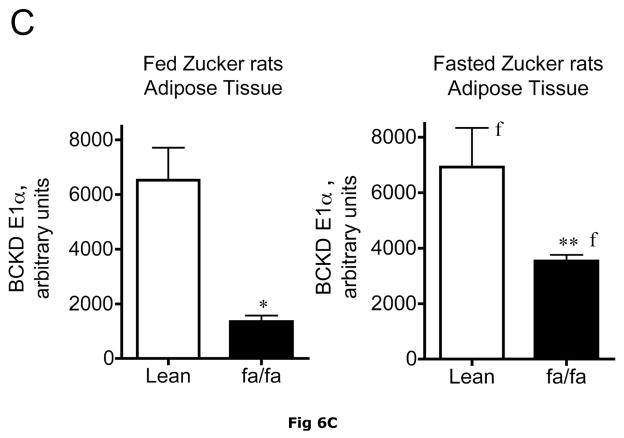
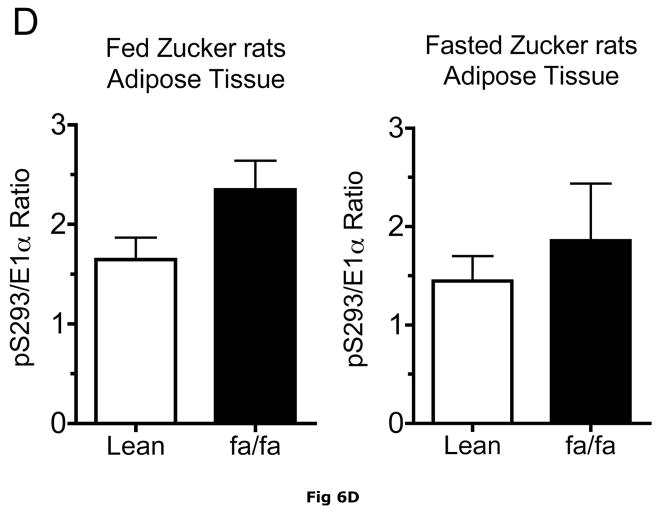
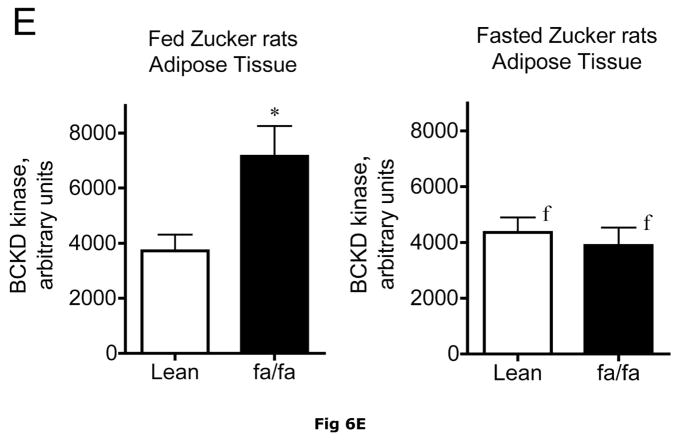
Fig 6. Expression of BCATm, pS293 phosphorylated and total BCKD E1α, BCKD kinase immunoreactivity in adipose tissue of Zucker rats.
Equal amounts of protein lysates, made from frozen lean (L) and obese (F) Zucker rat adipose tissue powders, were separated by SDS-PAGE and transferred to PVDF. Panel A shows representative immunoblots of BCATm, total BCKD E1α, phosphorylated BCKD (pS293 E1α) and BCKD kinase from random fed and overnight fasted lean (L) and fatty (F) Zucker rats. Other panels show densitometric analysis of BCATm (Panel B), total BCKD E1α (Panel C), pS293 E1α immunoreactivity as a ratio to total BCKD (Panel D) and BCKD E1- α kinase (Panel E). An ANOVA followed by a Student-Newman-Keuls Multiple Comparisons post test was used to compare the lean and fatty states across the fed and fasted states (n=6/group). Asterisks indicate statistical differences between the obese and lean mice (* P<0.05, *** p < 0.01, *** p < 0.001). An “f” indicates a significant difference in comparison to the obese fat rats in the fed state (P<0.05). Western blotting for β-Actin was used as a loading control. The densitometry values were 5876 ± 232; 6122 ± 550; 8331 ± 251 and 8029 ± 347 for fed lean, fed obese, fasted lean and fasted obese rat adipose, respectively (p>0.05).
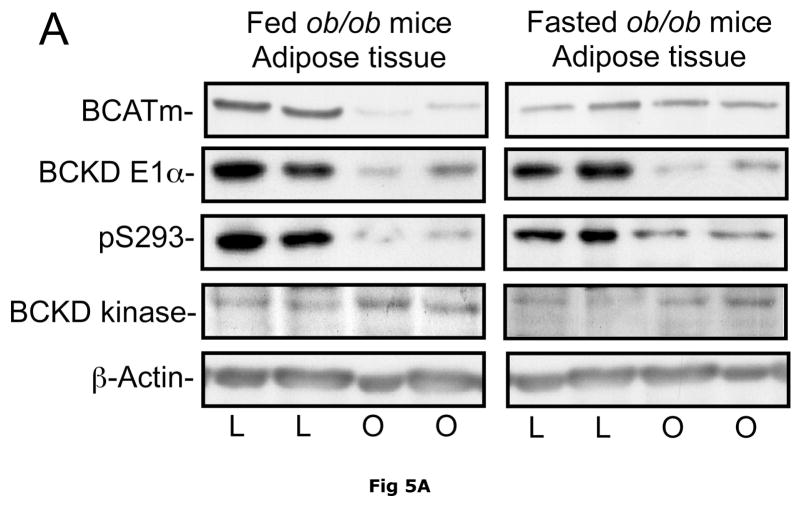
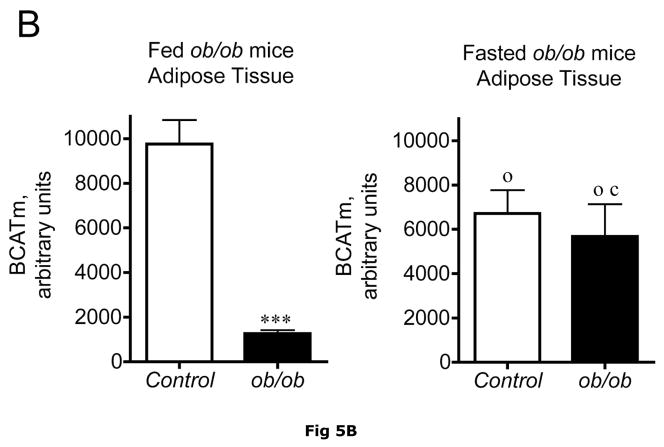
It is unclear what relative contribution adipose tissue makes to whole body BCAA metabolism and how this changes in obesity where adipose tissue becomes a more significant contributor to body weight. Adipose tissue contains BCATm and BCKD activity (14, 16). By Western blotting, it has about twice as much BCATm per mg of protein than muscle and about 5 times more BCKD E1-α subunit (36). The amount of adipose tissue E1-α subunit is comparable to liver (36). In Western blots, relative concentrations of BCATm protein were lower in various preparations of fed ob/ob mouse adipose tissue compared to lean controls (Fig. 5A and B), the smallest difference being around a 63% reduction. BCAT activity per g tissue was 52% lower in obese ob/ob mice (129 ± 6 nmol/min/g tissue, n = 8) than in lean controls (266 ± 26 nmol/min/g tissue, n=6, p < 0.01). When adjusted for differences in protein content of the tissue, BCAT activity was still 30% lower in the ob/ob mice (27 ± 2 nmol/min/mg protein) than in the lean controls (19 ± 1 nmol/min/mg protein, n=6, p < 0.05). Similarly, relative concentrations of adipose tissue BCATm protein were 3.8-fold lower in Zucker fatty rats compared to lean controls (Fig. 6A and B). A surprising finding in ob/ob mice adipose tissue, also observed in the Zucker rats, was that the obesity related changes in BCATm differences disappeared in response to fasting, with similar concentrations of BCATm found in obese and lean animals. Thus fasted ob/ob mice had higher BCATm per mg of protein relative to fed obese mice, but not to the levels observed in lean fed control mice.
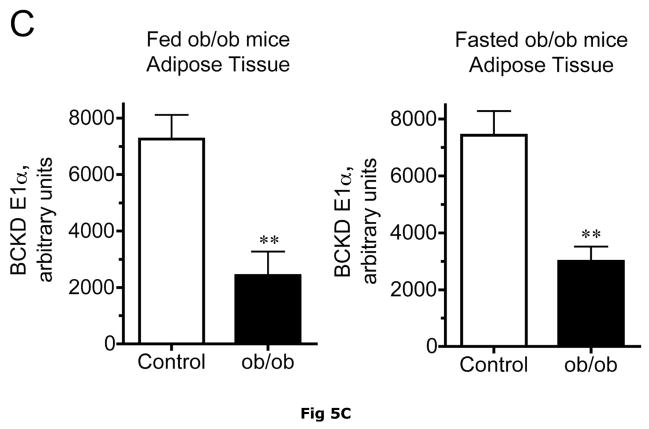
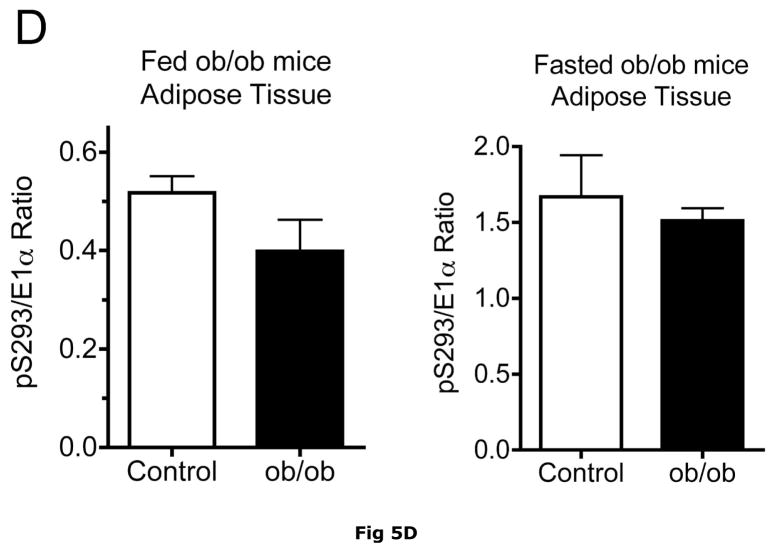
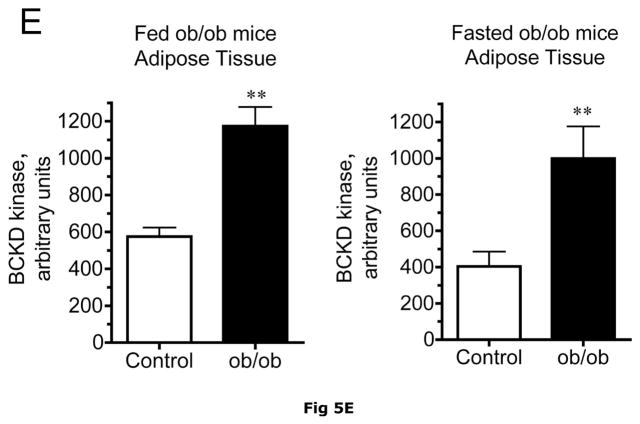
Fig 5. BCATm, total and pS293 phosphorylated BCKD E1α and BCKD kinase immunoreactivity in adipose tissue from ob/ob mice.
Equal amounts of protein lysates, made from frozen lean (L) and obese (O) ob/ob mice adipose tissue powders, were separated by SDS-PAGE and transferred to PVDF. Panel A shows representative immunoblots of BCATm, total BCKD E1α, phosphorylated BCKD (pS293 E1α) and BCKD kinase from random fed and overnight fasted lean (L) and ob/ob (O) mice. Other panels show densitometric analysis of BCATm (Panel B), total BCKD E1α (Panel C), pS293 E1α immunoreactivity as a ratio to total BCKD (Panel D) and BCKD E1- α kinase (Panel E). An ANOVA followed by a Student-Newman-Keuls Multiple Comparisons post test was used to compare the lean and obese states across the fed and fasted states (n=6/group). Asterisks indicate statistical differences between the obese and lean mice (* P<0.05, *** p < 0.01, *** p < 0.001). A “c” indicates a significant difference in comparison to the fed lean control (P<0.05), “o” a significant difference when compared to the fed obese condition (P< 0.01). Western blotting for β-Actin was used as a loading control. The densitometry values were 8293 ± 493; 8318 ± 517; 8170 ± 337 and 7712 ± 202 for fed lean, fed obese, fasted lean and fasted obese mouse adipose, respectively (p>0.05).
Adipose tissue BCKD E1-α protein expression in random fed ob/ob mice and Zucker fatty rats was 2.2- and 3.4-fold lower, respectively, than in lean controls (Fig. 5C and 6C). In contrast, the relative concentrations of BCKD kinase were ~2-fold higher in adipose tissue from ob/ob mice and Zucker fatty rats compared to lean animals (Fig. 5E and 6E). Because BCKD kinase is a mitochondrial protein, like BCATm and E1-α, the obesity-related declines in BCKD and BCATm protein levels are not likely to be related to a result of a loss of mitochondria per se. As in the other tissues, no changes were observed in the adipose tissue loading controls for either animal model (Fig 5F and 6F).
Despite increases in adipose tissue BCKD kinase, S293 BCKD E1α phosphorylation was less per mg of protein in both the ob/ob mice and Zucker fatty rats (Fig. 5A and 6A) and changes in the pS293/total E1-α ratio were not significant (Fig 5D and 6D). This is likely a consequence of to the decrease in total BCKD and the fact that normally adipose tissue is already extensively phosphorylated, in contrast to the liver (15, 35).
Effect of weight loss intervention
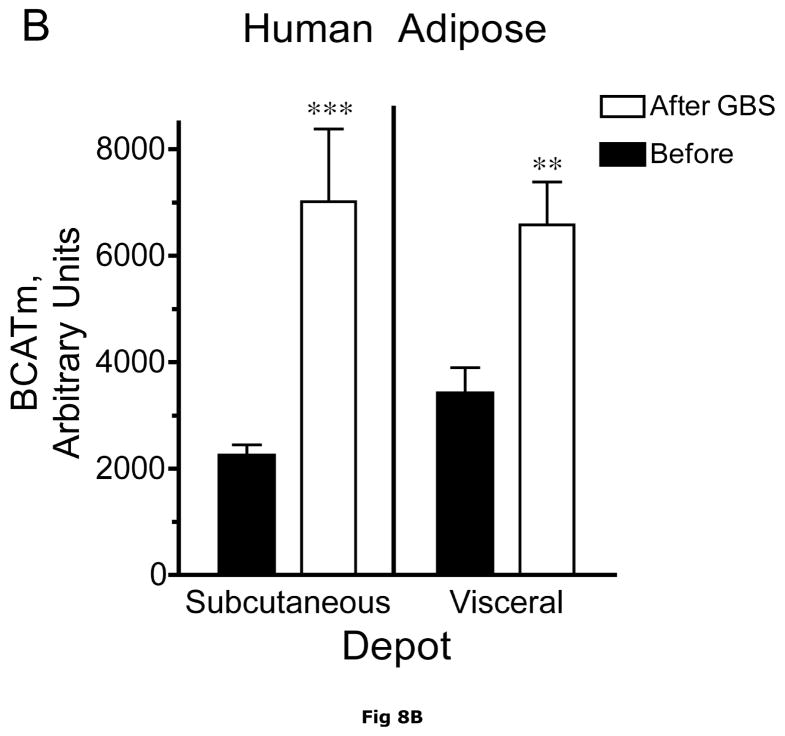
Banked human samples were also available to examine the effect of a weight loss intervention on plasma BCAAs and adipose tissue BCATm and BCKD E1α subunit (Fig. 7 and 8). Longitudinal samples were collected from overnight fasted human volunteers with morbid obesity, at the time of bariatric surgery (Roux-en-Y gastric bypass) and at a subsequent second surgery for panniculectomy, adhesions, or hernia repair. The samples were blood plasma, subcutaneous adipose tissue and omental (a visceral depot) adipose tissue.
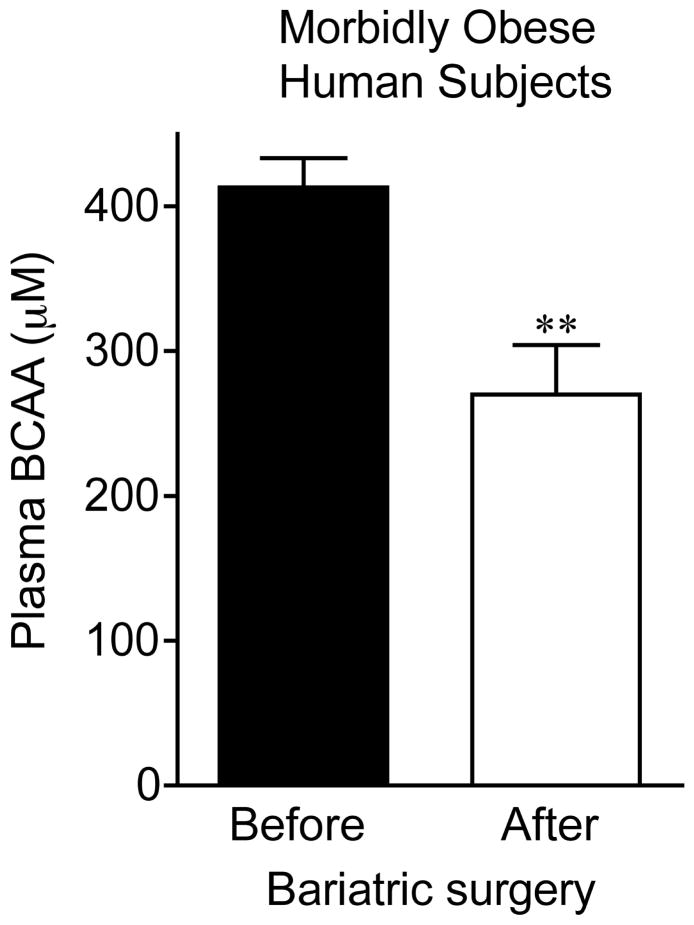
Fig 7. Plasma BCAA concentrations in overnight fasted morbidly obese human subjects before and after gastric bypass surgery.
Plasma was collected between 9 and 12 AM after an overnight fast after induction of general anesthesia from subjects described in table 4 before Roux-en-Y gastric bypass surgery and later when subjects returned for a second surgery. Plasma was stored at −80°C until assay for total BCAA concentration was conducted as in Fig. 1 using an enzymatic assay. **p < 0.01 before versus after surgery.
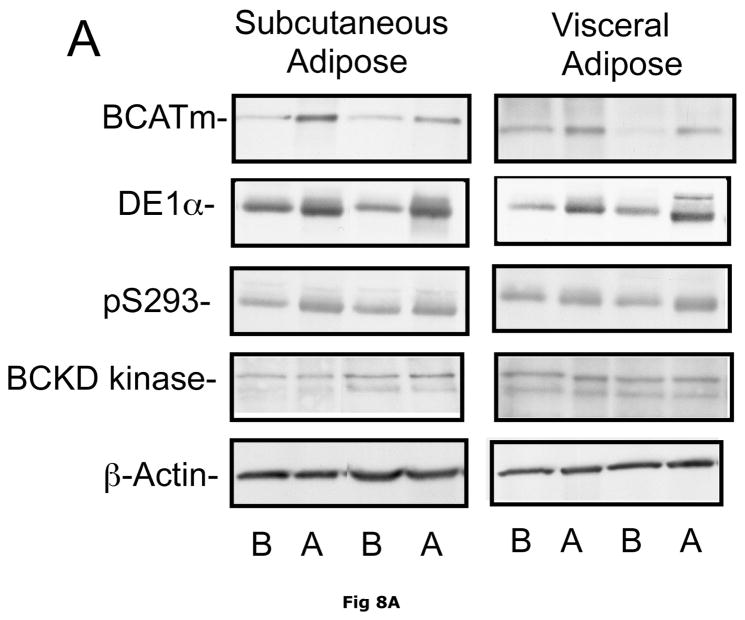
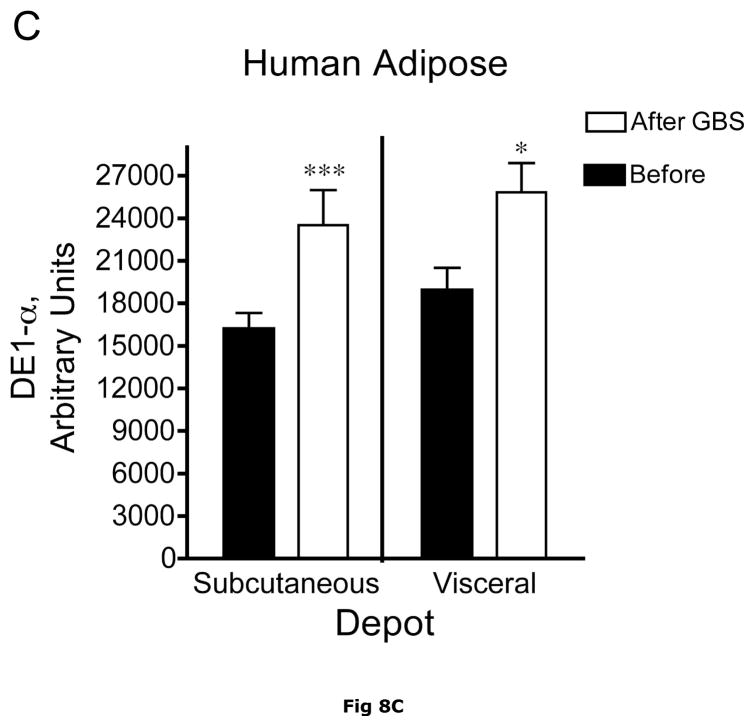
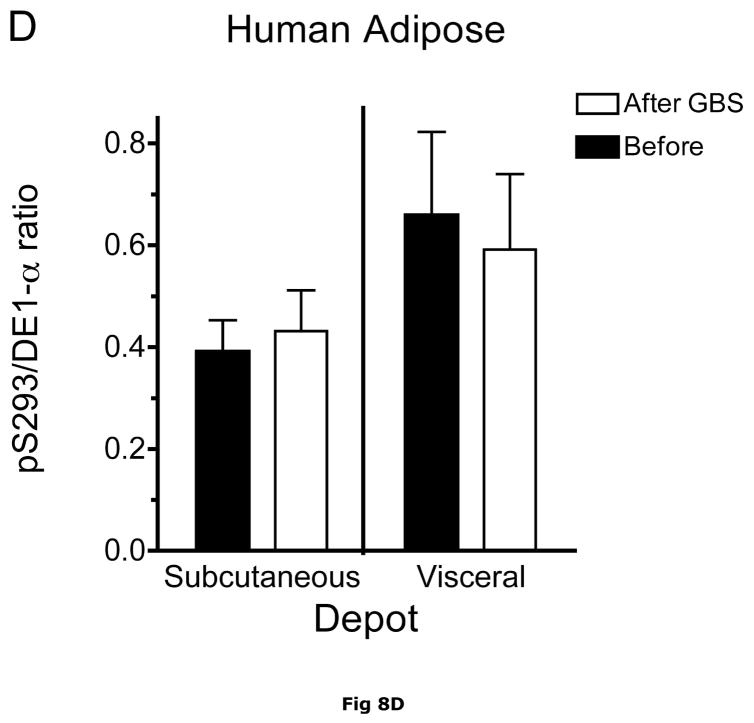
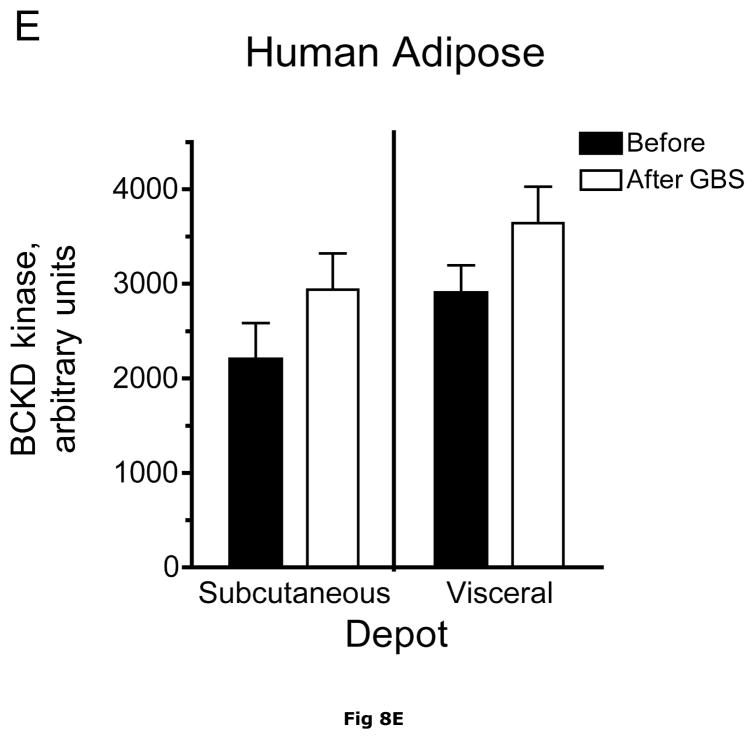
Fig. 8. Subcutaneous and Visceral adipose tissue protein expression before and after bariatric surgery-induced weight loss.
Abdominal subcutaneous and visceral (omental) adipose tissue was collected longitudinally from subjects described in table 5. The freeze clamped adipose tissue was powdered under liquid nitrogen. Infranatants of lysates prepared from these under phosphorylation state preserving conditions were solubilized with SDS-PAGE sample buffer, separated by SDS gel electrophoresis and transferred to PVDF. Representative immunoblots are shown in Panel A. Other panels show densitometric analysis of BCATm (Panel B), total BCKD E1α (Panel C), pS293 E1α immunoreactivity as a ratio to total BCKD (Panel D) and BCKD E1- α kinase (Panel E). A bar appears between the bargraphs for the subcutaneous and visceral depots because those blots were not run on the same gels, transferred in the same box or necessarily exposed with the same lot of ECL reagent. Thus comparisons are limited to the samples before and after gastric bypass surgery. A t-test was used to determine significance (* p < 0.05, ** p < 0.01, *** p < 0.001). Western blotting for β-Actin was used as a loading control. The densitometry values were Before: 8989 ± 512; After: 9249 ± 388 for subcutaneous adipose tissue and Before: 9683 ± 613; After: 10046 ± 752 for visceral adipose tissue (p>0.05 in both cases).
Bariatric surgery in the morbidly obese human subjects led to a roughly 56 kg body weight loss over the course of approximately ~17 months and significant improvement in an insulin resistance index, HOMA-IR (Table 5) in both male and female subjects. Average weight loss, plasma glucose and insulin were not significantly different between the male and female subjects by the time of the second operation (Table 5). As there were no obvious differences in the males and females in terms of these parameters as well as the BCAA metabolizing enzymes or plasma BCAAs, these data were pooled. However because of the number of samples involved it was not possible to directly compare visceral and subcutaneous in the before and after condition. Therefore each depot was evaluated separately, before and after surgery using a t-test.
Table 5.
Characteristics of Human Subjects providing visceral and subcutaneous adipose tissue before and after Roux-en-Y Gastric Bypass Surgery
| Sex | Male | Female | Combined |
|---|---|---|---|
| Race and n | 7 Caucasians | 8 Caucasians, 1 African American | 15 Caucasians 1 African American |
| Age | 51.3 ± 1.9 | 44.6 ± 2.9 | 47.5 ± 2.0 |
| Intervention period (months) | 17.8 ± 1.9 | 16.7 ± 3.0 | 17.2 ± 1.8 |
| Weight at 1st Surgery (kg) | 179.0 ± 10.3 | 150.4 ± 11.6 | 162.9 ± 8.5 |
| Weight at 2nd surgery (kg) | 115.7 ± 7.8 | 100.9 ± 6.3 | 107.4 ± 5.1 |
| Weight loss (kg) | 63.3 ± 4.3 | 49.5 ± 7 | 55.5 ± 4.6 |
| HOMA-IR Before | 3.6 ± 1.3 | 9.4 ± 5.6 | 7.1 ± 3.4 |
| HOMA-IR After | 1.2 ± 0.2 | 4.6 ± 2.4 | 2.9 ± 1.3 |
| Glucose Before (mg/dl) | 114.1 ± 7.2 | 145.8 ± 24.5 | 133.2 ± 15.3 |
| Glucose After (mg/dl) | 113.5 ± 8.7 | 125.6 ± 24.1 | 120.0 ± 13.7 |
| Insulin Before (μU/ml) | 13.8 ± 3.7 | 22.0 ± 8.0 | 18.7 ± 5.0 |
| Insulin After (μU/ml) | 4.7 ± 0.6 | 14.3 ± 9.2 | 9.8 ± 5.2 |
Values are means ± SE. An asterisk * indicates a significant difference when before and after values are compared.
Plasma concentrations of BCAA were lower in morbidly obese subjects after gastric bypass resulting in a significant ~35% decrease in overnight fasted plasma BCAA concentrations (Fig. 7). The changes in plasma BCAAs were associated with a ~3.5 and ~2 fold increase, respectively, in BCATm in subcutaneous and visceral adipose tissue compared to before surgery levels (Fig 8A and B). Total BCKD E1α was also elevated in both depots (Fig 8A and C) compared to before gastric bypass. No significant changes were observed in BCKD kinase (Fig 8A and 8E), BCKD pS293 phosphorylation/total BCKD ratio (8A and 8D) or the concentration of the loading control, β-Actin (Fig 8A and 8F) in response to weight loss intervention.
Discussion
Obesity-associated hyperaminoacidemia is traditionally interpreted as a consequence of insulin resistance, which affects protein synthesis and proteolysis. However, alterations in the metabolism of the amino acids that we observed to be elevated in obesity could also explain these changes. Here we focused on the BCAAs and BCAA catabolism because of the unique obesity/diabetes-related roles of BCAAs (5, 11, 12, 18, 29–31, 59). The potential link between elevations in BCAAs in obesity and the metabolism of BCAAs was examined by comparing effects of obesity and nutritional status changes on BCAAs to changes in either the concentration and/or phosphorylation status of the first two enzymes in BCAA metabolism in key tissues known to be important in BCAA catabolism (liver, skeletal muscle) and in adipose tissue catalyzed by BCATm and BCKD complex.
We found elevated plasma BCAAs in ob/ob mice and high-fat-diet-induced obesity in mice and in Zucker fatty rats, in agreement with previous reports in obese humans and Zucker fatty rats (4, 5, 11, 12, 37, 46, 48, 49, 52, 56). These elevations were associated with reductions in the activity or amount of enzymes involved in the early steps of BCAA metabolisms in selective tissues including liver and fat. BCAAs also declined in morbidly obese humans after surgical weight loss. These changes were comparable to reductions in plasma BCAAs reported upon weight loss by therapeutic starvation (12). In agreement with our findings in rodents, we found that the weight loss associated declines in plasma BCAAs in humans, corresponded to increased concentrations of BCATm and total BCKD E1-a subunit in both visceral and subcutaneous adipose tissues. Finally, in rats and mice, the obesity related changes in BCAAs tended to normalize after an overnight fast and, in some cases, these changes were mostly reflected in a corresponding statistical change in adipose tissue BCATm and/or BCKD. Thus it is tempting to speculate that changes in adipose tissue mass and its relative contribution to whole body BCAA metabolism may play a role in the elevated BCAAs in obesity.
Rather than being restricted to liver, the BCAA catabolic enzymes are distributed widely in body tissues; and with the exception of the nervous system, all reactions occur in the mitochondria of the cell. The tissue specific expression and regulation, as well as intracellular compartmentalization of the branched chain aminotransferase isozymes (BCATm and BCATc) impact intra- and inter-organ exchange of BCAA metabolites, nitrogen cycling, and net nitrogen transfer (54). In lean animals, the liver is thought to be the major organ responsible for oxidative decarboxylation of branched-chain α-ketoacids from the circulation. While BCKD is only partially active because of phosphorylation in other tissues, hepatic BCKD in regularly-fed animals is highly active and exhibits low levels of phosphorylation. We found that hepatic BCKD activity was decreased in ob/ob mice and that this was associated with elevated pS293 phosphorylation of the E1α-subunit of BCKD. The differences in phosphorylation state as measured by Western blot analysis with phospho-specific antibodies and measured BCKD enzyme activity in liver suggest that additional proteins and/or factors may modulate BCKD activity in the obese state or that the ratio of free E1 to bound E1 is affected (10, 58). This could also be true in obese fat tissues where BCKD kinase protein expression was elevated where E1α pS293 phosphorylation was unaltered. Hepatic BCKD is highly regulated by dietary protein, physiological factors and drugs (e.g. clofibrate), largely via alterations of BCKD kinase expression. The active form of hepatic BCKD was significantly decreased by low-protein diets, 48-h starvation, alloxan-diabetes, and once a day meal feeding in rats (3, 38, 45). We found that BCKD kinase protein expression in livers and adipose tissues of ob/ob mice and Zucker fatty rats was significantly elevated potentially explaining the increase S293 phosphorylation of BCKD E1-α subunit. Thyroid hormones have also been shown to induce BCKD kinase expression (41); however, thyroid hormone function is impaired in ob/ob mice (e.g., 22). Since it has been reported that insulin increased BCKD kinase expression in Clone 9 rat liver cells (42), it is possible that high plasma insulin in obesity may have contributed to the up-regulated liver BCKD kinase expression. Although ob/ob mouse liver exhibits severe insulin resistance towards glucose metabolism, it retains insulin sensitivity towards lipid metabolism (41); and this could also be true for the regulation of BCKD kinase expression.
Fat has about twice as much BCATm per mg of protein than muscle and about 5 times more dehydrogenase (36). The amount of dehydrogenase is comparable to liver (36). Protein levels of BCATm and BCKD E1α were decreased in adipose tissue from ob/ob mice and Zucker fatty rats. These findings are consistent with studies reporting that mRNA expression for all or some of the adipose tissue enzymes in the BCAA metabolism pathway are decreased in different obesity models (21, 40). It is tempting to speculate that reduction in these BCAA catabolic enzymes may diminish BCAA metabolism in the adipose tissue, but it is hard to quantify how much this would contribute to elevated plasma BCAAs found in ob/ob mice, given that their fat pat weight was many fold greater than that of lean controls. In fat, the drop in BCATm and BCKD E1α may result in a transient local elevation of BCAA, where BCAAs can act as a nutrient signal to activate mTOR and protein synthesis. Indeed, in randomly fed ob/ob mice, while T389 S6K1 phosphorylation, a common readout of mTOR activation, was not statistically different, but also quite variable, it was dramatically elevated in adipose tissue compared to lean mice (data not shown). S6K1 hyperphosphorylation could result from both locally elevated BCAAs in fat and hyperinsulinemia in ob/ob mice. Another interesting aspect is that the changes in these enzymes in fat and the plasma BCAAs in obesity seem to be reversible. BCAAs were reduced while BCATm and total E1-a subunit protein levels were elevated by weight loss in obese humans. Interestingly, plasma BCAAs as well as adipose tissue BCATm changes, and in Zuckers even total E1-α, were also impacted by nutritional status; obesity related differences dissipating upon fasting. Further studies on roles of BCAAs in adipocyte development, metabolism and obesity are warranted.
In addition to BCAAs, we noticed changes in other plasma amino acids in ob/ob mice. First, amino acids involved in the urea cycle were also altered. Arg was the only amino acid whose plasma concentration was decreased in the ob/ob mice in the fed state and was further decreased by fasting. Meanwhile, plasma Orn was elevated in both fed and fasted states. The changes in these amino acids could indicate alteration of urea synthesis in the liver, i.e. a block in the cytosolic reactions (increased Orn, Citr) and/or a deficit in Arg from increased metabolism, perhaps for nitric oxide synthesis. Decreased arginine availability could affect vascular dilution in ob/ob mice. Second, in response to fasting, plasma concentrations of most amino acids were decreased in the ob/ob mice, but not in the lean mice, consistent with a study in obese Zucker rats (49). Plasma amino acid concentrations represent the balance of protein turnover (protein synthesis and degradation), amino acid absorption from diet, and metabolism of individual amino acids. Obesity could affect all of these factors. In the fed state, elevated food intake and/or decreased protein synthesis (especially in muscle, see above) could contribute to the elevated amino acids, including BCAAs, in plasma. While in the fasted state, protein breakdown in specific tissues could be diminished, leading to lowered plasma amino acids. It is also possible that oxidation of some amino acids was higher in obese animals in the fasted state. A study in obese humans showed that the rate of release of amino acids per unit of forearm and adipose tissue at 22-h of fasting was lower in women with abdominal obesity than in lean women, which may help obese women decrease body protein losses during fasting (44). The lower levels of gluconeogenic amino acids in fasting may be attributed to elevated gluconeogenic rates during fasting (55).
In summary, we have found alterations in BCAA metabolizing enzymes that correspond to obesity-related alterations in plasma BCAA concentrations in fed and fasting obese animal models. The obesity-related rise in BCAAs is seen despite relatively little change in the fed plasma glucose. Fed plasma concentrations of other amino acids were also elevated and largely diminished by fasting in ob/ob mice. Unique alterations in Arg, Orn and large neutral amino acids including BCAAs were also found in ob/ob mice. Whereas muscle enzymes were unaffected, in liver, BCKD kinase expression was increased by obesity; and E1α S293 phosphorylation was elevated in the face of unaltered BCKD E1α protein in ob/ob mice and decreased BCKD E1α protein in Zucker fatty rats. However these changes remained in the fasted animals when BCAAs normalized. In adipose tissue, obesity was associated with declines in BCATm and BCKD E1α protein concentrations. These changes were surprisingly dissipated after an overnight fast. It is tempting to speculate therefore that adipose tissue may make a more important contribution to whole body BCAA metabolism than previously realized. Some of the enzymatic alterations in adipose tissue BCAA metabolism were reversed by bariatric surgery-induced weight loss in obese humans and these were associated with lower plasma BCAA concentrations. Thus, the results suggest that tissue-specific alterations in BCAA metabolism could contribute, at least in part, to elevated plasma BCAAs, which may promote protein synthesis to preserve protein loss in the face of insulin resistance in obesity. Since the results of previous studies on BCAA metabolic flux in obesity have been inconsistent, flux studies need to be carefully performed to measure the impact of these enzymatic changes and tissue redistribution of the catabolic enzyme activities on the rates of BCAA metabolism in obesity. In addition, in view of the growing obesity epidemic, the relative importance of adipose tissue as a site of BCAA metabolism and plasma BCAA control should be investigated further.
Acknowledgments
This project was supported by the following grants from the National Institutes of Health (CJL, DK053843, DK062880; SMH, DK34738). The tissue bank is funded, in part, under a grant with the Pennsylvania Department of Health using Tobacco Settlement Funds (RNC CM055639-10). The DOH specifically disclaims responsibility for any analyses, interpretations or conclusions.
References
- 1.Baum JI, Layman DK, Freund GG, Rahn KA, Nakamura MT, Yudell BE. A reduced carbohydrate, increased protein diet stabilizes glycemic control and minimizes adipose tissue glucose disposal in rats. J Nutr. 2006;136:1855–1861. doi: 10.1093/jn/136.7.1855. [DOI] [PubMed] [Google Scholar]
- 2.Beckett PR. Spectrophotometric assay for measuring branched-chain amino acids. In: Harris RA, Sokatch JR, editors. Methods in Enzymology. Branched-chain amino acids, Part B. Academic Press; 2000. pp. 40–47. [DOI] [PubMed] [Google Scholar]
- 3.Block KP, Aftring RP, Buse MG. Regulation of rat liver branched-chain alpha-keto acid dehydrogenase activity by meal frequency and dietary protein. J Nutr. 1990;120:793–799. doi: 10.1093/jn/120.7.793. [DOI] [PubMed] [Google Scholar]
- 4.Caballero B, Finer N, Wurtman RJ. Plasma amino acids and insulin levels in obesity: response to carbohydrate intake and tryptophan supplements. Metabolism. 1988;37:672–676. doi: 10.1016/0026-0495(88)90089-3. [DOI] [PubMed] [Google Scholar]
- 5.Caballero B, Wurtman RJ. Differential effects of insulin resistance on leucine and glucose kinetics in obesity. Metabolism. 1991;40:51–58. doi: 10.1016/0026-0495(91)90192-y. [DOI] [PubMed] [Google Scholar]
- 6.Cota D, Proulx K, Smith KA, Kozma SC, Thomas G, Woods SC, Seeley RJ. Hypothalamic mTOR signaling regulates food intake. Science. 2006;312:927–930. doi: 10.1126/science.1124147. [DOI] [PubMed] [Google Scholar]
- 7.Doi M, Yamaoka I, Nakayama M, Mochizuki S, Sugahara K, Yoshizawa F. Isoleucine, a blood glucose-lowering amino acid, increases glucose uptake in rat skeletal muscle in the absence of increases in AMP-activated protein kinase activity. J Nutr. 2005;135:2103–2108. doi: 10.1093/jn/135.9.2103. [DOI] [PubMed] [Google Scholar]
- 8.Doi M, Yamaoka I, Nakayama M, Sugahara K, Yoshizawa F. Hypoglycemic effect of isoleucine involves increased muscle glucose uptake and whole body glucose oxidation and decreased hepatic gluconeogenesis. Am J Physiol Endocrinol Metab. 2007;292:E1683–1693. doi: 10.1152/ajpendo.00609.2006. [DOI] [PubMed] [Google Scholar]
- 9.Donato JJ, Pedrosa RG, Cruzat VF, Pires ISdO, Tirapegui J. Effects of leucine supplementation on the body composition and protein status of rats submitted to food restriction. Nutrition. 2006;22:520–527. doi: 10.1016/j.nut.2005.12.008. [DOI] [PubMed] [Google Scholar]
- 10.Espinal J, Beggs M, Patel H, Randle PJ. Effects of low-protein diet and starvation on the activity of branched-chain 2-oxo acid dehydrogenase kinase in rat liver and heart. Biochem J. 1986;237:285–288. doi: 10.1042/bj2370285. [DOI] [PMC free article] [PubMed] [Google Scholar]
- 11.Felig P, Marliss E, Cahill GF., Jr Are plasma amino acid levels elevated in obesity? N Engl J Med. 1970;282:166. doi: 10.1056/nejm197001152820315. [DOI] [PubMed] [Google Scholar]
- 12.Felig P, Marliss E, Cahill GF., Jr Plasma amino acid levels and insulin secretion in obesity. N Engl J Med. 1969;281:811–816. doi: 10.1056/NEJM196910092811503. [DOI] [PubMed] [Google Scholar]
- 13.Flier JS. Neuroscience. Regulating energy balance: the substrate strikes back. Science. 2006;312:861–864. doi: 10.1126/science.1127971. [DOI] [PubMed] [Google Scholar]
- 14.Frick GP, Blinder L, Goodman HM. Transamination and oxidation of leucine and valine in rat adipose tissue. The Journal of biological chemistry. 1988;263:3245–3249. [PubMed] [Google Scholar]
- 15.Frick GP, Goodman HM. Insulin regulation of the activity and phosphorylation of branched-chain 2-oxo acid dehydrogenase in adipose tissue. Biochem J. 1989;258:229–235. doi: 10.1042/bj2580229. [DOI] [PMC free article] [PubMed] [Google Scholar]
- 16.Frick GP, Tai LR, Blinder L, Goodman HM. L-Leucine activates branched chain alpha-keto acid dehydrogenase in rat adipose tissue. The Journal of biological chemistry. 1981;256:2618–2620. [PubMed] [Google Scholar]
- 17.Gillim SE, Paxton R, Cook GA, Harris RA. Activity state of the branched chain alpha-ketoacid dehydrogenase complex in heart, liver, and kidney of normal, fasted, diabetic, and protein-starved rats. Biochem Biophys Res Commun. 1983;111:74–81. doi: 10.1016/s0006-291x(83)80119-3. [DOI] [PubMed] [Google Scholar]
- 18.Gordon-Elliott JS, Margolese HC. Weight loss during prolonged branched-chain amino acid treatment for tardive dyskinesia in a patient with schizophrenia. Aust N Z J Psychiatry. 2006;40:195. doi: 10.1080/j.1440-1614.2006.01774_4.x. [DOI] [PubMed] [Google Scholar]
- 19.Harris RA, Joshi M, Jeoung NH. Mechanisms responsible for regulation of branched-chain amino acid catabolism. Biochem Biophys Res Commun. 2004;313:391–396. doi: 10.1016/j.bbrc.2003.11.007. [DOI] [PubMed] [Google Scholar]
- 20.Harris RA, Popov KM, Zhao Y. Nutritional regulation of the protein kinases responsible for the phosphorylation of the alpha-ketoacid dehydrogenase complexes. J Nutr. 1995;125:1758S–1761S. [PubMed] [Google Scholar]
- 21.Herman MA, Peroni OD, Kahn BB. Adipose-specific overexpression of Glut-4 causes hypoglycemia by altering branched chain amino acid metabolism. Diabetes. 2006;55S:A311. [Google Scholar]
- 22.Hillgartner FB, Romsos DR. Impaired transport of thyroid hormones into livers of obese (ob/ob) mice. Am J Physiol. 1988;255:E54–58. doi: 10.1152/ajpendo.1988.255.1.E54. [DOI] [PubMed] [Google Scholar]
- 23.Hutson SM, Fenstermacher D, Mahar C. Role of mitochondrial transamination in branched chain amino acid metabolism. J Biol Chem. 1988;263:3618–3625. [PubMed] [Google Scholar]
- 24.Hutson SM, Harper AE. Blood and tissue branched-chain amino and alpha-keto acid concentrations: effect of diet, starvation, and disease. Am J Clin Nutr. 1981;34:173–183. doi: 10.1093/ajcn/34.2.173. [DOI] [PubMed] [Google Scholar]
- 25.Hutson SM, Wallin R, Hall TR. Identification of mitochondrial branched chain aminotransferase and its isoforms in rat tissues. Journal of Biological Chemistry. 1992;267:15681–15686. [PubMed] [Google Scholar]
- 26.Jensen MD, Haymond MW. Protein metabolism in obesity: effects of body fat distribution and hyperinsulinemia on leucine turnover. Am J Clin Nutr. 1991;53:172–176. doi: 10.1093/ajcn/53.1.172. [DOI] [PubMed] [Google Scholar]
- 27.Joshi MA, Jeoung NH, Obayashi M, Hattab EM, Brocken EG, Liechty EA, Kubek MJ, Vattem KM, Wek RC, Harris RA. Impaired growth and neurological abnormalities in branched-chain alpha-keto acid dehydrogenase kinase-deficient mice. Biochem J. 2006;28:28. doi: 10.1042/BJ20060869. [DOI] [PMC free article] [PubMed] [Google Scholar]
- 28.Kahn BB, Myers MG., Jr mTOR tells the brain that the body is hungry. Nat Med. 2006;12:615–617. doi: 10.1038/nm0606-615. [DOI] [PubMed] [Google Scholar]
- 29.Layman DK. The role of leucine in weight loss diets and glucose homeostasis. J Nutr. 2003;133:261S–267S. doi: 10.1093/jn/133.1.261S. [DOI] [PubMed] [Google Scholar]
- 30.Layman DK, Walker DA. Potential importance of leucine in treatment of obesity and the metabolic syndrome. J Nutr. 2006;136:319S–323S. doi: 10.1093/jn/136.1.319S. [DOI] [PubMed] [Google Scholar]
- 31.Leclercq B, Seve B. Influence of adiposity (genetic or hormonal) on the metabolism of amino acids and nutritional responses. Reprod Nutr Dev. 1994;34:569–582. doi: 10.1051/rnd:19940604. [DOI] [PubMed] [Google Scholar]
- 32.Lee MJ, Yang RZ, Gong DW, Fried SK. Feeding and Insulin Increase Leptin Translation: Importance of the leptin mRNA untranslated regions. The Journal of biological chemistry. 2007;282:72–80. doi: 10.1074/jbc.M609518200. [DOI] [PubMed] [Google Scholar]
- 33.Luzi L, Castellino P, DeFronzo RA. Insulin and hyperaminoacidemia regulate by a different mechanism leucine turnover and oxidation in obesity. Am J Physiol. 1996;270:E273–281. doi: 10.1152/ajpendo.1996.270.2.E273. [DOI] [PubMed] [Google Scholar]
- 34.Lynch CJ, Gern B, Lloyd C, Hutson SM, Eicher R, Vary TC. Leucine in food mediates some of the postprandial rise in plasma leptin concentrations. Am J Physiol Endocrinol Metab. 2006;25:25. doi: 10.1152/ajpendo.00462.2005. [DOI] [PubMed] [Google Scholar]
- 35.Lynch CJ, Halle B, Fujii H, Vary TC, Wallin R, Damuni Z, Hutson SM. Potential role of leucine metabolism in the leucine-signaling pathway involving mTOR. Am J Physiol Endocrinol Metab. 2003;285:E854–863. doi: 10.1152/ajpendo.00153.2003. [DOI] [PubMed] [Google Scholar]
- 36.Lynch CJ, Hutson SM, Patson BJ, Vaval A, Vary TC. Tissue-specific effects of chronic dietary leucine and norleucine supplementation on protein synthesis in rats. Am J Physiol Endocrinol Metab. 2002;283:E824–835. doi: 10.1152/ajpendo.00085.2002. [DOI] [PubMed] [Google Scholar]
- 37.Marchesini G, Bianchi G, Rossi B, Muggeo M, Bonora E. Effects of hyperglycaemia and hyperinsulinaemia on plasma amino acid levels in obese subjects with normal glucose tolerance. Int J Obes Relat Metab Disord. 2000;24:552–558. doi: 10.1038/sj.ijo.0801195. [DOI] [PubMed] [Google Scholar]
- 38.Miller RH, Eisenstein RS, Harper AE. Effects of dietary protein intake on branched-chain keto acid dehydrogenase activity of the rat. Immunochemical analysis of the enzyme complex. The Journal of biological chemistry. 1988;263:3454–3461. [PubMed] [Google Scholar]
- 39.Mourier A, Bigard AX, de Kerviler E, Roger B, Legrand H, Guezennec CY. Combined effects of caloric restriction and branched-chain amino acid supplementation on body composition and exercise performance in elite wrestlers. Int J Sports Med. 1997;18:47–55. doi: 10.1055/s-2007-972594. [DOI] [PubMed] [Google Scholar]
- 40.Nadler ST, Stoehr JP, Schueler KL, Tanimoto G, Yandell BS, Attie AD. The expression of adipogenic genes is decreased in obesity and diabetes mellitus. Proc Natl Acad Sci U S A. 2000;97:11371–11376. doi: 10.1073/pnas.97.21.11371. [DOI] [PMC free article] [PubMed] [Google Scholar]
- 41.Nakai N, Kobayashi R, Popov KM, Harris RA, Shimomura Y. Determination of branched-chain alpha-keto acid dehydrogenase activity state and branched-chain alpha-keto acid dehydrogenase kinase activity and protein in mammalian tissues. Methods in enzymology. 2000;324:48–62. doi: 10.1016/s0076-6879(00)24218-3. [DOI] [PubMed] [Google Scholar]
- 42.Nellis MM, Doering CB, Kasinski A, Danner DJ. Insulin increases branched-chain alpha-ketoacid dehydrogenase kinase expression in Clone 9 rat cells. Am J Physiol Endocrinol Metab. 2002;283:E853–860. doi: 10.1152/ajpendo.00133.2002. [DOI] [PubMed] [Google Scholar]
- 43.Nishitani S, Takehana K, Fujitani S, Sonaka I. Branched-chain amino acids improve glucose metabolism in rats with liver cirrhosis. Am J Physiol Gastrointest Liver Physiol. 2005;288:G1292–1300. doi: 10.1152/ajpgi.00510.2003. [DOI] [PubMed] [Google Scholar]
- 44.Patterson BW, Horowitz JF, Wu G, Watford M, Coppack SW, Klein S. Regional muscle and adipose tissue amino acid metabolism in lean and obese women. Am J Physiol Endocrinol Metab. 2002;282:E931–936. doi: 10.1152/ajpendo.00359.2001. [DOI] [PubMed] [Google Scholar]
- 45.Paxton R, Kuntz M, Harris RA. Phosphorylation sites and inactivation of branched-chain alpha-ketoacid dehydrogenase isolated from rat heart, bovine kidney, and rabbit liver, kidney, heart, brain, and skeletal muscle. Arch Biochem Biophys. 1986;244:187–201. doi: 10.1016/0003-9861(86)90108-6. [DOI] [PubMed] [Google Scholar]
- 46.Rafecas I, Esteve M, Remesar X, Alemany M. Plasma amino acids of lean and obese Zucker rats subjected to a cafeteria diet after weaning. Biochem Int. 1991;25:797–806. [PubMed] [Google Scholar]
- 47.Roh C, Han J, Tzatsos A, Kandror KV. Nutrient-sensing mTOR-mediated pathway regulates leptin production in isolated rat adipocytes. Am J Physiol Endocrinol Metab. 2003;284:E322–330. doi: 10.1152/ajpendo.00230.2002. [DOI] [PubMed] [Google Scholar]
- 48.Schauder P, Zavelberg D, Langer K, Herbertz L. Sex-specific differences in plasma branched-chain keto acid levels in obesity. Am J Clin Nutr. 1987;46:58–60. doi: 10.1093/ajcn/46.1.58. [DOI] [PubMed] [Google Scholar]
- 49.Serra F, Pico C, Johnston J, Carnie J, Palou A. Opposite response to starvation of Trp/LNAA ratio in lean and obese Zucker rats. Biochem Mol Biol Int. 1993;29:483–491. [PubMed] [Google Scholar]
- 50.She P, Reid TM, Bronson SK, Vary TC, Hajnal A, Lynch CJ, Hutson SH. Disruption of BCATm in Mice Leads to Increased Energy Expenditure Associated with the Activation of a Futile Protein Turnover Cycle. Cell Metabolism. 2007;6 doi: 10.1016/j.cmet.2007.08.003. in press. [DOI] [PMC free article] [PubMed] [Google Scholar]
- 51.Shimomura Y, Obayashi M, Murakami T, Harris RA. Regulation of branched-chain amino acid catabolism: nutritional and hormonal regulation of activity and expression of the branched-chain alpha-keto acid dehydrogenase kinase. Curr Opin Clin Nutr Metab Care. 2001;4:419–423. doi: 10.1097/00075197-200109000-00013. [DOI] [PubMed] [Google Scholar]
- 52.Solini A, Bonora E, Bonadonna R, Castellino P, DeFronzo RA. Protein metabolism in human obesity: relationship with glucose and lipid metabolism and with visceral adipose tissue. J Clin Endocrinol Metab. 1997;82:2552–2558. doi: 10.1210/jcem.82.8.4182. [DOI] [PubMed] [Google Scholar]
- 53.Suryawan A, Hawes JW, Harris RA, Shimomura Y, Jenkins AE, Hutson SM. A molecular model of human branched-chain amino acid metabolism. Am J Clin Nutr. 1998;68:72–81. doi: 10.1093/ajcn/68.1.72. [DOI] [PubMed] [Google Scholar]
- 54.Sweatt AJ, Wood M, Suryawan A, Wallin R, Willingham MC, Hutson SM. Branched-chain amino acid catabolism: unique segregation of pathway enzymes in organ systems and peripheral nerves. Am J Physiol Endocrinol Metab. 2004;286:E64–76. doi: 10.1152/ajpendo.00276.2003. Epub 2003 Sep 2009. [DOI] [PubMed] [Google Scholar]
- 55.Turner SM, Linfoot PA, Neese RA, Hellerstein MK. Sources of plasma glucose and liver glycogen in fasted ob/ob mice. Acta Diabetol. 2005;42:187–193. doi: 10.1007/s00592-005-0201-3. [DOI] [PubMed] [Google Scholar]
- 56.Wijekoon EP, Skinner C, Brosnan ME, Brosnan JT. Amino acid metabolism in the Zucker diabetic fatty rat: effects of insulin resistance and of type 2 diabetes. Can J Physiol Pharmacol. 2004;82:506–514. doi: 10.1139/y04-067. [DOI] [PubMed] [Google Scholar]
- 57.Wu G, Knabe DA. Free and protein-bound amino acids in sow’s colostrum and milk. J Nutr. 1994;124:415–424. doi: 10.1093/jn/124.3.415. [DOI] [PubMed] [Google Scholar]
- 58.Yeaman SJ, Cook KG, Boyd RW, Lawson R. Evidence that the mitochondrial activator of phosphorylated branched-chain 2-oxoacid dehydrogenase complex is the dissociated E1 component of the complex. FEBS Lett. 1984;172:38–42. doi: 10.1016/0014-5793(84)80868-6. [DOI] [PubMed] [Google Scholar]
- 59.Zhang Y, Guo K, LeBlanc RE, Loh D, Schwartz GJ, Yu YH. Increasing dietary leucine intake reduces diet-induced obesity and improves glucose and cholesterol metabolism in mice via multimechanisms. Diabetes. 2007;56:1647–1654. doi: 10.2337/db07-0123. [DOI] [PubMed] [Google Scholar]
- 60.Zhao Y, Hawes J, Popov KM, Jaskiewicz J, Shimomura Y, Crabb DW, Harris RA. Site-directed mutagenesis of phosphorylation sites of the branched chain alpha-ketoacid dehydrogenase complex. J Biol Chem. 1994;269:18583–18587. [PubMed] [Google Scholar]


