

Abstract
Neuroimaging techniques such as positron emission topography (PET) and functional magnetic resonance imaging (fMRI) have been utilized with older children and adults to identify cortical sources of perceptual and cognitive processes. However, due to practical and ethical concerns, these techniques cannot be routinely applied to infant participants. An alternative to such neuroimaging techniques appropriate for use with infant participants is high-density EEG recording and cortical source localization techniques. The current paper provides an overview of a method developed for such analyses. The method consists of four steps: 1) recording high-density (e.g., 128-channel) EEG. 2) Analysis of individual participant raw segmented data with independent component analysis (ICA). 3) Estimation of equivalent current dipoles (ECDs) that represent cortical sources for the observed ICA component clusters. 4) Calculation of component activations in relation to experimental factors. We discuss an example of research applying this technique to investigate the development of visual attention and recognition memory. We also describe the application of “realistic head modeling” to address some of the current limitations of infant cortical source localization.
Developmental cognitive neuroscience is concerned with the brain areas that serve as sources for cognitive processes during development. The field has been historically limited in tools available for examining cortical activity in young participants. This is particularly the case for those involved in infant research due to ethical and practical concerns regarding the use of PET and fMRI with infant participants. An alternative is to record electrical activity on the scalp that is generated by neural activity within the head, i.e., the electroencephalogram (EEG). This measure is currently one of the most informative and useful tools available for research on infant neurocognitive development and has been widely used to examine early cognitive development.
One use of EEG is as a measure of cortical activity. The EEG measures electrical activity occurring on the scalp that is caused by changes in post-synaptic electrical potentials produced during cortical activity. However, measuring changes in the EEG at particular scalp locations does not provide solid evidence of the involvement of corresponding areas of the brain. The path an electrical current travels from origination at the source (or dipole) to observation on the scalp is not straightforward. Factors involved in determining the location and magnitude of the scalp potential recorded in the EEG include (but are not limited to) the depth, location, and orientation of the dipole, as well as the number of action potentials that sum together to form the dipole of interest. An additional factor is the type of tissue(s) that the potential passes through, with impedance (resistivity) values differing for white matter, gray matter, cerebrospinal fluid, skull matter, etc. The problem of inferring cortical sources from EEG recording thus has limited its use as a “functional neuroimaging” tool.
This paper details an approach to localizing cortical sources of infant EEG using methods of cortical source localization and inferring the basis of cognitive activity in the brain. This approach is based on existing methods used with adult participants that we have modified for use with infant participants (DeLorme, Makeig, Fabre-Thorpe, & Sejnowski, 2002; Jung, Makeig, Fabre-Thorpe, & Sejnowski., 2001b; Makeig, Bell, Jung, & Sejnowski, 1996; Makeig, Jung, Bell, Ghahremani, & Sejnowski, 1997; Richards, 2004 a; Scherg, 1990, 1992; Scherg & Picton, 1991; Huizenga & Molenaar, 1994). The method consists of four steps: 1) recording EEG activity with a high-density (128 channel) EEG system, 2) analysis of individual participant raw segmented EEG data with ICA, 3) estimation of ECDs, i.e., cortical sources of the scalp current composing the ICA component clusters, and 4) calculation of ICA component temporal activations in relation to experimental factors. We present an example of this technique applied in an investigation of cortical sources of infant attention and recognition memory (Reynolds & Richards, 2005). Additionally, we discuss an advanced technique Richards (2006, 2007a, 2007b) is developing for use with human infants that utilizes “realistic source models” based on structural MRIs obtained from individual infant participants and addresses some of the current limitations of infant cortical source localization. (Footnote 1)
High-Density EEG Recording
The first step in the procedure involves recording infant EEG. Cortical source localization requires a recording system that contains a large number of electrodes distributed evenly on the scalp (Johnson, de Haan, Oliver, Smith, Hatzakis, Tucker, & Csibra, 2001). The traditional international 10–20 and 10–10 electrode configurations (Jasper, 1958; Michel, Murray, Lantz, Gonzalez, Spinelli & Grave de Peralta, 2004; Pivik, Broughton, Coppola, Davidson, Fox, & Nuwer, 1993) do not meet these requirements. The "geodesic sensor net" developed by Don Tucker is an example of what has been called a high-density (or dense-array) configuration of electrodes (Electrical Geodesics Inc; Tucker, 1993; Tucker, Liotti, Potts, Russell, & Posner, 1994).
The high-density Electrical Geodesics Inc. (EGI) nets have 64, 128, or 256 electrodes evenly distributed across the scalp, providing interelectrode distances of 35 to 40 mm for adults and 20 to 25 mm for infants (Tucker, 1993). The EEG scalp sites composed within the geodesic configuration differ from the electrode placement sites of the International 10–20 system (Jasper, 1958; Pivik, Broughton, Coppola, Davidson, Fox, & Nuwer, 1993), but a rough correspondence can be made between them (Luu & Ferree, 2000; Srinivasan, Tucker, & Murias, 1998). Figure 1 shows the layout of the International 10–20 and 10–10 systems, as well as the layout of the 64 and 128 channel EGI systems. Because the sensor nets contain much greater numbers of electrodes than traditional systems, one can examine multiple sites that correspond to or surround sites of interest in the 10–20 system or 10–10 systems (for examples, see Reynolds, Courage, & Richards, under review; Reynolds & Richards, 2005). For a more detailed overview of the use of the EGI system with infant participants, the interested reader is referred to Johnson and colleagues (2001).
Figure 1.
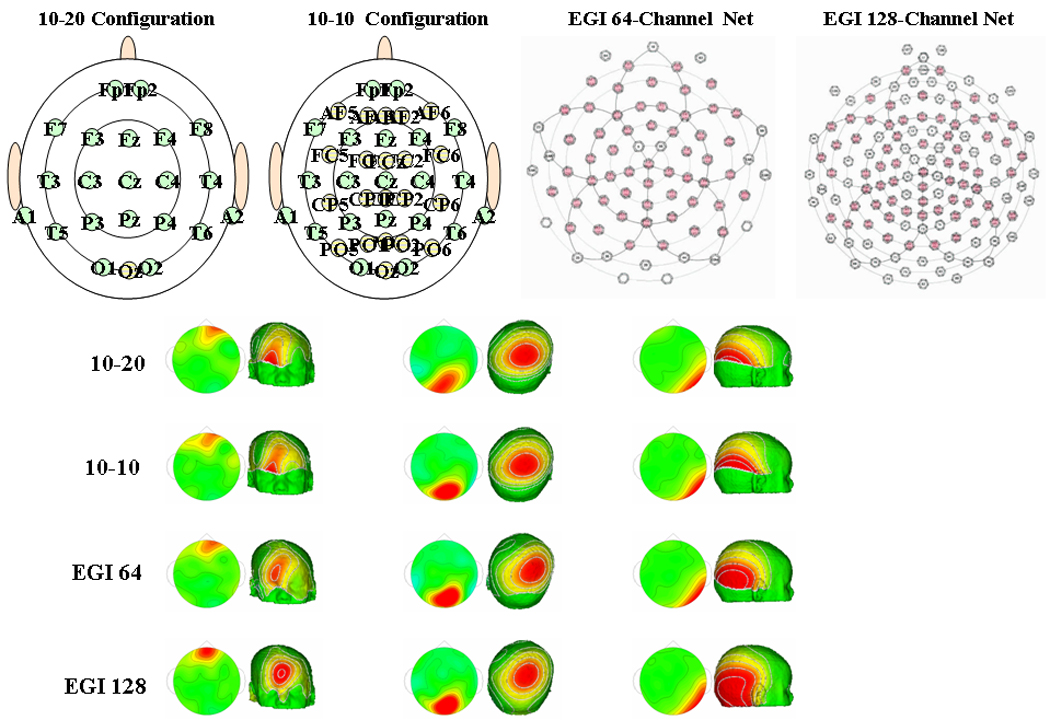
The layout of the International 10–20 and 10–10 systems, and the EGI 64 and 128 channel Geodesic Sensor Nets. The layout of electrodes for each of these systems is shown on the top panel. Topographical plots based on the same data are shown from each of these systems on the bottom panel.
The effect of the number of electrodes on the EEG recording also is shown in Figure 1. With the EGI system one can elect to only use or display data recorded from electrodes that coincide with the more traditional recording layouts. Figure 1 shows examples of topographical maps obtained from the four layouts of the same data recorded using the EGI 128 channel system. These data were recorded in an experiment that found presaccadic ERP activity over frontal electrodes (left panels) and occipital activities in response to a peripheral target (right panels; e.g., Richards, 2004b, 2005). In the example in the middle column, the EEG changes are occurring over the top of the head. All four recording configurations show this activity well. In the left and right columns, scalp potential activity is shown in which the anterior and posterior scalp leads near the boundary of the 10–20 system show significant activity. When the scalp potential covers anterior and posterior scalp regions or is widespread, the full distribution of the potential is not recorded by these traditional systems. These topographical maps demonstrate that recordings obtained from the International 10–20 and 10–10 systems sometimes do not provide an accurate representation of the distribution of the electrical scalp potential. With this in mind, the rationale behind the prerequisite of large numbers of evenly distributed electrodes prior to the application of cortical source localization is apparent. Although 64 channels may provide sufficient interelectrode distances, we suggest the use of the 128 channel EGI system for obtaining EEG data for the application of source localization techniques with infant participants. Once high-density EEG has been collected, the second step in the procedure involves component analysis of each individual participant’s raw EEG file.
Component Analysis of High-Density EEG Data
The EEG may be synchronized to specific environmental, internal, or physical events. Such potential changes related to a specific event are termed “event-related potentials (ERPs)”. The ERP is hypothesized to be a function of the cognitive or physiological activity surrounding the event. The event-related changes in EEG are small relative to the overall ongoing EEG activity. Thus, the ERP cannot be seen on a single trial because it is hidden by irrelevant EEG activity (signal-to-noise is low). However, the ERP activity is consistent across multiple events whereas irrelevant EEG activity is random. Thus, one way to identify the consistent activity is to average the EEG across a specifically defined time-window surrounding repeated presentations of the event of interest. ERP averaging increases the signal of the electrical potential related to the event over the noise inherent in EEG activity.
An alternative approach is to use component analysis (principal component analysis; independent component analysis) to identify the event-related activity on single trials. Principal component analysis (PCA) and independent component analysis (ICA) are multivariate component analysis approaches for identifying components within the EEG for source localization. A common assumption to both approaches is that the scalp current observed in the EEG is a linear combination of the activity of underlying sources, and that the underlying sources are spatially stable (Johnson et al., 2001; Makeig, Jung, Bell, Ghahremani, & Sejnowski, 1997). Other assumptions required for PCA (but not for ICA) may not be characteristic of EEG/ERP data. For example, PCA assumes the data fits the multivariate normal distribution, while this assumption is not required for ICA. PCA requires that successive components be orthogonal, whereas ICA allows for non-orthogonal components to be identified in the EEG (Richards, 2004a). This is particularly relevant when multiple components combine to form a functional neural network as opposed to operating independently in a modular manner (DeBoer, Scott, & Nelson, 2007). In this respect, ICA only assumes that individual components operate independently in time. An additional advantage of ICA over PCA is that ICA is more likely to identify components that may be modeled by single-dipole sources whereas PCA tends to identify components that must be modeled with multiple-dipole models (Richards, 2004a). Due to the greater flexibility and less constraints associated with ICA in comparison to PCA, we focus on the use of ICA to identify components in the scalp topography of the EEG. We also describe the analysis of the temporal activations of the ICA components in relationship to experimental effects in an analogous manner to ERP analysis of EEG data.
Independent Component Analysis
Independent component analysis involves a statistical linear decomposition of data into a set of components, with each of the components contributing as much distinct information as possible (Makeig, Debener, Onton, & Delorme, 2004). The analysis is done on the “raw segmented EEG” data rather than ERP averages. The procedures for performing independent component analysis with adult participant data have been outlined in previous work (DeLorme, Makeig, Fabre-Thorpe, & Sejnowski, 2002; Jung, Makeig, Fabre-Thorpe, & Sejnowski., 2001b; Makeig, Bell, Jung, & Sejnowski, 1996; Makeig, Jung, Bell, Ghahremani, & Sejnowski, 1997; Richards, 2004 a).
First, all EEG segments from a single participant are concatenated. The 128 scalp electrode sites are the variables for the analysis, resulting in the estimation of 128 components (DeLorme et al., 2002; Jung et al., 2001b). The observations are the ms intervals for which the EEG was sampled. Figure 2 shows a segmented EEG recording, a concatenated EEG data matrix, and an ICA component loading matrix. The loading weights are calculated using the extended-ICA algorithm developed by Lee, Girolami, and Sejnowski (1999), which uses sphering of the input matrix to aid in convergence, with an initial learning rate of .003. The extended-ICA algorithm programmed by Sigurd Enghoff in C++ is publicly available (see http://www.cnl.salk.edu/~enghoff/). The variance of the projection from each component is calculated, and the components with the largest projection variance are used for the analyses.
Figure 2.

A raw segmented EEG recording, EEG data matrix, and a ICA component loading matrix. The segmented EEG is shown to the left, with the EEG data matrix in center, and ICA component loading matrix to the right.
The ICA analysis results in component weights and activations for each component. The component weights represent the topographically coordinated activity in the EEG data. The spatial organization of these components is similar to topographical plots and can be displayed as such using a third-order spherical spline interpolation shown in a radial projection (Johnson et al., 2001; Jung, Makeig, Humphries, Lee, McKeown, Iragui, & Sejnowski, 2000a; Jung, Makeig, Lee, McKeown, Iragui, & Sejnowski, 2000b; Jung, Makeig, McKeown, Bell, Lee, & Sejnowski, 2001b; Jung, Makeig, Westerfield, Townsend, Courchesne, & Sejnowski, 2001a; Nunez, 1990; Perrin, Bertrand, & Pernier, 1987; Perrin, Pernier, Bertrand, & Echallier, 1989; Reynolds, Courage, & Richards, under review; Reynolds & Richards, 2005; Richards, 2002, 2004 a, 2005). The temporal morphology of the component is contained in the ICA activations and can be examined for each component along each point in the temporal sequence of the EEG segments. Similar to ERP waveforms, the activations are analyzed with factorial designs in relation to the experimental factors. The activations are multiplied by the standard deviations of the component loadings to standardize the variance of the activations. Additionally, one can multiply the inverse of the component weights with the activations to restore the raw segmented EEG data.
There are several benefits provided by the use of component analysis. The first benefit is that signal-to-noise ratio on single trials may be enhanced. Though the ERP activity signal-to-noise ratio is low, event-related activity generated from underlying sources creates a distinct spatial distribution across electrodes. The signal-to-noise ratio of this event-related spatial distribution is rather high on a single trial because of the distinctness of the event-related spatial distribution compared to the random spatial distribution of the non-event-related activity. Component analysis may be applied to single trials to extract this event-related activity. Further, the same source generates the same distinctive event-related spatial-distribution across multiple experimental trials. Thus, the signal of interest that is event-related may be discovered by using component analysis techniques to assess spatial distributions. The signal is extracted by the component analysis technique from an aggregation of single trials rather than averaging of single trials. All individual trials are concatenated instead of averaged together, thus the unique activity associated with each individual trial is not obscured through the averaging technique. Averaging ERP data may result in spatial-temporal smearing. Spatial-temporal smearing leads to inaccurate localization of cortical sources and inaccurate hypothesis testing of experimental effects.
A second benefit of component analysis is the potential to identify separate but overlapping components that contribute to a single ERP component (Michel et al., 2004; Reynolds & Richards, 2005). For example, the Negative central ERP component (Nc) is commonly identified in research on infant visual attention and recognition memory (see review by de Haan, 2007). The Nc is a negatively charged ERP component occurring approximately 400 – 700 ms after stimulus onset over frontal and midline leads (i.e., Fz and Cz).. Courchesne and colleagues (Courchesne 1977, 1978; Courchesne, Ganz, and Norcia, 1981) labeled this ubiquitous component the Negative central (Nc). This component has been found to be greater in amplitude to oddball versus standard stimuli, novel versus familiar stimuli, and the mother’s face versus a stranger’s face (Courchesne 1977, 1978; Courchesne, Ganz, and Norcia, 1981; de Haan & Nelson, 1997, 1999; Reynolds & Richards, 2005). Based upon their identification of two peaks in the Nc component, Hill-Karrer and colleagues speculated that Nc actually represents two separate neural processes (Hill-Karrer, Karrer, Bloom, Chaney, & Davis, 1998). Due to the averaging across multiple trials utilized in ERP studies, these overlapping processes are consistently identified as a single deflection in the ERP waveform and commonly referred to as a single, unitary ERP component. The proposal that Nc reflects two underlying neural processes was subsequently supported in a study utilizing ICA and source localization techniques (Reynolds & Richards, 2005). We expand upon this finding in greater detail in a subsequent section of the paper.
A third benefit of component analysis is the ability to perform cortical source localization on the component weights of the components identified in the ICA. ICA components that demonstrate spatial distributions and experimental effects similar to ERP components of interest can be localized to determine the likely cortical generators of those components measured on the scalp. The ICA component loadings are analyzed with “equivalent current dipole analysis” (ECD) to determine the fit between the weights describing the component and scalp current generated by hypothetical dipoles (DeLorme et al., 2002; Jung et al., 2001b; Michel et al, 2004; Scherg, 1990, 1992; Scherg & Picton, 1991; Huizenga & Molenaar, 1994).
Cortical Source Localization
The steps involved in an ECD analysis are illustrated in Figure 3. First, the actual EEG/ERP data is recorded from participants. Second, ECD analysis hypothesizes a dipole (or multiple dipoles) that could potentially generate an electrical current on the scalp that matches the scalp current observed in the actual EEG. Third, a forward solution is calculated that simulates a scalp current distribution that would be produced by the hypothetical dipole. Fourth, this forward solution is compared with the component weights obtained from the observed scalp potentials, and the hypothetical dipole location and magnitude (dipole moment) are then modified to minimize the difference between the generated current map and the component weights from the observed scalp potentials. The dipole moment is modified by optimization routines which attempt to find the best fit between the forward solution and the empirical data. Fifth, steps two through four are iterated until the hypothetical dipole is found that generates a scalp current distribution that best fits the component weights. We typically cluster components with similar topographical distribution and similar single-dipole model locations. This results in clusters of component loadings that are topographically similar and have similar ECD dipole locations. We use the EMSE computer program (Source Signal Imaging, San Diego, CA) for ECD analyses.
Figure 3.

The steps involved in an ECD analysis (top panel). ECD analysis hypothesizes a dipole (bottom panel) that generates an electrical current on the scalp. This forward solution is compared with the component weights obtained from the observed scalp potentials (middle panel), and the dipole location and magnitude are then modified to minimize the difference between the generated current map and the component weights.
Calculating the head shapes of individual participants plays an integral role in cortical source localization (Michel et al., 2004). In past studies, we have utilized a single structural MRI recording in our ECD analyses (Richards, 2003, 2004a, 2005; Reynolds & Richards, 2005). With this method, a structural MRI recording from a single 6-month-old participant was used and skull / scalp landmarks were measured from this participant’s MRI. The decision to use a single structural MRI was due to the fact that structural MRIs obtained from normal infant participants were not readily available. Given this restraint, we were fortunate to obtain an MRI recording from a six-month-old as we were examining cognitive development from 4.5 to 7.5 months of age. We are currently using an improved procedure in which we have a large database of available MRIs for different ages and head sizes, or, use individual participants’ MRIs for this (section, “Realistic Source Models with Infant Participants”).
We generated an electrode placement map for this individual based on their head measurements and the known locations of the EGI electrodes. When using a single structural MRI for source localization with multiple participants, the same external head measurements must be made for each participant in the study and electrode placement maps are then generated for each participant by transforming the placement map from the individual with the MRI recording according to the individual participant’s head measurements. The individualized placement map is then used for each individual participant’s ECD analysis. This serves to constrain the locations of the dipoles to a somewhat realistic topography based on the individual participant’s data. The coordinates of the ECDs for each participant are then translated into the coordinate space of the MRI recording for the 6-month-old, and MRI plots are based on these coordinates. The locations are also translated into saggital, coronal, and axial coordinates in the Talairach (Talairach & Tournoux, 1988) coordinate system. We use the MR Viewer (Signal Source Imaging, Inc) to display the ECDs from individual participants on the MRI from the 6-month-old participant.
Infant Visual Attention and Recognition Memory
We have used this cortical source localization technique in two investigations of infant visual attention and recognition memory (Reynolds, Courage, & Richards, under review; Reynolds & Richards, 2005). Recognition memory has been one of the most widely researched constructs in infant research utilizing ERPs. Early studies utilized an oddball procedure with a standard stimulus presented on 80% of the trials, and an oddball stimulus presented on 20% of the trials (e.g., Courchesne, 1977, 1988; Karrer & Ackles, 1987, 1988; Karrer & Monti, 1995; Nelson & Salapatek, 1986). As previously described, past studies have shown that the Nc component is larger in amplitude following infrequent or novel stimulus presentation when compared with frequent or familiar stimulus presentations (Courchesne, 1977; Karrer & Ackles, 1987, 1988; Karrer & Monti, 1995; Nikkel & Karrer, 1994; Reynolds & Richards, 2005). However, when comparing familiar stimuli that are emotionally relevant with novel stimuli (i.e., mother’s face vs. stranger’s face, favorite toy vs. novel toy), infants demonstrate greater amplitude Nc to the familiar but meaningful stimuli (de Haan & Nelson, 1997, 1999; see reviews, de Haan, 2007; de Haan, Johnson, & Halit, 2003). Richards (2003) found that Nc is greater in amplitude when heart rate is indicative of attention than when heart rate is indicative of inattention. Taken together, these findings indicate that Nc is related to attention and varies in amplitude based on stimulus salience. This point, coupled with the fact that Nc is ubiquitous in infant visual ERP research (de Haan, 2007), made it an ideal component for source localization.
To achieve this goal, we (Reynolds & Richards, 2005) conducted cortical source localization in a study utilizing the modified-oddball ERP procedure developed by Nelson and Collins (1991, 1992). Infants were first exposed to repeated presentations of two different stimuli. Participants were then exposed to one of the familiar stimuli on 60% of the trials (frequent familiar), the other familiar stimulus on 20% of the trials (infrequent familiar), and novel stimulus presentations on the remaining 20% of the trials (infrequent novel). A cross-sectional design was utilized to test infants at 4.5, 6, and 7.5 months of age. Scalp-recorded ERP was used to examine the Nc ERP component, and the cortical source of this component. We predicted that areas of prefrontal cortex including the anterior cingulate region would be associated with the Nc component. This prediction was based on the location of Nc over frontal and midline scalp locations, and the association of Nc with attention and stimulus salience. The anterior cingulate and dorsolateral regions of prefrontal cortex are involved in recognition memory and in the voluntary control of attention ( e.g., Coull, Frith, Frackowiak, & Grasby, 1996; Haxby, Ungerleider, Horwitz, Maisog, Rapoport, & Grady, 1996; Klingberg & Roland, 1998; Owen, Milner, Petrides, & Evans, 1996; Rugg, Fletcher, Chua, & Dolan, 1999; Slotnick, Moo, Segal, & Hart, 2003).
The recorded EEG segments were analyzed with the ICA. We identified two ICA components that we believe contribute to the Nc ERP component. First, an ICA component composed of dipoles primarily located in the superior frontal gyrus (BA 10) was found that was spatially similar to Nc and demonstrated some similarity in temporal activation. We labeled this the frontal pole component. This ICA component did not demonstrate similar experimental effects to the Nc ERP component. The component activations were not influenced by stimulus type. Additionally, only 67 individual participant’s dipoles fell in this component cluster. The Nc ERP component is widespread across participants, and was significantly affected by stimulus type in this experimental context. Second, a predominant ICA component pattern common over the infants in the study was one that had loadings widely distributed over midline, and frontal-anterior electrode sites. Figure 4 shows this pattern. We labeled this component the prefrontal component. We believe the prefrontal ICA component represents the main source of the Nc ERP component. This component was composed of 389 individual participant dipoles. The ICA components representing this pattern were analyzed with cortical source analysis. Figure 4 uses a series of MRI slices to display ECDs from this ICA component cluster. There was a wide scattering of ECDs located throughout areas of the prefrontal cortex. The majority of dipoles from individual participants were localized to the inferior frontal cortex (e.g., BA 11), medial frontal gyrus (BA 25), superior frontal gyrus (BA 6, 8, 10); and the anterior cingulate region (BA 24, 32) to a lesser extent. This component did include dipoles located in frontopolar regions (e.g., BA 10); however, the peak latency and overall shape of the activation waveforms were distinct from that of the previously described frontal pole component. Because the frontal pole and prefrontal clusters did overlap in time, we concluded that the frontal pole and prefrontal clusters both contribute to the Nc ERP component. However, due to the fact that it was widespread across individual participants in comparison to the frontal pole cluster, we assumed the prefrontal cluster must account for the majority of the variance in the EEG commonly identified as Nc.
Figure 4.

The ICA component cluster for the prefrontal component. The topographical map of the average ICA loadings are similar to the topographical map of the grand average ERP of the Nc component. The ECD locations are displayed on several MRI slices, and each location represents an ICA from one individual. The MRI image has been modified from radiologic convention, and thus the sides of the image coincide with the actual location of the dipoles (i.e., the MRI is not a mirror image with sides reversed).
We analyzed the activation of the component from 400 to 800 ms following stimulus onset. Similar to the Nc, the peak amplitude of the activation of this prefrontal component was significantly affected by attention and stimulus type. Infants demonstrated greater amplitude activations when heart rate was indicative of attention following novel stimulus exposures, but no differences based on attention were found following familiar stimulus exposures. This finding is consistent with a novelty-detection function for the processes generating the Nc ERP component. Adult neuroimaging studies using PET and fMRI have also shown that in addition to areas of medial temporal cortex, and areas of frontal cortex including the anterior cingulate occurs during tasks related to attention and recognition memory (e.g., Coull, Frith, Frackowiak, & Grasby, 1996; Haxby, Ungerleider, Horwitz, Rapoport, & Grady, 1995; Klingberg & Roland, 1998; Owen, Milner, Petrides, & Evans, 1996; Rugg, Flethcher, Chua, & Dolan; 1999; Slotnick, Moo, Segal, & Hart, 2003). The consistency of our findings with those found in the adult neuroimaging literature supports the validity of this method of cortical source localization, and perhaps more importantly demonstrates its efficacy as a technique that can be used with infant participants. Figure 4 also illustrates the important contribution of source localization. Although the topographical ERP plots indicate that the Nc is slightly lateralized to the left of midline, the majority of dipoles that were localized fell slightly to the right of midline. Thus the orientation of the dipoles projected the electrical potential to a location of the scalp that is misleading as far as assumptions regarding laterality of the cortical generators of Nc.
Realistic Source Models with Infant Participants
The previously described study demonstrates the validity of this technique of infant cortical source localization. However, there are limitations to infant cortical source localization that must be addressed. The previously described cortical source localization model is based on parameters for use with adult participants. Specifically, the forward solution uses impedance values for cortical matter, skull, and scalp of adult participants. These impedance values are certainly different for infant participants. For example, infants’ scalps are not as thick as adults’ scalps resulting in less impedance. Infants’ skulls are thinner and less dense when compared with adults, again resulting in much lower impedance. Another interesting and relevant point is that the infant skull has areas of current leakage. Infants have portions of the head where the skull is not present but the brain is protected by a thick dura (“fontanels”). The sutures between several skull bones are not totally mended at birth so the head may deform going through the birth canal and the unclosed sutures can be wide near the fontanels; these sutures do not mend entirely for several years. The fontanels and unmended skull sutures allow current flow to the scalp unimpeded by the skull, thus it may not be sufficient to simply take into account conductivity and topographical differences of infants. Adult values of impedance are higher than those in infants, and this may have the effect of inferring the source of the current on infant participants as being deeper in the cortex than where it actually occurred. Additionally, we used a structural MRI from a single 6-month-old participant, and generated an electrode placement map based on this individual’s head measurements. This individual placement map was then transformed to match the head measurements of each participant. Although this technique constrains the locations of the dipoles to a somewhat realistic topography for each participant, obtaining structural MRIs for each individual infant would be ideal especially given the large amount of variability across infants in head size and shape. In this section, we describe a technique Richards (2006, 2007a) is currently developing for realistic source localization using infant participants (for an example using adult participants, see Richards, 2007b).
One issue that is of great concern is the conductivity values for tissue types in the infant head. The analysis of cortical sources of scalp-recorded electrical potentials requires accurate knowledge of the conductance of the media in the head (Awada, Jackson, Baumann, Williams, Winton, Fink, & Prasky, 1998; Haueisen, Ramon, Eiselt, Brauer, & Nowak, 1997; Stok, 1987). This has been done for adults in several studies (see brief review, Richards, 2006). However, the conductivity of the skull and scalp are different in infants. The skull is less dense and thinner. The density of the skull is the primary factor in determining its conductivity, so that infant skulls will be far less resistive than adults. The scalp has fewer dead skin cells, so that impedance values for infants are much less than adults. The conductivity values for infant head materials have not been studied, probably because there has been little medical value to such knowledge. It might be possible to estimate values with electrical impedance tomography or other recording techniques. The effect of the impedance of infant head materials on dipole localization in cortical source analysis could be addressed by systematically varying these values in programs used for cortical source localization.
Two approaches might be used to solve these problems. One approach is to develop a standard MRI map based on a series of MRIs of infant participants (e.g., Talairach space,[Talairach & Tournoux, 1988], Montreal Neurological Institute brain atlas[Evans, Collins, & Milner, 1992; Evans, Collins, Mills, Brown, Kelly, & Peters, 1993; Mazziota, Toga, Evans, Fox, & Lancaster, 1995]) which can then be used as a standardized atlas for computer programs (e.g., Talairach Atlas Database Daemon[Fox & Uecker, 2005; Lancaster, Summerlin, Rainey, Freitas, & Fox, 1997; Lancaster, Woldorf, Parsons, Liotti, Freitas, Rainey, Kochunov, Nickerson, Mikiten, & Fox, 2000]). Then, realistic models based on infant head topography could be developed and resistance values for infant head media could be used. Thus, the scalp potential maps, current source density maps, and dipole localizations, may be mapped onto actual structures by aligning the ERP information onto MR maps of infants of similar ages and head sizes. However, this approach has some limits, a generic model or utilization of an MRI from a selected representative infant would not account for the specific topographical properties of an individual infant, such as the extent and location of unmended bone seams.
There is an ongoing (October, 2008) study that is being done to obtain a library of MRIs of infant participants. This is the “NIH MRI study of normal brain development” (NIH, 1998; Almli, Rivkin, & McKinstry, 2007; Evans, 2006). This study is a multi-center research project sponsored by the National Institutes of Health and is doing 1.5T anatomical MRIs for participants from 0 to 18 years of age. The MRIs for the children (ages 4.5 to 18) are already available (http://www.bic.mni.mcgill.ca/nihpd/info/). This project is currently working on the collection and analysis of MRIs for infant participants. These MRIs could be used to make 3-D finite element model wireframes that may be used in computer programs (BESA, EMSE) for dipole source localization. This data set could provide a generic “age-appropriate” MRI model that may provide a realistic generic infant head. Finally, this database could also potentially be used to select specific MRIs based on head size and shape that are the best match for infants being tested in a high-density EEG/ERP experiment.
A second approach that more adequately addresses the current limitations of cortical source modeling is to use anatomical MRIs from individual infant participants. These infants would then participate in typical infant EEG/ERP psychophysiological experiments. The validity of the cortical source modeling could then be tested with realistic models of individual participants using their own MRIs to provide realistic anatomical values and appropriate constraints for modeling their psychophysiological ERP data. This approach uses the participant’s actual MRI for cortical source localization rather than using an age-appropriate generic model or selected individual MRI that is the closest match.
We are currently using this approach. High resolution 3D T1-weighted scans are typically used to produce suitable anatomical scans of adult brains (e.g., 3D Magnetization Prepared Rapid Acquisition with Gradient Echoes, MPRAGE). We are doing such scans with infant participants. Infants in these scans cannot be sedated because they are research participants rather than clinical cases, so infants are scanned during sleeping. Previous studies from several laboratories have described procedures for doing MRI recording of non-sedated infants with success rates that range from 66% to 90% (e.g., Almli et al., 2007; Dehaene-Lambertz, Dehaene, & Hertz-Pannier, 2002; Evans, 2006; Gilmore et al., 2004; Paterson, Badridze, Flax, Liu, & Benasich, 2004; Sury, Harker, Begent, & Chong, 2005). We are doing both T1- and T2-weighted scans, since both may be necessary for white matter-gray matter segmentation with infant participants (Gilmore, Zhai, Wilber, Smith, Lin, & Gerig, 2004; Williams, Gelman, Picot, Lee, Ewing, Han, & Thompson, 2005).
We have begun an analysis of cortical sources with realistic models for infant participants. First, the raw MRI images must be segmented to identify the component media inside the head, including scalp, skull, dura/meninges between skull and CSF, CSF, white matter, gray matter, eyes, and muscle. Figure 5 shows an anatomical MRI of a 6.5 month old and the segmented sections. The MRI images can be transformed into Analyze format and the “VMI” format for the EMSE MR Viewer. These images can be used to do head/brain segmenting. This is done with the EMSE MR Viewer both with automatic GUI-wizard procedures and with manual adjustment. The segmentation can be done taking into account the unique properties of the infant brain vis-à-vis adult parameters (Evans, 2006; Prastawa, Gilmore, Lin, & Gerig, 2005). Second, the segmented media can be used to calculate a high-resolution 3-D wireframe model that contains the location of individual elements of a finite element model with location and media type. This can also be done with the MR Viewer program. After these two steps, the resultant wireframes can be used in one of three computer programs for realistic source analysis.
Figure 5.

An anatomical MRI of a 6.5 month old (top left panel) is shown with segmented sections (top middle panel). The top right panel displays a high-resolution 3-D wireframe model used for finite element model (FEM) analysis. In the bottom right panel, dipoles are shown resulting from a 3-shell model analysis (green points), and two separate FEM model analyses (red and yellow points). The topographical plots of the ERP component of interest are shown in the bottom left panel.
The BESA and EMSE computer programs have standard boundary element model and finite element model routines for doing cortical source models. However, these models are based on adult participants (e.g., adult resistance values; using adult standardized MRI models) and are not currently sufficient. Richards (2006) has developed a computer program that will calculate the forward model resistance pathways for the FEM wireframes and will do realistic cortical source models with a wide variety of options. This computer program is being adapted for use with the realistic topographies of infant heads, with resistance values for head media based on infant values, and with topographies or modeling identifying unique characteristics of infant heads (e.g., unmended skull bone boundaries, fontanels). The limitations of infant cortical source localization specifically related to using generic models or adult impedance values are addressed through the use of this proposed procedure; however, further testing and validation are required to establish the reliability of this technique. Figure 5 shows a cortical source model for a presaccadic ERP component (Richards, 2005) that shows different dipoles localized with FEM realistic models than with a traditional sphere model (3-shell model). It can be seen that the dipoles resulting from two separate FEM analyses occur deeper in the cortex than those resulting from the 3-shell model. This is due to the use of adult impedance values in the 3-shell model that are higher than impedance values based on infant anatomical structures used in FEM models.
Summary
In recent decades, researchers have utilized EEG and ERP to greatly enhance the scientific community’s understanding of infant cognitive development. Although this research has provided valuable information regarding the electrical scalp current demonstrated by infants during certain cognitive tasks, conclusions regarding cortical sources of those scalp currents are highly limited. In this paper, we present a quantitative method for localizing cortical sources of infant cognitive activity. This method involves four steps: 1) recording high-density EEG, 2) extracting components from the raw segmented EEG data of individual participants using independent component analysis (ICA) or principal components analysis (PCA), 3) estimating equivalent current dipoles for the observed component loading weights, and 4) examining the component activations in relation to experimental factors. We believe this approach to infant cortical source localization holds great promise for future research on cognitive development.
There are several advantages to this approach. For example, ICA decomposes the variance in EEG data by identifying topographical units (i.e., ICA components) based on the simultaneous activation of discrete cortical areas via its co-occurrence in the spatial coordinates of the electrodes. The ICA components that represent noise in the EEG data can then be eliminated prior to ERP analysis. This preprocessing of the EEG provides greater stability in the data (Richards, 2004a). ICA also provides the potential to separate overlapping components associated with activity in different cortical areas that may appear to be a single component when analyzing grand average ERPs. The greatest advantage provided by this approach is the ability to perform cortical source localization on the ICA component loadings.
For example, we have shown that the Nc ERP component can be separated into two distinct ICA components generated by separate areas within prefrontal cortex (Reynolds & Richards, 2005). One of these components is sensitive to novelty, and is generated by dipoles spread throughout inferior and medial areas of prefrontal cortex as well as anterior cingulate areas to a lesser extent. The other component is generated specifically by dipoles in the frontal pole, and is not sensitive to novelty. Our analysis allowed us to identify these distinct components, analyze the experimental effects associated with each component, conclude which component most likely represents the ubiquitous Nc ERP component, and localize the brain areas that generate the Nc. This was the first study to successfully localize cortical sources of infant cognitive processing.
When compared with alternative neuroimaging techniques, one of the major advantages of EEG/ERP data analysis is the temporal specificity obtained from the high sampling rate. The combined use of EEG/ERP and cortical source localization provides the most precise temporal and spatial localization of cognitive processing available to date. Although fMRI and Near-Infrared Optical Topography are useful techniques for source localization, the sampling rates are inferior to EEG/ERP data. Thus, one is limited in identifying precise points in time when each brain area is active. This is particularly significant when analyzing cognitive functions associated with activity in cortical networks (Michel et al., 2004). The timing of activation of each cortical source composing the network would be lost due to the poor sampling rate. Furthermore, practical and ethical concerns preclude the use of fMRI with normal infant populations.
For these reasons, the cortical source localization procedure we present represents the most promising approach to identifying cortical areas involved in cognitive processing within the brain of the human infant. The consistency between findings from recent infant cortical source localization studies and previous adult research utilizing PET and fMRI on similar tasks supports the validity of this method for use with infant participants. At this early stage in infant cortical source localization, future studies should be designed that allow for comparison of results with fMRI or PET neuroimaging studies in older children or adults Finally, Richards (2006, 2007a) is developing a realistic source localization technique for use with infant participants that addresses some of the current limitations of infant cortical source localization. Thus, we are no longer as highly constrained in conclusions that can be made regarding the cortical sources of infant cognitive activity.
Footnotes
An excellent review of adult EEG source imaging may be found in Michel et al., 2004. This reviews problems such as the correct number of electrodes, electrode reference, choice of methods for inverse techniques, the forward model problem, and integrating MRI with EEG for source localization. This review is referenced in appropriate places in the current text.
References
- Almli CR, Rivkin MJ, McKinstry RC. The NIH MRI study of normal brain development (Objective-2): Newborns, infants, toddlers, and preschoolers. Neuromage. 2007;35:308–325. doi: 10.1016/j.neuroimage.2006.08.058. [DOI] [PubMed] [Google Scholar]
- Awada KA, Jackson DR, Williams JT, Wilton DR, Baumann SB, Papanicolaou AC. Computational aspects of finite element modeling in EEG source localization. IEEE Transactions on Biomedical Engineering. 1997;44:736–752. doi: 10.1109/10.605431. [DOI] [PubMed] [Google Scholar]
- Coull JT, Frith CD, Fackowiak RSJ, Grasby PM. A fronto-parietal network for rapid visual information processing: A PET study of sustained attention and working memory. Neuropsychologia. 1996;34:1085–1095. doi: 10.1016/0028-3932(96)00029-2. [DOI] [PubMed] [Google Scholar]
- Courchesne E. Event-related brain potentials: Comparison between children and adults. Science. 1977;197:589–592. doi: 10.1126/science.877575. [DOI] [PubMed] [Google Scholar]
- Courchesne E. Neurophysiological correlates of cognitive development: Changes in long-latency event-related potentials from childhood to adulthood. Electroencephalography and Clinical Neurophysiology. 1978;45:468–482. doi: 10.1016/0013-4694(78)90291-2. [DOI] [PubMed] [Google Scholar]
- Courchesne E, Ganz L, Norcia AM. Event-related brain potentials to human faces in infants. Child Development. 1981;52:804–811. [PubMed] [Google Scholar]
- DeBoer T, Scott LS, Nelson CA. Methods for acquiring and analyzing infant event-related potentials. In: de Haan M, editor. Infant EEG and Event-Related Potentials. New York: Psychology Press; 2007. [Google Scholar]
- de Haan M. Visual attention and recognition memory in infancy. In: de Haan M, editor. Infant EEG and Event-Related Potentials. New York: Psychology Press; 2007. [Google Scholar]
- Dehaene-Lambertz G, Dehaene S, Hertz-Pannier L. Functional Neuroimaging of Speech Perception in Infants. Science. 2002;298:2013–2015. doi: 10.1126/science.1077066. [DOI] [PubMed] [Google Scholar]
- DeLorme A, Makeig S, Fabre-Thorpe M, Sejnowski T. From single-trial EEG to brain area dynamics. Neurocomputing. 2002;44–46:1057–1064. [Google Scholar]
- Donchin E, Ritter W, McCallum WC. Cognitive psychophysiology: The endogenous components of the ERP. In: Callaway E, Tueting P, Koslow SH, editors. Brain event-related potentials in man. New York: Academic Press; 1978. [Google Scholar]
- Eimer M. ERP modulations indicate the selective processing of visual stimuli as a result of transient and sustained spatial attention. Psychophysiology. 1996;33:13–21. doi: 10.1111/j.1469-8986.1996.tb02104.x. [DOI] [PubMed] [Google Scholar]
- Eimer M. Attentional selection and attentional gradients: An alternative method for studying transient visual-spatial attention. Psychophysiology. 1997;34:365–376. doi: 10.1111/j.1469-8986.1997.tb02407.x. [DOI] [PubMed] [Google Scholar]
- Evans AC. The NIH MRI study of normal brain development. NeuroImage. 2006;30:184–202. doi: 10.1016/j.neuroimage.2005.09.068. [DOI] [PubMed] [Google Scholar]
- Evans AC, Collins DL, Milner B. An MRI-based stereotactic atlas from 250 young normal subjects. Journal of the Society for Neuroscience Abstracts. 1992;18:408. [Google Scholar]
- Evans AC, Collins DL, Mills SL, Brown ED, Kelly RL, Peters TM. 3D statistical neuroanatomical models from 305 MRI volumes. Proceedings of the IEEE-Nuclear Science Symposium and Medical Imaging Conference. 1993:1813–1817. [Google Scholar]
- Fabiani M, Gratton G, Coles MGH. Event-related brain potentials: Methods, theory, and applications. In: Cacioppo JT, Tassinary LG, Berntson GG, editors. Handbook of psychophysiology. New York: Cambridge University Press; 2000. pp. 53–84. [Google Scholar]
- Fox M, Uecker A. Talairach daemon client. San Antonio, TX: University of Texas Health Sciences Center; 2005. http://ric.uthscsa.edu/projects/talairachdaemon.html. [Google Scholar]
- Gilmore JH, Zhai G, Wilber K, Smith JK, Lin W, Gerig G. 3 Tesla magnetic resonance imaging of the brain in newborns. Neuroimaging. 2004;132:81–85. doi: 10.1016/j.pscychresns.2004.04.004. [DOI] [PubMed] [Google Scholar]
- Haueisen J, Ramon C, Eiselt M, Brauer H, Nowak H. Influence of tissue resistivities on neuromagnetic fields and electric potentials studied with a finite element model of the head. IEEE Transactions on Biomedical Engineering. 1997;44(no 8):727–735. doi: 10.1109/10.605429. [DOI] [PubMed] [Google Scholar]
- Haxby JV, Ungerleider LG, Horwitz B, Maisog JM, Rapoport SL, Grady CL. Face encoding and recognition in the human brain. Proceeding of the National Academy of Sciences. 1995;93:922–927. doi: 10.1073/pnas.93.2.922. [DOI] [PMC free article] [PubMed] [Google Scholar]
- Hill-Karrer J, Karrer R, Bloom D, Chaney L, Davis R. Event-related brain potentials during an extended visual recognition memory task depict delayed development of cerebral inhibitory processes among 6-month-old infants with Down syndrome. International Journal of Psychophysiology. 1998;29:167–200. doi: 10.1016/s0167-8760(98)00015-4. [DOI] [PubMed] [Google Scholar]
- Hillyard SA, Mangun GR, Woldroff MG, Luck SJ. Neural systems mediating selective attention. In: Gazzaniga MS, editor. Cognitive neurosciences. Cambridge, MA: MIT; 1995. pp. 665–682. [Google Scholar]
- Huizenga HM, Molenaar PCM. Estimating and testing the sources of evoked potentials in the brain. Multivariate Behavioral Research. 1994;29:237–262. doi: 10.1207/s15327906mbr2903_3. [DOI] [PubMed] [Google Scholar]
- Jasper HH. The ten-twenty electrode system of the International Federation. Electroencephalography and Clinical Neurophysiology. 1958;10:371–375. [PubMed] [Google Scholar]
- Johnson MH, de Haan M, Oliver A, Smith W, Hatzakis H, Tucker LA, Csibra G. Recording and analyzing high-density event-related potentials with infants using the Geodesic Sensor Net. Developmental Neuropsychology. 2001;19:295–323. doi: 10.1207/S15326942DN1903_4. [DOI] [PubMed] [Google Scholar]
- Jung T-P, Makeig S, Humphries C, Lee T-W, McKeown MJ, Iragui V, Sejnowski TJ. Removing electroencephalographic artifacts by blind source separation. Psychophysiology. 2000a;37:163–178. [PubMed] [Google Scholar]
- Jung T-P, Makeig S, Lee T-W, McKeown MJ, Brown G, Bell AJ, Sejnowski TJ. Independent component analysis of biomedical signals. The 2nd International Workshop on Independent Component Analysis and Source Separation. 2000b:633–644. [Google Scholar]
- Jung TP, Makeig S, McKeown MJ, Bell AJ, Lee TW, Sejnowski T. Imaging brain dynamics using independent component analysis. Proceedings of the IEEE. 2001a;89:1107–1122. doi: 10.1109/5.939827. [DOI] [PMC free article] [PubMed] [Google Scholar]
- Jung TP, Makeig S, Fabre-Thorpe M, Sejnowski i TJ. Analysis and visualization of single-trial event-related potentials. Human Brain Mapping. 2001b;14:166–185. doi: 10.1002/hbm.1050. [DOI] [PMC free article] [PubMed] [Google Scholar]
- Karrer R, Ackles PK. Visual event-related potentials of infants during a modified oddball procedure. In: Johnson R, Rohrbaugh JW, Parasuraman R, editors. Current trends in event-related potential research. Amsterdam: Elsevier Science Publishers; 1987. pp. 603–608. [Google Scholar]
- Karrer R, Ackles PK. Brain organization and perceptual/cognitive development in normal and Down syndrome infants: A research program. In: Vietze P, Vaughan HG Jr, editors. The early identification of infants with developmental disabilities. Philadelphia: Grune & Stratton; 1988. pp. 210–234. [Google Scholar]
- Karrer R, Monti LA. Event-related potentials of 4–7 week-old infants in a visual recognition memory task. Electroencephalography and Clinical Neurophysiology. 1995;94:414–424. doi: 10.1016/0013-4694(94)00313-a. [DOI] [PubMed] [Google Scholar]
- Klingberg T, Roland PE. Right-prefrontal activation during encoding, but not retrieval, in a non-verbal paired-associates task. Cerebral Cortex. 1998;8:73–79. doi: 10.1093/cercor/8.1.73. [DOI] [PubMed] [Google Scholar]
- Lancaster JL, Summerln JL, Rainey L, Freitas CS, Fox PT. The Talairach Daemon, a database server for Talairach Atlas Labels. Neuroimage. 1997;5:S633. [Google Scholar]
- Lancaster JL, Woldorff MG, Parsons LM, Liotti M, Freitas CS, Rainey L, Kochunov PV, Nickerson D, Mikiten SA, Fox PT. Automated Talairach Atlas labels for functional brain mapping. Human Brain Mapping. 2000;10:120–131. doi: 10.1002/1097-0193(200007)10:3<120::AID-HBM30>3.0.CO;2-8. [DOI] [PMC free article] [PubMed] [Google Scholar]
- Lee TW, Girolami M, Sejnowski TJ. Independent component analysis using an extended infomax algorithm for mixed subgaussian and supergaussian sources. Neural Computing. 1999;11:417–441. doi: 10.1162/089976699300016719. [DOI] [PubMed] [Google Scholar]
- Luu P, Ferree T. Determination of the Geodesic Sensor Nets’ electrode positions and their 10–10 international equivalents. Eugene, OR: Technical note, Electrical Geodesics, Inc.; 2000. [Google Scholar]
- Makeig S, Bell AH, Jung TP, Sejnowski TJ. Independent component analysis of electroencephalographic data. Advances in Neural Information Processing Systems. 1996;8:145–151. [Google Scholar]
- Makeig S, Debener S, Onton J, Delorme A. Mining event-related brain dynamics. Trends in Cognitive Sciences. 2004;8:204–210. doi: 10.1016/j.tics.2004.03.008. [DOI] [PubMed] [Google Scholar]
- Makeig S, Jung TP, Bell AH, Ghahremani D, Sejnowski TJ. Blind separation of auditory event-related brain responses into independent components. Proceedings of the National Academy of Sciences. 1997;94:10979–10984. doi: 10.1073/pnas.94.20.10979. [DOI] [PMC free article] [PubMed] [Google Scholar]
- Martinez A, Anllo-Vento L, Sereno MI, Frank LR, Buxton RB, Dubowitz DJ, Wong EC, Hinrichs H, Heinze HJ, Hillyard SA. Involvement of striate and extrastriate visual cortical areas in spatial attention. Nature Neuroscience. 1999;2:364–369. doi: 10.1038/7274. [DOI] [PubMed] [Google Scholar]
- Mazziotta JC, Toga AW, Evans A, Fox P, Lancaster J. A Probablistic Atlas of the Human Brain: Theory and Rationale for Its Development. NeuroImage. 1995;2:89–101. doi: 10.1006/nimg.1995.1012. [DOI] [PubMed] [Google Scholar]
- Michel CM, Murray MM, Lantz G, Gonzalez S, Spinelli L, Grave de Peralta R. EEG source imaging. Clinical Neurophysiology. 2004;115:2195–2222. doi: 10.1016/j.clinph.2004.06.001. [DOI] [PubMed] [Google Scholar]
- Nelson CA, Collins PF. Event-related potential and looking-time analysis of infants' responses to familiar and novel events: Implications for visual recognition memory. Developmental Psychology. 1991;27:50–58. [Google Scholar]
- Nelson CA, Collins PF. Neural and behavioral correlates of visual recognition memory in 4-and 8-month-old infants. Brain and Cognition. 1992;19:105–121. doi: 10.1016/0278-2626(92)90039-o. [DOI] [PubMed] [Google Scholar]
- Nelson CA, Salapatek P. Electrophysiological correlates of infant recognition memory. Child Development. 1986;57:1483–1497. [PubMed] [Google Scholar]
- NIH. Pediatric study centers (PSC) for a MRI study of normal brain development. National Institute of Mental Health, National Institute of Child Health and Human Development; NIH RFP NIHNINDS-98-13, sponsored by National Institute of Neurological Disorders and Stroke. 1998
- Nunez PL. Localization of brain activity with electroencephalography. Advances in Neurology. 1990;54:39–65. [PubMed] [Google Scholar]
- Owen AM, Milner B, Petrides M, Evans AC. Memory for object features vs. memory for object location: A positron-emission tomography study of encoding and retrieval processes. Proceedings of the National Academy of Sciences. 1996;93:9212–9217. doi: 10.1073/pnas.93.17.9212. [DOI] [PMC free article] [PubMed] [Google Scholar]
- Paterson SJ, Badridze N, Flax JF, Liu W-C, Benasich AA. A method for structural MRI scanning of non-sedated infants; International Conference for Infancy Studies; Chicago, IL. 2004. [Google Scholar]
- Perrin F, Bertrand O, Pernier J. Scalp current density mapping: Value and estimation from brain data. IEEE Transactions on Biomedical Engineering. 1987;34:283–288. doi: 10.1109/tbme.1987.326089. [DOI] [PubMed] [Google Scholar]
- Perrin F, Pernier J, Bertrand O, Echallier JF. Spherical splines for scalp potential and current density mapping. Electroencephalography and Clinical Neurophysiology. 1989;72:184–187. doi: 10.1016/0013-4694(89)90180-6. [DOI] [PubMed] [Google Scholar]
- Pivik RT, Broughton RJ, Coppola R, Davidson RJ, Fox N, Nuwer MR. Guidelines for the recording and quantitative analysis of electroencephalographic activity in research contexts. Psychophysiology. 1993;30:547–588. doi: 10.1111/j.1469-8986.1993.tb02081.x. [DOI] [PubMed] [Google Scholar]
- Prastawa M, Gilmore JH, Lin W, Gerig G. Automatic segmentation of MR images of the developing newborn brain. Medical Image Analysis. 2005;9:457–466. doi: 10.1016/j.media.2005.05.007. [DOI] [PubMed] [Google Scholar]
- Rafal RD. The neurology of visual orienting: A pathological disintegration of development. In: Richards JE, editor. Cognitive neuroscience of attention: A developmental perspective. Hillsdale, NJ: Lawrence Erlbaum Press; 1998. pp. 181–218. [Google Scholar]
- Reynolds GD, Courage M, Richards JE. Infant visual preferences within the modified-oddball ERP paradigm. (under review) [Google Scholar]
- Reynolds GD, Richards JE. Familiarization, attention, and recognition memory in infancy: An ERP and cortical source localization study. Developmental Psychology. 2005;41(4):598–615. doi: 10.1037/0012-1649.41.4.598. [DOI] [PMC free article] [PubMed] [Google Scholar]
- Reynolds GD, Richards JE. Infant heart rate: A developmental psychophysiological perspective. In: Schmidt LA, Segalowitz SJ, editors. Developmental Psychophysiology: Theory, Systems, and Applications. Cambridge: University Press; 2007. [Google Scholar]
- Richards JE. Effects of attention on infants' preference for briefly exposed visual stimuli in the paired-comparison recognition-memory paradigm. Developmental Psychology. 1997;33:22–31. doi: 10.1037//0012-1649.33.1.22. [DOI] [PubMed] [Google Scholar]
- Richards JE. Localizing the development of covert attention in infants using scalp event-related-potentials. Developmental Psychology. 2000;36:91–108. [PubMed] [Google Scholar]
- Richards JE. Cortical indices of saccade planning following covert orienting in 20-week-old infants. Infancy. 2001;2:135–157. [Google Scholar]
- Richards JE. Development of attentional systems. In: De Haan M, Johnson MH, editors. The cognitive neuroscience of development. East Sussex, UK: Psychology Press; 2002. [Google Scholar]
- Richards JE. Cortical sources of event-related-potentials in the prosaccade and antisaccade task. Psychophysiology. 2003;40:878–894. doi: 10.1111/1469-8986.00106. [DOI] [PMC free article] [PubMed] [Google Scholar]
- Richards JE. Recovering cortical dipole sources from scalp-recorded event-related-potentials using component analysis: Principal component analysis and independent component analysis. International Journal of Psychophysiology. 2004 a;54:201–220. doi: 10.1016/j.ijpsycho.2004.03.009. [DOI] [PubMed] [Google Scholar]
- Richards JE. Development of covert orienting in young infants. In: Itti L, Rees G, Tsotsos J, editors. Neurobiology of attention. Chapter 14. Elsevier: Academic Press; 2004 b. pp. 82–88. [Google Scholar]
- Richards JE. Localizing cortical sources of event-related potentials in infants’ covert orienting. Developmental Science. 2005;8:255–278. doi: 10.1111/j.1467-7687.2005.00414.x. [DOI] [PMC free article] [PubMed] [Google Scholar]
- Richards JE. Realistic cortical source models of ERP. 2006 Unpublished manuscript. http://jerlab.psych.sc.edu./PDF%20Files/RealisticSourceModels.pdf. [Google Scholar]
- Richards JE. In: Realistic head models for cortical source analysis in infant participants. Richards JE, editor. Boston: Society for Research in Child Development; 2007a. [Google Scholar]
- Richards JE. Cortical sources of ERP in the prosaccade and antisaccade task using realistic source models based on individual MRIs. Submitted to Psychophysiology. 2007b [Google Scholar]
- Richards JE, Hunter SK. Testing neural models of the development of infant visual attention. Developmental Psychobiology. 2002;40:226–236. doi: 10.1002/dev.10029. [DOI] [PMC free article] [PubMed] [Google Scholar]
- Rorden C, Brett M. Stereotaxic display of brain lesions. Behavioural Neurology. 2000;12:191–200. doi: 10.1155/2000/421719. http://www.sph.sc.edu/comd/rorden/mricro.html. [DOI] [PubMed] [Google Scholar]
- Rugg MD, Fletcher PC, Chua PM-L, Dolan RJ. The role of prefrontal cortex in recognition memory for source: An fMRI study. NeuroImage. 1999;10:520–529. doi: 10.1006/nimg.1999.0488. [DOI] [PubMed] [Google Scholar]
- Rutherford M, Malamateniou C, Zeka J, Counsell S. MRI of the neonatal brain at 3T. European Journal of Paediatric Neurology. 2004;8:281–289. doi: 10.1016/j.ejpn.2004.08.003. [DOI] [PubMed] [Google Scholar]
- Scherg M. Fundamentals of dipole source potential analysis. In: Grandon F, Hoke M, Romani GL, editors. Auditory evoked magnetic fields and potentials. Vol. 6. Basel: Karger; 1990. pp. 40–69. [Google Scholar]
- Scherg M. Functional imaging and localization of electromagnetic brain activity. Brain Topography. 1992;5:103–111. doi: 10.1007/BF01129037. [DOI] [PubMed] [Google Scholar]
- Scherg M, Picton TW. Separation and identification of event-related potential components by brain electrical source analysis. In: Brunia CHM, Mulder G, Verbaten MN, editors. Event-related brain research. Amsterdam: Elsevier Science Publishers; 1991. pp. 24–37. [PubMed] [Google Scholar]
- Slotnick SD, Moo LR, Segal JB, Hart JH., Jr Distinct prefrontal cortex activity associated with item memory and source memory for visual shapes. Cognitive Brain Research. 2003;17:75–82. doi: 10.1016/s0926-6410(03)00082-x. [DOI] [PubMed] [Google Scholar]
- Spencer KM, Dien J, Donchin E. A componential analysis of the ERP elicited by novel events using a dense electrode array. Psychophysiology. 1999;36:409–414. doi: 10.1017/s0048577299981180. [DOI] [PubMed] [Google Scholar]
- Srinivasan R, Tucker DM, Murias M. Estimating the spatial nyquist of the human EEG. Behavioral Research Methods, Instruments, & Computers. 1998;30:8–19. [Google Scholar]
- Stok CJ. The influence of model parameters on EEG/MEG single dipole source estimation. IEEE Transactions on Biomedical Engineering. 1987;34:289–296. doi: 10.1109/tbme.1987.326090. [DOI] [PubMed] [Google Scholar]
- Sury J, Harker H, Begent J, Chong WK. The management of infants and children for painless imaging. Clinical Radiology. 2005;60:731–741. doi: 10.1016/j.crad.2005.02.014. [DOI] [PubMed] [Google Scholar]
- Talairach J, Tournoux P. Co-planar stereotaxic atals of the human brain. NY: Thieme Medical Publishers; 1988. [Google Scholar]
- Tucker DM. Spatial sampling of head electrical fields: The geodesic sensor net. Electroencephalography and Clinical Neurophysiology. 1993;87:154–163. doi: 10.1016/0013-4694(93)90121-b. [DOI] [PubMed] [Google Scholar]
- Tucker DM, Liotti M, Potts GF, Russell GS, Posner MI. Spatiotemporal analysis of brain electrical fields. Human Brain Mapping. 1994;1:134–152. [Google Scholar]
- Williams L-A, Gelman N, Picot PA, Lee DS, Ewing JR, Han VK, Thompson RT. Neonatal Brain: Regional Variability of in Vivo MR Imaging Relaxation Rates at 3.0 T—Initial Experience. Radiology. 2005;235:595–603. doi: 10.1148/radiol.2352031769. [DOI] [PubMed] [Google Scholar]