

Abstract
The integration of auditory and visual stimuli is crucial for recognizing objects, communicating effectively, and navigating through our complex world. Although the frontal lobes are involved in memory, communication, and language, there has been no evidence that the integration of communication information occurs at the single-cell level in the frontal lobes. Here, we show that neurons in the macaque ventrolateral prefrontal cortex (VLPFC) integrate audiovisual communication stimuli. The multisensory interactions included both enhancement and suppression of a predominantly auditory or a predominantly visual response, although multisensory suppression was the more common mode of response. The multisensory neurons were distributed across the VLPFC and within previously identified unimodal auditory and visual regions (O'Scalaidhe et al., 1997; Romanski and Goldman-Rakic, 2002). Thus, our study demonstrates, for the first time, that single prefrontal neurons integrate communication information from the auditory and visual domains, suggesting that these neurons are an important node in the cortical network responsible for communication.
Keywords: vocalization, face, sensory integration, language, frontal lobe, cortex
Introduction
Facial gestures, mouth movement, and corresponding vocal stimuli are routinely integrated during communication in animals and humans (Ghazanfar and Logothetis, 2003; Izumi and Kojima, 2004; Evans et al., 2005). Their combined transmission can affect the information contained in the communication stream thereby clarifying (Meredith and Stein, 1983; Stein and Meredith, 1993; Calvert et al., 2001) or altering the message transmitted, as seen in the McGurk effect (McGurk and MacDonald, 1976). The widespread connectivity of the frontal lobes makes them a likely candidate for integrating sensory signals. They receive a wealth of sensory afferents from multiple modalities and have influence over a great number of brain regions involved in motor and cognitive processes. Research on ventrolateral prefrontal cortex (VLPFC) has revealed a number of properties that make it an ideal candidate for integrating complex communication stimuli. First, it has been associated previously with speech and language processing (Broca, 1861; Gabrieli et al., 1998; Price, 1998), and neuroimaging studies have described the activation of several frontal lobe regions, including VLPFC, during audiovisual speech processing (Calvert, 2001; Homae et al., 2002; Jones and Callan, 2003; Calvert and Thesen, 2004; Miller and D'Esposito, 2005; Ojanen et al., 2005).
Neurophysiology studies in nonhuman primates have shown that neurons in VLPFC are involved in the mnemonic and perceptual processing of face and object visual stimuli (Goldman-Rakic, 1987; Funahashi et al., 1990; Wilson et al., 1993; Fuster, 1997; O'Scalaidhe et al., 1999; Miller, 2000). In addition, cells located adjacent to the face-object responsive region receive afferents from auditory association cortex (Romanski et al., 1999b) and respond to complex auditory stimuli, including species-specific vocalizations (Romanski and Goldman-Rakic, 2002; Gifford et al., 2005; Romanski et al., 2005). The anatomical and physiological evidence for juxtaposed auditory and visual domains led us to the hypothesis that some cells in this region might receive convergent inputs and respond to both auditory and visual stimuli, especially faces and vocalizations. We chose, therefore, to examine the possibility that single cells in the primate VLPFC, in the region of overlap of auditory and visual responsive zones, were multisensory and responsive to both facial gestures and corresponding vocalizations. In the present study, we recorded from the VLPFC of awake, behaving rhesus macaques as they were presented with naturalistic audiovisual stimuli. The stimuli consisted of short video clips of familiar monkeys vocalizing. These movies were separated into audio and video streams. We compared the neural response to the separated unimodal stimuli with that of the combined audiovisual stimuli. A similar naturalistic movie presentation has been used recently in examination of sensory integration in the temporal lobe in both animal electrophysiology (Barraclough et al., 2005; Ghazanfar et al., 2005) and human neuroimaging (Beauchamp et al., 2004). Our results indicate that some neurons within the VLPFC are, in fact, bimodal, responding to both unimodal auditory and visual stimuli, or responding differently to bimodal stimuli than to either unimodal stimuli. Therefore, these neurons may be an essential component of a network involved in the integration of auditory and visual communication information.
Materials and Methods
Subjects and surgical methods.
We made extracellular recordings in three rhesus monkeys (Macaca mulatta), one female (6.7 kg) and two males (8.0 and 12.0 kg). All methods were in accordance with National Institutes of Health standards and were approved by the University of Rochester Care and Use of Animals in Research Committee. Before training, a titanium head post was surgically implanted in the skull of all animals to allow fixation of the head during recordings. When training was complete, animals were implanted with a 20 mm recording cylinder (Narishige, Tokyo, Japan) placed over the ventrolateral prefrontal cortex. The recording cylinders were placed to maximize recordings in areas 12/47 and 45 as defined anatomically by Preuss and Goldman-Rakic (1991) and physiologically by Romanski and Goldman-Rakic (2002). Recordings favored the auditory responsive region of the VLPFC and were, therefore, more commonly localized to area 12/47, although proper cytoarchitectonic analysis could not be done because of the damage from numerous electrode tracks. Recordings were made in the left hemisphere of two animals and the right hemisphere of one of the animals.
Apparatus and stimuli.
All training and recording was performed in a sound-attenuated room lined with Sonex (Acoustical Solutions, Richmond, VA). Auditory stimuli were presented to the monkeys by either a pair of Audix PH5-vs speakers (frequency response, ±3 dB, 75–20,000 Hz) located on either side of a center monitor or a centrally located Yamaha MSP5 monitor speaker (frequency response, 50 Hz to 40 kHz) located 30 inches from the monkey's head and placed just below the computer monitor. The auditory stimuli ranged from 65 to 80 dB sound pressure level measured at the level of the monkey's ear. The visual stimuli included both static pictures and short digital movies of monkeys or humans vocalizing or objects moving with accompanying sound. The macaque movies that we used were made from digital movies of familiar conspecifics in the colony of the macaques in which we performed our single-unit recordings. The movie stimuli included macaques vocalizing, humans vocalizing, biological motion stimuli (clapping, snapping), and random dot stimuli combined with band-passed noise. The human vocalization movies included familiar laboratory personnel performing vowel sounds and commonly heard words (Ah, Oh, Eee, Oou, and No). The macaque vocalization movies were short (400–1200 ms) clips of familiar monkeys from our home colony making coo, grunt, pant threat, scream, bark, and growl vocalizations. These movies were processed using Adobe Premier (Adobe Systems, San Jose, CA), Jasc Animation studio (Corel, Minneapolis, MN), as well as several custom and shareware programs. We separated the audio and visual components of the movie into mp3 and mpeg streams for processing. The visual mpeg stream was cropped to remove extraneous and distracting elements in the viewing frame. The audio track was filtered to eliminate background noise and hiss or hum if present (see below). The two streams were then recombined, and the movie was shortened so that only the relevant vocalization was presented as a single movie lasting 300–1200 ms. When presented in our task, the static images and the movies subtended 8–10° and were presented on the center of the computer monitor display. The static visual images were created from the digital movies themselves and were selected to represent the movie they were taken from. For example, a static picture of a monkey cooing was taken from the digital movie of the monkey cooing, and the frame selected was the one that portrayed the face in the prototypical coo as described previously (Hauser and Marler, 1993). Thus, the static visual stimuli included digitized pictures of familiar monkeys and humans vocalizing, hands clapping, fingers snapping, and random dot stimuli.
The auditory stimuli acquired through the digital movies were filtered and edited using MATLAB (MathWorks, Natick, MA) and SIGNAL (Engineering Design, Cambridge, MA). Additional auditory stimuli, which have been used in previous studies, were used to search for responsive cells and included macaque vocalizations collected by Dr. Mark Hauser (Harvard University, Cambridge, MA) from the macaques on the island of Cayo Santiago as described previously (Romanski et al., 2005). All vocalization and nonvocalization stimuli were inspected and analyzed using SIGNAL. Background noise was filtered or silenced. If stimuli contained onset or offset clicks or pops, the sound was modified and a 5 ms taper was applied using SIGNAL. All stimuli were also equalized in root mean square amplitude (range, 1–2 V). Playback of the stimuli was through an Audigy Platinum sound card (playback rate, 44.1, 48, and 96 kHz). These visual and auditory stimuli were presented simultaneously or separately to the monkey during the recording as described below.
Task and experimental procedure.
Animals were acclimated to the laboratory and testing conditions and then were trained on a fixation task. The head was fixed in place by means of the chronically implanted head post, and a stereotaxic adaptor was placed on the recording cylinder. Eye position was continuously monitored using an ISCAN infrared pupil monitoring system (ISCAN, Burlington, MA). The animals were required to fixate on a central point for the entire trial, which included a 500 ms pretrial fixation period, the stimulus presentation, and a 500 ms poststimulus fixation period. A juice reward was delivered at the termination of the poststimulus fixation period, and the fixation requirement was then released. Losing fixation at any time during the task resulted in an aborted trial. There was a 2 s intertrial interval. During recordings, a parylene-coated Tungsten electrode (0.8–2.0 MΩ at 1 kHz; Frederick Haer Company, Bowdoinham, ME) was lowered into the target region by a hydraulic microdrive (MO-95C; Narishige), which fit over the recording cylinder. The neuronal activity was amplified (BAK MD-4 amplifier; BAK Electronics, Germantown, MD), filtered (Krohn-Hite 3500; Krohn-Hite, Avon, MA), discriminated (BAK DIS-I Window Discriminator), and displayed on an oscilloscope. Discriminated spikes were digitized and saved on-line. Simultaneous isolation of up to two units was possible with dual window discriminators. The timing of the behavioral contingencies, acquisition, and storage of spike data, presentation of all stimuli, delivery of reward, and monitoring of eye position were controlled by a computer running CORTEX (National Institutes of Health derived software, dual computer mode).
After we isolated a cell, two fixation tasks were used to search for multisensory neurons in the VLPFC. The initial search task involved the presentation of vocalization, nonvocalization sounds, face, and nonface object auditory and visual stimuli while monkeys fixated. The stimuli were organized into sets of 10 auditory, 10 visual, or 10 audiovisual stimuli each. A given cell was tested with a minimum of 10 stimuli. If no stimulus evoked a response, the next stimulus set was presented (audiovisual, auditory, visual stimuli). A maximum of four stimulus sets were presented to determine neuronal responsiveness. Our reason for not using a selectivity blind procedure is that unlike primary sensory and sensory association cortex, the responses of prefrontal neurons are highly variable and often difficult to evoke with small stimulus sets. In previous studies, it has been observed that VLPFC neurons show a gradient of selectivity with some neurons exhibiting responses to several stimuli within a set, whereas others show highly selective responses to just one type of stimulus (vocalization type) or to just one exemplar (a single face) (O'Scalaidhe et al., 1997, 1999; Romanski and Goldman-Rakic, 2002). Furthermore, the part of VLPFC responsive to auditory stimuli is small and difficult to locate, whereas other parts of VLPFC are responsive to visual (Wilson et al., 1993; O'Scalaidhe et al., 1997) or somatosensory (Romo et al., 1999) stimuli, which was not used in our study. Because it was our goal to determine whether auditory or visual responsive neurons were in fact multisensory, we wanted first to determine whether there was a response to any of the auditory or visual stimuli in our set. Without a small response to at least one element in our stimulus set, it might not be possible to determine multisensory responsivity at all.
After initial testing, the stimulus or pair of stimuli that evoked the highest mean firing rate was selected as the featured stimuli in the Movie task and presented in five conditions: vocalization/sound alone (A), static face/object alone (Vs), vocalization/sound and static face/object (AVs), silent video motion clip (Vm), and video motion clip with the corresponding vocalization/sound stream (AVm) (see Fig. 1). For static face stimuli, the face frame from the vocalization movie depicting the mouth position for that vocalization was used. In the AVs condition, the onset of auditory stimuli was coincident with the visual static image and began at time 0. Because the facial gesture shown in the static condition would normally accompany the “middle” of the vocalization, we reasoned that turning on the auditory stimulus coincident with the onset of the static image, which already conveys motion would be perceived as synchronous. In contrast, delaying the auditory stimulus when presented with the “open-mouth” visual stimulus could be perceived as asynchronous where the motion stimulus is at its fullest extent and is then followed by the auditory stimulus. In addition, we planned for the timing of the vocalization in the AVs condition to match that of the auditory alone condition and to allow for analysis of latency shifts and temporal effects of multisensory stimulation. Because it is difficult to detect response latencies in our cells, setting the stimulus onset to 0 in the static condition allowed for better calculation of response latencies that could be used to guide the more “natural” stimulus, the vocalization movie (AVm). The movie had a more natural timing in that the auditory stimulus onset lagged behind the visual motion stimulus. Thus, both natural and experimentally precise timing conditions were represented in our testing paradigm.
Figure 1.
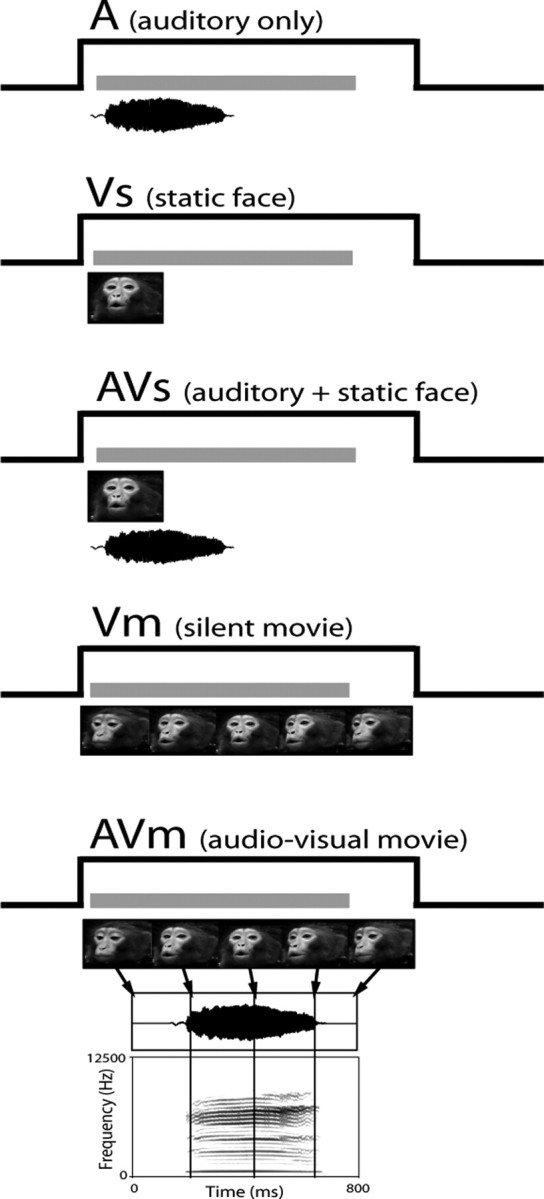
Audiovisual stimuli in the movie task. The five stimulus conditions used in the experiment are shown from top to bottom. The conditions used were as follows: A, the vocalization or auditory stimulus alone; Vs, the static facial (or object) image alone; AVs, the auditory stimulus combined with the static facial image; Vm, the visual motion stimulus (i.e., the video-only portion of the movie track); and AVm, the full audiovisual movie consisting of the visual movie track Vm and the corresponding vocalization. The analysis window is portrayed in each condition as a gray bar above the audiovisual stimuli. In Vm and AVm, an example of a coo vocalization movie stimulus is presented as a series of five dynamic images with arrows indicating their time of occurrence during the audiovisual movie stream. The corresponding vocalization used as the audio track is depicted below the movie frames. Below the vocalization in AVm is the spectrogram for the vocalization. This is similar to the paradigm illustrated by Ghazanfar et al. (2005).
Each of the five stimulus conditions in the Movie task was presented in pseudorandom order 10–12 times. Neurons were also tested with nonface visual stimuli (clapping hands, snapping fingers, random dot stimuli) with corresponding auditory sounds. If the neuron was still well isolated after testing with the preferred pair of audiovisual stimuli in the Movie task, additional auditory and visual stimuli were tested to further examine the selectivity and modality specificity of the cell. After a cell completed testing, the electrode was advanced 200 μm, and a new cell or pair of cells was isolated and tested.
Data analysis.
We analyzed the response of each single unit in to auditory, visual, and combined stimuli. The analysis window started 100 ms after the onset of the visual stimulus and lasted through the duration of the auditory stimulus +250 ms to take the response latency of the neuron into account. We positioned this window earlier or later for neurons with short or long onset latency. For direct comparisons, the same size analysis window was used in all conditions across a given cell. For the multisensory conditions, the analysis window coincided with the temporal overlap of the auditory and visual stimuli. Spike counts were converted into rates. Spontaneous activity was measured by counting the number of spikes in a 300 ms period during the intertrial interval and converting it to a spike rate. All data analysis was performed using SPSS (version 13.0 for Windows; SPSS, Chicago, IL), SYSTAT (version 5.0 for Windows; Systat Software, Point Richmond, CA), and MATLAB (MathWorks). We performed a McNemer's χ2 test with continuity correction on the cells that were tested with face and nonface stimuli (n = 92) and the cells that were tested with monkey and human face stimuli (n = 30). Details on specific procedures are described below.
Multisensory responses: three-way ANOVA.
To assess the responses of neurons to auditory, static visual stimuli, visual motion stimuli, or combined auditory-visual static or auditory visual-motion stimuli, the neural activity was analyzed using a three-way ANOVA model given by: r = μ + αi + βj + γk + δi,j + εi,k + σ, where r is the response of the neuron on an individual trial, αi, βj, and γk refer to the main effects of A, Vs, and Vm conditions, respectively, μ is the intercept, and σ is a Gaussian random variable. δi,j and εi,k refer to the interaction terms, which test the null hypothesis that the response in the multisensory condition (AVs or AVm) is the sum of the responses to the corresponding unimodal stimuli (A and Vs or A and Vm). Table 1 shows how the trial conditions corresponded to each factor of the ANOVA. Because this was an unbalanced design (i.e., there were empty cells), the analysis was done in SPSS using the general linear model option, and significance levels were assessed using type II sums-of-squares.
Table 1.
Factor levels and trial conditions for the ANOVA model
| Factor levels | Vs+ |
Vs− |
||
|---|---|---|---|---|
| Vm+ | Vm− | Vm+ | Vm− | |
| A+ | X | AVs | AVm | A |
| A− | X | Vs | Vm | Spontaneous |
A plus sign indicates the presence of the corresponding stimuli. X indicates a condition without observations. These empty cells are attributable to the impossibility of showing both the static and the movie visual stimuli in the same trial.
With this analysis, we characterized task responsive cells as unimodal if they had a significant main effect of the auditory factor (A), but neither of the visual factors (Vs or Vm), or a significant main effect of one or both of the visual factors but not the auditory factor. Previous studies have considered a neuron multisensory if: (1) there is a response to the separate presentation of stimuli from two different modalities, or (2) the response to the combined auditory and visual stimuli is significantly different than would be expected from the responses to the individual unimodal stimuli. In our analysis, cells were classified as bimodal if they had: (1) significant main effects of both the auditory condition and one or both of the visual conditions, or (2) a significant interaction effect. Cells that had a main effect of A and Vm or A and Vs, and no interaction effect, were considered linear multisensory, because the multisensory response could be explained as a linear sum of the two unimodal responses. A neuron with a nonlinear, either super-additive or sub-additive, multisensory response is one with a response that cannot be accounted for by the linear sum of the unimodal conditions. Neurons that had a significant interaction effect, either AVs (δi,j) or AVm (εi,k), in the ANOVA were categorized as nonlinear multimodal. It is important to note that these interaction terms do not test for a significant response in the multisensory condition with respect to baseline but rather test the null hypothesis that the response in the multisensory condition is equal to the linear sum of the responses in each of the unimodal conditions. This is important, because the relevant hypothesis to be examined is, which stimulus modalities drive the neural responses, and this question cannot be assessed with a series of t tests.
Multimodal index.
To compare the multisensory interaction of the VLPFC cells with previous studies, we introduced an index [Multimodal Index (MMI)] to evaluate the response modulation in the bimodal (i.e., AV) condition. It is similar to the previously published index MI, defined by Meredith and Stein (1986), with subtle but important differences. MMI is defined as: MMI = [rAV − max(rA, rV)]/[rAV + max(rA, rV)], where rAV, rA, and rV are the mean firing rate to AV, A, and V conditions calculated, respectively. By definition, MMI takes a value between −1 and 1. A positive value is generated during multisensory response enhancement and a negative value during multisensory suppression of responses. Because the MMI cannot determine whether a cell had a significant response to multisensory stimuli, it was only used to characterize cells that had been shown to have significant interaction effects in the three-way ANOVA and were nonlinear multimodal.
Decoding and information theoretic analysis.
We calculated the partial information in the cells that were categorized as nonlinear multisensory based on the results of the three-way ANOVA described above. The analysis has been described previously (Averbeck et al., 2003; Romanski et al., 2005) and will be briefly reviewed here. First, linear discriminant analysis (Johnson and Wichern, 1998) was used to classify single-trial responses of individual neurons with respect to the unimodal or multisensory stimuli that generated them. This analysis resulted in a stimulus-response matrix, in which the stimulus was the auditory, visual, or combined stimulus that was presented on an individual trial, and the response was the stimulus to which each single-trial neural response was classified. Each cell of the matrix contained the count of the number of times that a particular stimulus was classified as a particular response by the algorithm. Thus, the diagonal elements of this matrix contained counts of correct classifications, and the off-diagonal elements of the matrix contained counts of the incorrect classifications. Percentage correct performance for each stimulus class was calculated by dividing the number of correctly classified trials for a particular stimulus (the diagonal element of a particular row) by the total number of times a particular stimulus was presented (usually 9–12, the sum of the off-diagonal elements in a particular row).
Next, we calculated the partial information contained in the neural responses of a single cell about each stimulus. Partial information was calculated as follows:
 |
where the sum is taken over all possible responses. The stimulus-response probability distributions were estimated using the classification matrix. The average of the partial information across stimuli gives the total information in the neural response about all of the stimuli. The partial information about a particular stimulus is a measure of how well the response can be predicted, when a given stimulus is shown. Because there may be more information in the raw neural responses than there is in the decoded neural responses, because of mismatches between the model and the real response distribution, these information estimates are lower bounds.
Results
Types of responses
Because we were interested in studying audiovisual responsive neurons, we targeted that part of the VLPFC that is known to contain auditory and visual responsive cells (O'Scalaidhe et al., 1997, 1999; Romanski and Goldman-Rakic, 2002; Gifford et al., 2005), including cytoarchitectonic regions 12/47 and 45 (Preuss and Goldman-Rakic, 1991; Petrides and Pandya, 2002). Single-neuron recordings were performed while monkeys performed a fixation task for juice reward, during which we presented auditory, visual, or combined auditory and visual stimuli. We first tested each cell with lists of auditory, visual, and combined stimuli during fixation. After determining the initial preference of the cell, we tested each cell in the Movie task where auditory, visual, and combined presentations of the preferred audiovisual stimuli were presented. We analyzed the activity of 595 single units, from which we were able to obtain a complete set of data in the Movie task (Fig. 1). To assess the responses of neurons to auditory (A), static visual stimuli (Vs), visual movie stimulus (Vm), or combined auditory visual static (AVs) or the vocalization movie condition (AVm), we performed a three-way ANOVA, where each factor coded the presence or absence of the A, Vs, and Vm stimuli in each trial, and the mean firing rate was the dependent variable (see Materials and Methods, p < 0.05). The firing rate was calculated in a window equal to the length of the auditory stimulus plus 250 ms, starting 100 ms after stimulus onset. The window was adjusted for cells with shorter or longer latencies. This window included the time during auditory and visual stimulus overlap in the multisensory AVs and AVm conditions. With this analysis, we characterized task responsive cells as unimodal auditory if they had a significant main effect of the auditory factor (A), but neither of the visual factors (Vs or Vm) or interaction effects, or unimodal visual if they had a significant main effect of one or both of the visual factors, but not the auditory factor, and no interaction effects. Overall, there were 387 neurons that were responsive (p < 0.05) because of either a main effect or an interaction effect. We found that approximately half (194 of 387) of the neurons were unimodal visual and had main effects of either Vs (n = 46), Vm (n = 47), or both (n = 101) with no interaction effects (Fig. 2a). In contrast, only 4% (16 of 387) of the neurons were unimodal auditory. Thus, unimodal visual neurons were more frequently encountered than unimodal auditory neurons across the VLPFC as suggested by previous studies (Romanski and Goldman-Rakic, 2002).
Figure 2.

Summary of the VLPFC population responses to unimodal and multisensory stimulus conditions. a, A total of 387 neurons that responded to audiovisual vocalization stimuli and were categorized according to their responses based on a three-way ANOVA: 4% (16 of 387) of neurons responded to a unimodal auditory stimulus exclusively (black); 50% (194 of 387) responded to one or both of the unimodal visual conditions but not to auditory or multisensory conditions (white); a total of 177 of 387 (46%) neurons of the recorded population were responsive to multisensory stimuli with 7% of these (27 of 387; light gray) responding to both the auditory and visual unimodal conditions, which we termed a linear response, whereas the remaining nonlinear multisensory neurons (39% or 150 of 387; dark gray) had a significant interaction (AVs or AVm). b, The number of neurons that showed multisensory responses by stimulus conditions. Left to right, The number of neurons that responded to AVm, AVs, or both was 60, 51, and 39, respectively.
Previous studies have considered a neuron multisensory (multimodal) if there was a response to the separate presentation of stimuli from two different modalities, or if the response to the combined auditory and visual stimuli was significantly different than would be expected from the responses to the individual unimodal stimuli. In our analysis, cells were classified as multisensory if they had significant main effects of both the auditory condition and one or both of the visual conditions, or had a significant interaction effect, AVs or AVm. For example, a cell may respond only to the unimodal auditory stimulus, but not to either unimodal visual condition, while also having a response in the simultaneous presentation of AV stimuli that is significantly different than the response to the auditory stimulus alone. Thus, the cell would be considered multimodal, because the concurrently presented visual stimulus clearly modulates the auditory response during combined bimodal stimulus presentation. These nonlinear effects were assessed by examining the significance of the two interaction terms (AVs and AVm; see Materials and Methods) in our ANOVA model. Multisensory neurons (both linear and nonlinear) accounted for 46% of all task-related neurons (177 of 387). In our sample, 27 units (7% of the total population) were linear multisensory and had significant main effects of A and one or both of the unimodal visual stimuli (Vs, Vm). In addition, 85% of the multisensory cells (150 of 177) and 39% of the total task responsive population (150 of 387) had a significant interaction effect in the ANOVA (Fig. 2a) and were categorized as nonlinear multisensory. The pie chart in Figure 2a summarizes the proportion of cells classified as unimodal or multimodal. The multisensory responses included responses to the vocalization movie (AVm; n = 60), the static face paired with the vocalization (AVs; n = 51), or to both of these conditions (n = 39) (Fig. 2b).
To facilitate comparison with previous studies, we calculated a MMI, related to the index previously used by Meredith et al. (1987) (see Materials and Methods), in which a negative and a positive value would indicate multisensory suppression and multisensory enhancement, respectively. The MMI was calculated for each of the cells shown to be nonlinear multisensory in the three-way ANOVA.
Figure 3a–d shows three representative VLPFC neurons, the responses of which were classified as multisensory nonlinear and one cell that was classified as linear multisensory. In Figure 3a–c, there was a significant interaction effect (AVs, AVm, or both) in our analysis indicating that the response to the combined audiovisual stimuli could not be explained by the simple linear sum of the separate responses to the unimodal auditory and visual stimuli. Within the multisensory population, some neurons exhibited multisensory enhancement (Fig. 3a,b) [i.e., they exhibited an increase in firing during the combined stimulus presentations (AVm or AVs) compared with unimodal stimuli], whereas others exhibited suppression (Fig. 3c) or a decrease in firing during AVm or AVs compared with the unimodal responses. For example, the neuron shown in Figure 3a responded to the separate and simultaneous presentation of a macaque bark vocalization with the accompanying facial gesture. There were significant main effects of A, Vs, and Vm (p < 0.001) with the strongest response in the auditory condition (A) compared with Vm and Vs. In addition to the main effects, the interaction term AVm was significant (p = 0.044) indicating a nonlinear, superadditive response. The interaction term AVs was not significant (p = 0.716). The MMI (see Materials and Methods) for this cell was positive, 0.321 (AVm), indicating multisensory enhancement. The cell with a response that is depicted in Figure 3b had a significant multisensory response to a macaque scream vocalization and was more responsive to the visual than the auditory stimulus presentation. For this neuron, the main effects Vs (the static image) and Vm (the visual movie stimulus) were both significant (p < 0.0001) (Fig. 3b). The interaction term AVs was significant (p = 0.042), and the MMI was positive, 0.217, indicating multisensory enhancement.
Figure 3.

Examples of single-cell responses to unimodal and multisensory conditions. Three representative nonlinear multisensory cells are shown (a–c) depicting the types of responses seen in the VLPFC in response to audiovisual stimuli (A, Vs, AVs, Vm, and AVm are shown from left to right). The neuronal responses are shown as raster plots with superimposed spike density functions and a bar chart of the mean firing rate (spontaneous rate subtracted) during the stimulus period on the right. The onset of the stimulus period is at time 0. The analysis window for each cell is indicated by a horizontal gray bar above the raster/spike density plots and was dependent on the stimulus duration. The cell in a had a higher mean firing rate for unimodal auditory stimuli and exhibited multisensory enhancement during the combined stimulus conditions. The interaction AVm was significant (p = 0.044). The cell in b also exhibited a multisensory enhancement but had a preference for visual stimuli and had a multisensory response to a macaque scream vocalization (the interaction AVs was significant; p = 0.042). The cell in c responded to unimodal visual stimuli and exhibited suppression (AVm; p = 0.043). d, This cell is an example of a linear multisensory cell. This cell had a main effect of A and Vm, but the interaction term AVm was not significant indicating that the response was not nonlinear but could be explained by a simple summation of the component stimuli. Note that although the response latency did change in response to AVm, the total spike count for this stimulus was not different from the linear sum of A and Vm. For each cell in a–d, the auditory waveform and visual stimulus, which evoked the response are indicated below the raster/spike density plots. The error bars in the bar chart refer to the SEM. Numbers to the left of the raster plots and bar charts refer to the spike rate (spikes/s).
Multisensory integration was also observed in the form of suppression in VLPFC cells for AVm or AVs bimodal stimuli. The neuron in Figure 3c had a significant multisensory response to a human vocalization and face and was predominantly visual. The main effects of Vs and Vm were both highly significant (p < 0.0001), and there was a significant interaction effect (AVm; p = 0.043) which, as shown in the bar chart at the right (Fig. 3c), was less than the best unimodal visual response. Accordingly, the MMI for this cell was negative, −0.11, indicating multisensory suppression. In Figure 3d, a cell that was categorized as linear multisensory is shown. This cell had a main effect of auditory (p = 0.003) and the visual condition Vm (p = 0.004), but the interaction AVm was not significant (p = 0.113). The cell is bimodal by virtue of its responses to auditory and visual stimuli presented separately. The cell did exhibit a latency shift in the AVm condition but because our analysis focused on the number of spikes during the stimulus, the responses to A, Vm, and AVm do not differ significantly from one another; therefore, the response to the bimodal condition AVm could be explained by the simple response to one of the unimodal stimuli that comprise it (Fig. 3d, right).
Stimulus selectivity
Neurons in the VLPFC have been shown to be selectively responsive to faces (O'Scalaidhe et al., 1997) and have also been shown to be robustly responsive for vocalizations (Romanski et al., 2005). Given the potential for stimulus selectivity in our population and the fact that the ventral frontal lobe may be uniquely activated by communication stimuli, we asked whether multisensory responses were observed more frequently with face and vocalization stimuli than nonface/nonvocalizations. A total of 92 cells were tested with both face/vocalization and nonface/nonvocalization congruent stimulus combinations. The face stimuli included both human and monkey faces with their corresponding vocalizations. The nonface stimuli included hand claps, finger snaps, and random dot stimuli paired with noise. The proportion of neurons showing a significant multisensory response was higher for face/vocalization (n = 25) than nonface/nonvocalization (n = 11) pairs of stimuli (McNemar's χ2 = 4.6944; df = 1; p = 0.0303). We also examined whether neurons were more likely to show a multisensory response with monkey faces versus human faces. Of 30 cells tested with both monkey and human face/vocalization stimuli, there was not a significant difference in the number of multisensory responses to monkey face versus human face stimuli (McNemar's χ2 = 0.3077; df = 1; p = 0.5791). Our results suggest that there is a preference for face versus nonface stimuli in eliciting multisensory responses, although this effect is not specific for monkey versus human faces.
Multisensory enhancement and suppression
Our single-unit examples illustrate that multisensory VLPFC cells were variably responsive to auditory and visual stimuli and also exhibited either enhancement or suppression relative to the unimodal stimuli. We computed the MMI for each of the 150 significant nonlinear multisensory neurons. In Figure 4, we separated the MMI into two groups: one for the MMI originating from the neurons that preferred auditory stimuli (Fig. 4, open bars) and one for the neurons that preferred visual stimuli (Fig. 4, filled bars) based on the mean response to A, Vs, or Vm. As you can see from the negative skew of the graph in Figure 4, suppression was observed in our population more frequently than enhancement, and this was a significant trend (Wilcoxon signed-rank test, two-sided interaction p < 0.0001; mean, −0.121). However, there was no difference between the predominantly auditory and visual cells in that both populations exhibited suppression more frequently than enhancement.
Figure 4.

Population histogram of the MMI for nonlinear multisensory neurons (n = 150) in the VLPFC. The graph indicates the MMI for cells that were characterized as predominantly auditory (open bars) or visual (filled bars) based on maximum firing rate in the unimodal stimulus conditions. The distribution of overall MMI was negatively skewed (Wilcoxon signed-rank test, two-sided; p < 0.0001).
We calculated the partial information transmitted about each of the five stimulus conditions during the intertrial interval in the nonlinear multisensory cells (n = 150). We used linear discriminant analysis (Averbeck et al., 2003; Romanski et al., 2005) to first decode the responses and then estimated the stimulus response probability distributions using the classification matrix. The partial information about a particular stimulus (A, Vm, Vs) or combination (AVm, AVs) of stimuli is a measure of how well the response can be predicted when a given stimulus or stimulus combination is presented. The plot in Figure 5 shows the amount of information about each condition averaged across all of the nonlinear enhanced multisensory cells (n = 40) and all of the nonlinear suppressed multisensory cells (n = 110). We compared the partial information about the stimulus conditions in enhanced cells versus suppressed cells with a two-way ANOVA. The factors were group (enhance, suppressed) by condition (A, Vs, Vm, AVm, AVs). There was a significant difference between the two groups with a higher total information for enhanced cells compared with suppressed cells (p < 0.001), but the effect of condition was not significant (p = 0.369), indicating that partial information did not differ across the unimodal and multisensory conditions but did differ between enhanced and suppressed cells.
Figure 5.

Average partial information for the five stimulus conditions in multisensory enhanced (AVG ENH) (n = 40) and suppressed (AVG SUP) (n = 110) cells.
Voice-onset time (VOT), or the time lag that occurs for speech stimuli after the mouth movement begins, has been shown to correlate with face/voice multisensory responses in the macaque auditory cortex (Ghazanfar et al., 2005). The large number of multisensory suppressed cells in the VLPFC might be related to long VOT. We separated the nonlinear multisensory cells into suppressed and enhanced cells and determined whether there was a significant correlation between VOT and the multisensory response, taken as the log of the p value for the AVm condition. The correlation was not significant for either enhanced or suppressed cells. The correlation of VOT and the multisensory response AVm in suppressed cells is shown in Figure 6(Pearson's r = −0.022; p = 0.854).
Figure 6.

The log (base 10) of the p values of the nonlinear suppressed cells for the AVm condition were plotted against VOT. The correlation of VOT and the strength of multisensory suppression evaluated by p value (Pval) was not significant (Pearson's r = −0.022; p = 0.854).
Localization of multisensory neurons
Because the VLPFC represents a truly heterogeneous population with a mixture of auditory, visual, and even somatosensory responsive neurons (Pigarev et al., 1979; Rosenkilde, 1979; O'Scalaidhe et al., 1997, 1999; Romo et al., 1999; Romanski and Goldman-Rakic, 2002), we asked whether auditory, visual, and bimodal cells were uniformly distributed across the recorded region of the VLPFC or whether there was any modality specific or interaction-specific organization to the responses. Although there was no clear organization of enhanced versus suppressed cells, there was some tendency for auditory cells to cluster in the anterolateral portion of the recording region, whereas predominantly visual cells were more widespread. This trend has been observed previously when only unimodal auditory and unimodal visual stimuli were tested and used to characterize VLPFC auditory neurons (Romanski and Goldman-Rakic, 2002; Romanski et al., 2005). Importantly, the location of multisensory neurons overlapped and was intermixed with unimodal auditory and unimodal visual neurons. This is shown in Figure 7, where we plotted the locations of cells with significant effects in our three-way ANOVA for one hemisphere in one subject. Cells designated as unimodal auditory (main effect of A, no other effects or interactions) are shown in blue, whereas the locations of unimodal visual cells are mapped in yellow. The locations of cells that were multisensory in our analysis, either linear (main effects of both auditory and visual stimuli) or nonlinear (interaction effect AVs or AVm) multisensory are shown in red. The general locations of these cells are shown on a schematic of the macaque brain with a larger inset detailing the grid locations in anteroposterior and mediolateral stereotaxic coordinates. Importantly, the plot shows that multisensory and unimodal neurons were observed in the same locations across the recording region of the VLPFC, which included areas 12/47 and 45 (Preuss and Goldman-Rakic, 1991). In fact, bimodal and unimodal neurons were isolated and found in the same electrode track during a given recording session. This suggests that a strict boundary between unimodal and multisensory cells does not exist across the VLPFC as was previously thought when auditory and visual responses were tested separately. Furthermore, it is possible that most cells in the VLPFC are multisensory if tested appropriately.
Figure 7.

Recording sites and distribution of the multisensory cells in one monkey. a, A lateral view of the whole macaque brain and an enlarged view of the prefrontal cortex indicating the location of the recording cylinder (dashed line). The electrode penetrations were confined to the region indicated by the grid. The locations of significantly responsive cells are plotted on the grid to show the locations of unimodal auditory (filled blue circles); unimodal visual neurons (filled yellow diamonds), and multisensory neurons (open red squares). In b, an expanded view of the distribution of the unimodal and multisensory cells in the recording grid is shown, indicating that multisensory and unimodal neurons were found in overlapping locations in the ventrolateral prefrontal cortex. ps, Principal sulcus; as, arcuate sulcus; AP, anteroposterior; ML, mediolateral.
Discussion
Our ability to recognize and integrate auditory and visual stimuli is the basis for many cognitive processes, but is especially important in meaningful communication. In the present study, we investigated the integration of audiovisual communication stimuli by single cells in the primate frontal lobes. We determined that some neurons in the primate VLPFC are bimodal and respond to both auditory and visual stimuli presented either simultaneously or separately. Some of the stimuli that evoked these prefrontal multisensory responses were rhesus macaque faces and vocalizations that have been shown previously to elicit robust responses from macaque VLPFC neurons when presented separately (O'Scalaidhe et al., 1997, 1999; Romanski and Goldman-Rakic, 2002; Romanski et al., 2005). In the present study, VLPFC multisensory neurons exhibited enhancement or suppression, and it was found that face/vocalization stimuli evoked multisensory responses more frequently than nonface/nonvocalization combinations when both were tested. This adds support to the notion that VLPFC may be specialized for integrating face and vocalization information during communication and sets it apart from other brain regions that integrate sensory stimuli.
Although a lesion study (Gaffan and Harrison, 1991) suggested the importance of the lateral PFC in sensory integration, only a small number of studies have examined the cellular basis for integrative processing in the primate PFC. An early study by Benevento et al. (1977) found neurons in the lateral orbital cortex (area 12 orbital) that were responsive to simple auditory and visual stimuli and that at least some of these interactions were attributable to convergence on single cortical cells. Fuster and colleagues recorded from the lateral frontal cortex during an audiovisual matching task (Bodner et al., 1996; Fuster et al., 2000). In this task, prefrontal cortex cells responded selectively to tones, and most of them also responded to colors according to the task rule (Fuster et al., 2000). However, the data presented here are the first to examine the integration of audiovisual communication information at the cellular level in the primate VLPFC.
In the present study, multisensory and unimodal neurons were colocalized in VLPFC and were coextensive with previously identified vocalization and face-cell responsive zones (Fig. 7). Some cells, which appeared unimodal when tested with auditory or visual stimuli separately, had robust responses to simultaneously presented audiovisual stimuli (Fig. 3b). Cells may be incorrectly categorized as unimodal if they are not tested with additional stimuli in an appropriate paradigm. Thus, in future studies, more VLPFC cells may prove to be multisensory, given the importance of task demands on prefrontal responses (Rao et al., 1997; Rainer et al., 1998).
Only a small number of neurons were unimodal auditory (14 of 387), whereas a larger proportion was unimodal visual (194 of 387), consistent with previous data showing mostly visual responsive cells in the VLPFC with a small auditory responsive zone located anterolaterally within area 12/47 (O'Scalaidhe et al., 1997; Romanski and Goldman-Rakic, 2002). In the current study, visual neurons were responsive to pictures of faces and nonface objects (n = 46 cells), movies depicting biological motion (n = 47 cells), or to both static and dynamic visual stimuli (n = 101 cells). The unimodal and multimodal visual motion cells recorded here suggest a potential role for the VLPFC in the perception and integration of biological motion. Multisensory neurons that respond to face and body movement, as well as auditory stimuli, have been recorded downstream from the VLPFC in the dorsal bank of the STS (Oram and Perrett, 1994; Barraclough et al., 2005), an area that is reciprocally and robustly connected with the VLPFC (Petrides and Pandya, 1988; Selemon and Goldman-Rakic, 1988; Cavada and Goldman-Rakic, 1989; Seltzer and Pandya, 1989; Barbas, 1992; Cusick et al., 1995; Hackett et al., 1999; Romanski et al., 1999a). This connection makes it possible that the VLPFC may receive already integrated audiovisual information from STS. Alternatively, the multisensory responses in the VLPFC could be a result of the integration of separate unimodal auditory and visual afferents, which target the VLPFC (Selemon and Goldman-Rakic, 1988; Webster et al., 1994; Hackett et al., 1999; Romanski et al., 1999a,b). The data presented here do not distinguish between these two cellular mechanisms for prefrontal audiovisual responses, and additional studies are needed to determine whether VLPFC cells perform the audiovisual integration or receive already integrated signals.
Our current results that some VLPFC multisensory neurons are selective for face and voice stimuli are in agreement with human functional magnetic resonance imaging (fMRI) studies indicating that a homologous region of the human brain, area 47 (pars orbitalis) is specifically activated by human vocal sounds compared with animal and nonvocal sounds (Fecteau et al., 2005). In contrast, the STS appears to be specialized for integrating general biological motion (Oram and Perrett, 1994; Barraclough et al., 2004) rather than solely communication stimuli, whereas the multisensory responses in the auditory cortex, which receives afferents from a number of cortical areas (Petrides and Pandya, 1988; Hackett et al., 1999; Romanski et al., 1999b) may be a product of these top-down cortical inputs (Ghazanfar et al., 2005). Thus, each cortical node in a sensory integration network may contribute uniquely to the processing of multisensory communication stimuli.
In both the STS and in the auditory cortex, biologically relevant audiovisual stimuli elicited multisensory enhancement in some cases and multisensory suppression in others (Barraclough et al., 2005; Ghazanfar et al., 2005), similar to what we have shown in the VLPFC. In the STS, Barraclough et al. (2005) found that neurons that exhibited multisensory enhancement, but not suppression, were strongly affected by stimulus congruence. Ghazanfar et al. (2005) suggested that multisensory suppression occurred more frequently with stimuli that had long VOTs. There was no correlation between VOT and the occurrence of suppression in the current study. Data from studies in the cat superior colliculus have suggested that enhancement occurs when multisensory stimuli are temporally synchronous and originate from the same region of space (Meredith et al., 1987; Meredith and Stein, 1986; Stanford et al., 2005). Several fMRI studies suggest that congruent multisensory communication stimuli (human vocalizations with corresponding mouth movements) induce enhanced activity, whereas incongruent multisensory stimuli result in decreased activations (Calvert et al., 2001). However, this does not hold true in all studies (Miller and D'Esposito, 2005; Ojanen et al., 2005). In their fMRI analysis of multisensory perception, Miller and D'Esposito (2005) asked subjects to evaluate temporally asynchronous stimuli and to categorize the stimuli as occurring simultaneously (fused percept) or sequentially (unfused percept). Some brain regions demonstrated an increase in activation when the stimuli were judged as fused and a decrease when stimuli were judged as unfused. The prefrontal cortex, however, showed the opposite effect whereby unfused (incongruent) percepts resulted in an increase and fused (congruent) percepts a decrease in activation. Ojanen et al. (2005) also noted a decrease in activation when subjects viewed congruent stimuli and an increase in activation during incongruent audiovisual speech stimuli in the prefrontal cortex. We found a higher proportion of multisensory suppressed cells compared with enhanced cells during the viewing of congruent audiovisual stimuli in the prefrontal cortex. The occurrence of multisensory suppression with congruent audiovisual stimuli could be attributable to the stimulus in one sensory modality acting as a distractor for the processing of the other modality or suppression might be seen as a mechanism of neuronal efficiency much like the neuronal suppression attributable to familiarity in inferotemporal cortical neurons (Ringo, 1996). Alternatively, because our stimuli are presented randomly as separate and conjoined audiovisual stimuli, neuronal activations in the VLPFC may reflect an “unfused” percept of the face and vocal stimuli, which could lead to suppression rather than enhancement (Miller and D'Esposito, 2005). Furthermore, multisensory suppression might be more likely to occur with the use of “optimum” stimuli, as in the present study. If degraded stimuli were presented, making recognition difficult on the basis of one “degraded' modality, the simultaneous bimodal stimulus presentation could lead to more superadditive responses, because unimodal responses would be decreased and recognition would be facilitated by the addition of a second modality, or more information. Specifically, if the neuronal response is related to the ability to discriminate the call being presented, either visual or auditory information may be sufficient in our experiments, and the addition of the other modality, in the multisensory condition, may not increase the response, in which case the neuron would appear to be multisensory suppressed in our analyses.
The principle of superadditivity, in which multisensory responses exceed the sum of the linear additive responses to the unimodal stimuli, has been advocated by some to be a requirement for brain regions involved in multisensory integration (Calvert and Thesen, 2004; Laurienti et al., 2005). Although many VLPFC neurons exhibited multisensory suppression, 27% of multisensory VLPFC cells were superadditive, suggesting that VLPFC is among the candidate brain regions involved in multisensory integration even when strict criteria are applied. Referring to both enhanced and suppressed neuronal populations as nonlinear preserves the idea that, in either case, the interaction could not be explained by the simple, linear sum of the unimodal components.
In conclusion, communication-relevant auditory and visual stimulus information reaches single cells of the VLPFC of the rhesus monkey. Integration of congruent audiovisual stimuli is achieved in the form of suppression or enhancement of the magnitude of neuronal responses. Additional work aimed at understanding the mechanism of sensory integration in the frontal lobes of nonhuman primates may provide us with an understanding of object recognition and speech perception in the human brain, which critically depends on the integration of multiple types of sensory information.
Footnotes
This work was supported by National Institutes of Health Grants DC004845-05 (L.M.R.) and DC05409 (P30; G. Paige, principal investigator) and by Cure Autism Now (L.M.R. and T.S.). We thank Drs. M. V. Chafee, D. Lee, and A. A. Stevens for helpful comments on this manuscript. We declare that we have no competing financial interests.
References
- Averbeck BB, Crowe DA, Chafee MV, Georgopoulos AP. Neural activity in prefrontal cortex during copying geometrical shapes. II. Decoding shape segments from neural ensembles. Exp Brain Res. 2003;150:142–153. doi: 10.1007/s00221-003-1417-5. [DOI] [PubMed] [Google Scholar]
- Barbas H. Architecture and cortical connections of the prefrontal cortex in the rhesus monkey. Adv Neurol. 1992;57:91–115. [PubMed] [Google Scholar]
- Barraclough NE, Xiao D, Baker CI, Oram MW, Perrett DI. Integration of visual and auditory information by superior temporal sulcus neurons responsive to the sight of actions. J Cogn Neurosci. 2005;17:377–391. doi: 10.1162/0898929053279586. [DOI] [PubMed] [Google Scholar]
- Beauchamp MS, Lee KE, Argall BD, Martin A. Integration of auditory and visual information about objects in superior temporal sulcus. Neuron. 2004;41:809–823. doi: 10.1016/s0896-6273(04)00070-4. [DOI] [PubMed] [Google Scholar]
- Benevento LA, Fallon J, Davis BJ, Rezak M. Auditory–visual interaction in single cells in the cortex of the superior temporal sulcus and the orbital frontal cortex of the macaque monkey. Exp Neurol. 1977;57:849–872. doi: 10.1016/0014-4886(77)90112-1. [DOI] [PubMed] [Google Scholar]
- Bodner M, Kroger J, Fuster JM. Auditory memory cells in dorsolateral prefrontal cortex. NeuroReport. 1996;7:1905–1908. doi: 10.1097/00001756-199608120-00006. [DOI] [PubMed] [Google Scholar]
- Broca P. Remarques su le siege defaulte de langage articule suivies d'une observation d'aphemie (perte de la parole) Bull Soc Anthropol. 1861;2:330–337. [Google Scholar]
- Calvert GA. Crossmodal processing in the human brain: insights from functional neuroimaging studies. Cereb Cortex. 2001;11:1110–1123. doi: 10.1093/cercor/11.12.1110. [DOI] [PubMed] [Google Scholar]
- Calvert GA, Thesen T. Multisensory integration: methodological approaches and emerging principles in the human brain. J Physiol (Paris) 2004;98:191–205. doi: 10.1016/j.jphysparis.2004.03.018. [DOI] [PubMed] [Google Scholar]
- Calvert GA, Hansen PC, Iversen SD, Brammer MJ. Detection of audio-visual integration sites in humans by application of electrophysiological criteria to the BOLD effect. NeuroImage. 2001;14:427–438. doi: 10.1006/nimg.2001.0812. [DOI] [PubMed] [Google Scholar]
- Cavada C, Goldman-Rakic PS. Posterior parietal cortex in rhesus monkey: II. Evidence for segregated corticocortical networks linking sensory and limbic areas with the frontal lobe. J Comp Neurol. 1989;287:422–445. doi: 10.1002/cne.902870403. [DOI] [PubMed] [Google Scholar]
- Cusick CG, Seltzer B, Cola M, Griggs E. Chemoarchitectonics and corticocortical terminations within the superior temporal sulcus of the rhesus monkey: evidence for subdivisions of superior temporal polysensory cortex. J Comp Neurol. 1995;360:513–535. doi: 10.1002/cne.903600312. [DOI] [PubMed] [Google Scholar]
- Evans TA, Howell S, Westergaard GC. Auditory-visual cross-modal perception of communicative stimuli in tufted capuchin monkeys (Cebus apella) J Exp Psychol Anim Behav Process. 2005;31:399–406. doi: 10.1037/0097-7403.31.4.399. [DOI] [PubMed] [Google Scholar]
- Fecteau S, Armony JL, Joanette Y, Belin P. Sensitivity to voice in human prefrontal cortex. J Neurophysiol. 2005;94:2251–2254. doi: 10.1152/jn.00329.2005. [DOI] [PubMed] [Google Scholar]
- Funahashi S, Bruce CJ, Goldman-Rakic PS. Visuospatial coding in primate prefrontal neurons revealed by oculomotor paradigms. J Neurophysiol. 1990;63:814–831. doi: 10.1152/jn.1990.63.4.814. [DOI] [PubMed] [Google Scholar]
- Fuster JM. Philadelphia: Lippincott-Raven; 1997. The prefrontal cortex: anatomy, physiology, and neuropsychology of the frontal lobe. [Google Scholar]
- Fuster JM, Bodner M, Kroger JK. Cross-modal and cross-temporal association in neurons of frontal cortex. Nature. 2000;405:347–351. doi: 10.1038/35012613. [DOI] [PubMed] [Google Scholar]
- Gabrieli JDE, Poldrack RA, Desmond JE. The role of left prefrontal cortex in language and memory. Proc Natl Acad Sci USA. 1998;95:906–913. doi: 10.1073/pnas.95.3.906. [DOI] [PMC free article] [PubMed] [Google Scholar]
- Gaffan D, Harrison S. Auditory-visual associations, hemispheric specialization and temporal- frontal interaction in the rhesus monkey. Brain. 1991;114:2133–2144. doi: 10.1093/brain/114.5.2133. [DOI] [PubMed] [Google Scholar]
- Ghazanfar AA, Logothetis NK. Facial expressions linked to monkey calls. Nature. 2003;423:937–938. doi: 10.1038/423937a. [DOI] [PubMed] [Google Scholar]
- Ghazanfar AA, Maier JX, Hoffman KL, Logothetis NK. Multisensory integration of dynamic faces and voices in rhesus monkey auditory cortex. J Neurosci. 2005;25:5004–5012. doi: 10.1523/JNEUROSCI.0799-05.2005. [DOI] [PMC free article] [PubMed] [Google Scholar]
- Gifford GW, III, Maclean KA, Hauser MD, Cohen YE. The neurophysiology of functionally meaningful categories: macaque ventrolateral prefrontal cortex plays a critical role in spontaneous categorization of species-specific vocalizations. J Cogn Neurosci. 2005;17:1471–1482. doi: 10.1162/0898929054985464. [DOI] [PubMed] [Google Scholar]
- Goldman-Rakic P. Plum F. Handbook of physiology. Vol V. Bethesda, MD: American Physiological Society; 1987. Circuitry of primate prefrontal cortex and regulation of behavior by representational memory; pp. 373–418. Higher functions of the brain, The nervous system, Sec 1. [Google Scholar]
- Hackett TA, Stepniewska I, Kaas JH. Prefrontal connections of the parabelt auditory cortex in macaque monkeys. Brain Res. 1999;817:45–58. doi: 10.1016/s0006-8993(98)01182-2. [DOI] [PubMed] [Google Scholar]
- Hauser MD, Marler P. Food associated calls in rhesus macaques (Macaca mulatta) I. Socioecological factors. Behav Ecol. 1993;4:194–205. [Google Scholar]
- Hauser MD, Evans CS, Marler P. The role of articulation in the production of rhesus-monkey, Macaca-mulatta, vocalizations. Anim Behav. 1993;45:423–433. [Google Scholar]
- Homae F, Hashimoto R, Nakajima K, Miyashita Y, Sakai KL. From perception to sentence comprehension: the convergence of auditory and visual information of language in the left inferior frontal cortex. NeuroImage. 2002;16:883–900. doi: 10.1006/nimg.2002.1138. [DOI] [PubMed] [Google Scholar]
- Izumi A, Kojima S. Matching vocalizations to vocalizing faces in a chimpanzee (Pan troglodytes) Anim Cogn. 2004;7:179–184. doi: 10.1007/s10071-004-0212-4. [DOI] [PubMed] [Google Scholar]
- Johnson RA, Wichern DW. Saddle River, NJ: Prentice Hall; 1998. Applied multivariate statistical analysis. [Google Scholar]
- Jones JA, Callan DE. Brain activity during audiovisual speech perception: an fMRI study of the McGurk effect. NeuroReport. 2003;14:1129–1133. doi: 10.1097/00001756-200306110-00006. [DOI] [PubMed] [Google Scholar]
- Laurienti PJ, Perrault TJ, Stanford TR, Wallace MT, Stein BE. On the use of superadditivity as a metric for characterizing multisensory integration in functional neuroimaging studies. Exp Brain Res. 2005;166:289–297. doi: 10.1007/s00221-005-2370-2. [DOI] [PubMed] [Google Scholar]
- McGurk H, MacDonald J. Hearing lips and seeing voices. Nature. 1976;264:746–748. doi: 10.1038/264746a0. [DOI] [PubMed] [Google Scholar]
- Meredith MA, Stein BE. Interactions among converging sensory inputs in the superior colliculus. Science. 1983;227:389–391. doi: 10.1126/science.6867718. [DOI] [PubMed] [Google Scholar]
- Meredith MA, Stein BE. Visual, auditory, and somatosensory convergence on cells in superior colliculus results in multisensory integration. J Neurophysiol. 1986;56:640–662. doi: 10.1152/jn.1986.56.3.640. [DOI] [PubMed] [Google Scholar]
- Meredith MA, Nemitz JW, Stein BE. Determinants of multisensory integration in superior colliculus neurons. I. Temporal factors. J Neurosci. 1987;7:3215–3229. doi: 10.1523/JNEUROSCI.07-10-03215.1987. [DOI] [PMC free article] [PubMed] [Google Scholar]
- Miller EK. The prefrontal cortex and cognitive control. Nat Rev Neurosci. 2000;1:59–65. doi: 10.1038/35036228. [DOI] [PubMed] [Google Scholar]
- Miller LM, D'Esposito M. Perceptual fusion and stimulus coincidence in the cross-modal integration of speech. J Neurosci. 2005;25:5884–5893. doi: 10.1523/JNEUROSCI.0896-05.2005. [DOI] [PMC free article] [PubMed] [Google Scholar]
- O'Scalaidhe SP, Wilson FA, Goldman-Rakic PS. Areal segregation of face-processing neurons in prefrontal cortex. Science. 1997;278:1135–1138. doi: 10.1126/science.278.5340.1135. [DOI] [PubMed] [Google Scholar]
- O'Scalaidhe SP, Wilson FAW, Goldman-Rakic PGR. Face-selective neurons during passive viewing and working memory performance of rhesus monkeys: evidence for intrinsic specialization of neuronal coding. Cereb Cortex. 1999;9:459–475. doi: 10.1093/cercor/9.5.459. [DOI] [PubMed] [Google Scholar]
- Ojanen V, Möttönen R, Pekkola J, Jääskeläinen IP, Joensuu R, Autti T, Sams M. Processing of audiovisual speech in Broca's area. NeuroImage. 2005;25:333–338. doi: 10.1016/j.neuroimage.2004.12.001. [DOI] [PubMed] [Google Scholar]
- Oram MW, Perrett D. Response of the anterior superior polysensory (STPa) neurons to “biological motion” stimuli. J Cogn Neurosci. 1994;6:99–116. doi: 10.1162/jocn.1994.6.2.99. [DOI] [PubMed] [Google Scholar]
- Petrides M, Pandya DN. Association fiber pathways to the frontal cortex from the superior temporal region in the rhesus monkey. J Comp Neurol. 1988;273:52–66. doi: 10.1002/cne.902730106. [DOI] [PubMed] [Google Scholar]
- Petrides M, Pandya DN. Comparative cytoarchitectonic analysis of the human and the macaque ventrolateral prefrontal cortex and corticocortical connection patterns in the monkey. Eur J Neurosci. 2002;16:291–310. doi: 10.1046/j.1460-9568.2001.02090.x. [DOI] [PubMed] [Google Scholar]
- Pigarev IN, Rizzolatti G, Schandolara C. Neurons responding to visual stimuli in the frontal lobe of macaque monkeys. Neurosci Lett. 1979;12:207–212. doi: 10.1016/0304-3940(79)96063-4. [DOI] [PubMed] [Google Scholar]
- Preuss TM, Goldman-Rakic PS. Myelo- and cytoarchitecture of the granular frontal cortex and surrounding regions in the strepsirhine primate Galago and the anthropoid primate Macaca. J Comp Neurol. 1991;310:429–474. doi: 10.1002/cne.903100402. [DOI] [PubMed] [Google Scholar]
- Price CJ. The functional anatomy of word comprehension and production. Trends Cogn Sci. 1998;2:281–288. doi: 10.1016/s1364-6613(98)01201-7. [DOI] [PubMed] [Google Scholar]
- Rainer G, Asaad WF, Miller EK. Selective representation of relevant information by neurons in the primate prefrontal cortex. Nature. 1998;393:577–579. doi: 10.1038/31235. [DOI] [PubMed] [Google Scholar]
- Rao SC, Rainer G, Miller EK. Integration of what and where in the primate prefrontal cortex. Science. 1997;276:821–824. doi: 10.1126/science.276.5313.821. [DOI] [PubMed] [Google Scholar]
- Ringo JL. Stimulus specific adaptation in inferior temporal and medial temporal cortex of the monkey. Behav Brain Res. 1996;76:191–197. doi: 10.1016/0166-4328(95)00197-2. [DOI] [PubMed] [Google Scholar]
- Romanski LM, Goldman-Rakic PS. An auditory domain in primate prefrontal cortex. Nat Neurosci. 2002;5:15–16. doi: 10.1038/nn781. [DOI] [PMC free article] [PubMed] [Google Scholar]
- Romanski LM, Bates JF, Goldman-Rakic PS. Auditory belt and parabelt projections to the prefrontal cortex in the rhesus monkey. J Comp Neurol. 1999a;403:141–157. doi: 10.1002/(sici)1096-9861(19990111)403:2<141::aid-cne1>3.0.co;2-v. [DOI] [PubMed] [Google Scholar]
- Romanski LM, Tian B, Fritz J, Mishkin M, Goldman-Rakic PS, Rauschecker JP. Dual streams of auditory afferents target multiple domains in the primate prefrontal cortex. Nat Neurosci. 1999b;2:1131–1136. doi: 10.1038/16056. [DOI] [PMC free article] [PubMed] [Google Scholar]
- Romanski LM, Averbeck BB, Diltz M. Neural representation of vocalizations in the primate ventrolateral prefrontal cortex. J Neurophysiol. 2005;93:734–747. doi: 10.1152/jn.00675.2004. [DOI] [PubMed] [Google Scholar]
- Romo R, Brody CD, Hernandez A, Lemus L. Neuronal correlates of parametric working memory in the prefrontal cortex. Nature. 1999;399:470–473. doi: 10.1038/20939. [DOI] [PubMed] [Google Scholar]
- Rosenkilde CE. Functional heterogeneity of the prefrontal cortex in the monkey: a review. Behav Neural Biol. 1979;25:301–345. doi: 10.1016/s0163-1047(79)90404-7. [DOI] [PubMed] [Google Scholar]
- Selemon LD, Goldman-Rakic PS. Common cortical and subcortical targets of the dorsolateral prefrontal and posterior parietal cortices in the rhesus monkey: evidence for a distributed neural network subserving spatially guided behavior. J Neurosci. 1988;8:4049–4068. doi: 10.1523/JNEUROSCI.08-11-04049.1988. [DOI] [PMC free article] [PubMed] [Google Scholar]
- Seltzer B, Pandya DN. Frontal lobe connections of the superior temporal sulcus in the rhesus monkey. J Comp Neurol. 1989;281:97–113. doi: 10.1002/cne.902810108. [DOI] [PubMed] [Google Scholar]
- Stanford TR, Quessy S, Stein BE. Evaluating the operations underlying multisensory integration in the cat superior colliculus. J Neurosci. 2005;25:6499–6508. doi: 10.1523/JNEUROSCI.5095-04.2005. [DOI] [PMC free article] [PubMed] [Google Scholar]
- Stein BE, Meredith MA. Cambridge, MA: MIT; 1993. The merging of the senses. [Google Scholar]
- Webster MJ, Bachevalier J, Ungerleider LG. Connections of inferior temporal areas TEO and TE with parietal and frontal cortex in macaque monkeys. Cereb Cortex. 1994;4:470–483. doi: 10.1093/cercor/4.5.470. [DOI] [PubMed] [Google Scholar]
- Wilson FA, O'Scalaidhe SP, Goldman-Rakic PS. Dissociation of object and spatial processing domains in primate prefrontal cortex. Science. 1993;260:1955–1958. doi: 10.1126/science.8316836. [DOI] [PubMed] [Google Scholar]