

Abstract
AIMS
We aimed to describe the pharmacokinetic interaction between phenytoin, a potent CYP3A4 and P-glycoprotein (P-gp) (ABCB1) inducer, and gefitinib, a CYP3A4, CYP2D6 and P-gp substrate.
METHODS
An open-label, randomized, two-phase crossover study was conducted. Eighteen healthy male volunteers (nine homozygous CC and nine homozygous TT as determined by their ABCB1 C3435T polymorphism in exon 26) received a single oral dose of 250 mg gefitinib alone or after 5 days treatment with phenytoin (5 mg kg−1 daily). Gefitinib plasma concentrations were determined by high-performance liquid chromatography. Hepatic CYP3A4 activity was evaluated by the 14C-erythromycin breath test (ERMBT) and the ABCB1 and CYP2D6 genetic polymorphisms were determined by the TaqMan allelic discrimination assay and long polymerase chain reaction, respectively.
RESULTS
Following treatment with phenytoin, mean gefitinib Cmax and AUC0–∞ decreased by 26 ± 44% [95% confidence interval (CI) for the difference 5–48%, P= 0.005] and 47 ± 26% (95% CI for the difference 34–60%, P= 0.001), respectively, and apparent oral clearance increased by 126 ± 93% (95% CI for the difference 80–172%, P= 0.004). Concomitantly, phenytoin increased the mean ERMBT by 91 ± 44% (95% CI 75–105%, P < 0.001) from baseline, but the extent of liver CYP3A4 induction was not correlated to the extent of interaction. Furthermore, this interaction was independent of ABCB1 genetic polymorphism. The CYP2D6 genotype was slightly but significantly related to gefitinib clearance (P= 0.04) during the control phase.
CONCLUSIONS
The significant interaction between gefitinib and phenytoin was not correlated with the erythromycin breath test and was independent of ABCB1 polymorphism, but may involve presystemic CYP3A-mediated intestinal first-pass.
Keywords: gefitinib, induction, liver CYP3A4, P-gp, phenytoin
WHAT IS ALREADY KNOWN ABOUT THIS SUBJECT
The response to gefitinib is variable and could be explained partly by the interindividual variability in gefitinib exposure.
Gefitinib is mainly metabolized by CYP3A4 and CYP2D6, and is to a lesser extent a P-glycoprotein (P-gp) substrate.
Patients with cancer are at high risk of drug–drug interactions, such as with phenytoin, a potent CYP3A4 inducer.
WHAT THIS STUDY ADDS
The reduced systemic exposure of gefitinib with multiple-dose phenytoin treatment.
An effect attributed to the possible induction of intestinal CYP3A4 because of the lack of correlation between changes in gefitinib disposition and the erythromycin breath test and the lack of association between allelic variant in the ABCB1 gene and baseline and induced oral gefitinib clearance.
The CYP2D6 extensive metabolizer seems to be less sensitive to the interaction with phenytoin, as the magnitude of induction of gefitinib clearance was greater in CYP2D6 poor metabolizers than in CYP2D6 extensive metabolizers.
Introduction
Gefitinib (ZD 1839) is the first available oral quinazoline compound referred to as a ‘selective’ epidermal growth factor (EGF) receptor-tyrosine kinase inhibitor [1]. It provides an antiproliferative effect by blocking signal transduction from the EGF receptor and has been recently approved as third-line monotherapy in Japan for the treatment of cancer patients who present with locally advanced inoperable or recurrent non-small cell lung carcinoma. Gefitinib systemic exposure is rather complex and highly variable between subjects [1]. Gefitinib is a high-extraction drug with a mean volume of distribution of about 1500 l in humans and is subject to complex and extensive presystemic first-pass [1]. Drug-transport proteins including P-glycoprotein (P-gp) and drug-metabolizing enzymes, e.g. cytochromes P450 (CYP), are relevant factors affecting the pharmacokinetic profile of gefitinib. Preclinical studies performed with human liver microsomes suggested that CYP3A4 was the major enzyme involved in gefitinib metabolism. The 3A4 isoform accounts for as much as 35% of total CYPs expressed in the liver and 80% in the small intestine [2, 3]. CYP3A4 metabolizes as much as 60% of the currently marketed drugs. Human liver CYP3A4 activity varies widely between individuals and may account for some of the interindividual variability in gefitinib exposure. Interestingly, P-gp and CYP3A4 are often co-expressed in the same cells and share a large number of substrates [4]. Swaisland et al. showed that co-administration of the well-known potent CYP3A4 and P-gp inducer rifampin decreased gefitinib systemic exposure by 83%, while the potent CYP3A4 and P-gp inhibitor itraconazole increased gefitinib systemic exposure by nearly 80% in healthy volunteers [5]. Therefore, concomitant use of drugs that are either metabolized and/or modulators of CYP3A4 may affect gefitinib systemic exposure with clinical consequences.
Further in vitro and in vivo studies have revealed that gefitinib was also metabolized by CYP2D6, but its exact role in the clinical setting is unclear [6, 7]. CYP2D6 expression is known to be polymorphic, depending on at least 16 different alleles. Approximately 7–10% of Whites completely lack CYP2D6 activity as a consequence of deletion mutation in both alleles of the CYP2D6. Swaisland et al. showed that, following a single dose of gefitinib, exposure in poor CYP2D6 metabolizers was nearly double that seen in extensive metabolizers [8]. Swaisland et al. recently showed that co-administration of gefitinib with the CYP2D6 substrate metoprolol resulted in a 35% increase in metoprolol exposure, but this moderate interaction would not have a clinically relevant effect [5]. Hence, it is currently unclear whether or not CYP2D6 may explain interindividual variability associated with gefitinib systemic exposure either alone or in association with other CYP2D6 substrates.
Besides gefitinib metabolism, in vitro studies have shown that gefitinib is a substrate and modulator of P-gp [9], an ATP-dependent efflux transporter responsible for multidrug resistance in cancer cells [10]. P-gp is expressed in various normal tissues including the small intestine, liver, kidney tubules, placenta, and endothelial cells lining the blood–brain barrier [11]. Variable intestinal P-gp expression has recently been linked to a genetic polymorphism located in exon 26 (C3435T) of the multidrug resistance-1 (MDR1 or ABCB1) gene encoding for P-gp. Reported genetic polymorphisms of ABCB1 showed high inter-ethnic variability, and numerous studies enrolling patients with the TT (associated with low P-gp expression), CT (associated with intermediate P-gp expression), and CC (associated with high P-gp expression) genotypes have tried to evaluate the impact of this genetic polymorphism on the pharmacokinetics of numerous drugs, e.g. digoxin or nelfinavir [12, 13]. Hence, this polymorphic transport protein may play a role in limiting intestinal absorption of gefitinib or in enhancing its biliary and/or renal elimination in humans. It is not currently known whether or not the ABCB1 genetic polymorphism could predict the drug–drug interactions involving gefitinib in cancer patients.
Patients with cancer are at high risk of drug–drug interactions. Such patients may indeed concomitantly receive cytotoxic chemotherapy, hormonal agents and also supportive care with antiemetics, analgesics and anticonvulsants [14]. Phenytoin is a well-known anticonvulsant used in epileptic patients, including those with advanced lung cancer and brain metastases. Phenytoin is a potent inducer of CYP3A4 [15] and is known to reduce significantly serum concentrations of a number of cytotoxic drugs, e.g. methotrexate, vincristine, irinotecan, cisplatin and teniposide with possible loss of efficacy [16]. Phenytoin may therefore interact with gefitinib, and the characterization of this drug–drug interaction is important for a rational and predictive approach to avoid treatment failure by individualized dose adjustments or contraindication of the association [17].
Among the numerous probes available for assessing hepatic CYP3A4 activity, the 14C-[N-methyl]-erythromycin breath test (ERMBT) is a commonly used non-invasive phenotype probe for liver CYP3A4 activity in healthy subjects and patients [18]. The result can be obtained in <1 h and provide a reliable and reproducible measure of liver CYP3A4 activity and of the effect of modulators on the basal activity of the enzyme in humans. The ERMBT has been extensively used to evaluate the role of liver CYP3A4 activity in the pharmacokinetics of numerous drugs, including the anticancer agent docetaxel [19], the immunosuppressant ciclosporin [20], the antibiotic rifampin [21] and more recently the human immunodeficiency virus (HIV) non-nucleoside reverse transcriptase inhibitors delavirdine [22] and efavirenz [23]. The ERMBT also reliably described the effects of inducers and inhibitors on liver CYP3A4 activity [21–23]. In addition, in a recent study conducted in HIV-infected patients [24], the ERMBT results correlated with the in vitro inhibition of CYP3A4 by the HIV-protease inhibitor nelfinavir. Hence, it may be able to determine the extent of liver CYP3A4 induction by phenytoin and also whether or not the drug–drug interaction between gefitinib and phenytoin, if any, could be predicted by liver CYP3A4 induction.
Some studies have suggested a possible association between gefitinib exposure and toxicity. In the randomized Phase II trials IDEAL 1 and 2, where gefitinib doses were evaluated, higher gefitinib concentrations resulted in a greater incidence of drug-related toxicity (diarrhoea, skin toxicity) [25]. Similar results were found by Li et al.[26]. Decreasing gefitinib concentrations due to drug–drug interaction could be observed with phenytoin and may be of major concern regarding clinical efficacy. The effect of phenytoin on gefitinib pharmacokinetics should therefore be characterized in order to individualize dosing regimen in order to achieve appropriate inhibitory concentrations in tumours, or simply contraindicate the association between gefitinib and phenytoin in patients.
In this regard, we carried out a clinical study in healthy volunteers to characterize this pharmacokinetic interaction. Assuming a blood flow-independent hepatic extraction of gefitinib [1], we hypothesized that phenytoin would increase gefitinib apparent oral clearance (CL/F) by at least 50%, due to a concomitant 50% increase in liver CYP3A4, as assessed by the ERMBT [5, 6, 8, 15]. The secondary aim was to determine whether this pharmacokinetic interaction was influenced by the C3435T and CYP2D6 genetic polymorphisms and CYP3A4 liver activity in order to identify patients in whom such a drug association may or may not be recommended in the clinical setting.
Patients and methods
Materials
Single dose vials containing 14C-[N-Methyl]-erythromycin (25 kBq) were purchased from Metabolic Solutions (Nashua, NH, USA). Gefitinib was kindly provided by Astra-Zeneca (Reims, France); phenytoin (Di-Hydan®) by Genopharm Laboratory (Lagny, France). All other chemicals and reagents were of high-performance liquid chromatography (HPLC) grade where appropriate.
Subjects
All volunteers were recruited from a pool of subjects who had been genotyped for the single nucleotide polymorphism (SNP) located on exon 26 (C3435T) of the ABCB1 gene encoding for P-gp, as previously described [27]. Healthy male subjects, of any ethnic background, aged between 18 and 65 years, within 30% of ideal body weight, from whom written informed consent was obtained and carrying the CC or TT alleles, were enrolled after they underwent complete physical examination including medical history and vital signs, and routine laboratory tests. Exclusion criteria included abnormal physical examination, history of allergy to erythromycin, or routine chemical or haematological laboratory values that were not within normal range. None of the subjects was taking any medication, either prescription or non-prescription (including herbal products), known to alter CYP3A4, CYP2D6 and P-gp function for at least 1 week prior to the study. All were asked to abstain from grapefruit juice (or grapefruit or Seville orange products) for at least 7 days prior to and during the study. This study was approved by the ethics committee of Paris, Saint-Louis. All patients gave their written informed consent prior to participation.
Study design
The study followed an open-label, randomized, two-phase crossover design, each phase being separated by at least 1 week. During the control phase, overnight fasting subjects came to the therapeutic research unit on day 1 and underwent evaluation of their basal liver CYP3A4 activity using the ERMBT, and a blood sample was collected. They were then given one 250-mg gefitinib tablet (Iressa®; Astra-Zeneca) and 2 ml of blood was collected respectively 1, 3, 4, 5, 6, 7, 8, 9, 11, 24, 48, 96 and 192 h after drug intake. The patients were allowed to eat 4 h after drug intake. During the interaction phase, subjects were evaluated for their liver CYP3A4 activity at baseline using the ERMBT and received phenytoin tablets (Di-Hydan®; Genopharm Laboratory) 2.5 mg kg−1 orally twice daily (at 08.00 and 20.00 h) over 7 days. On day 5, one 250-mg gefitinib tablet was given orally after an evaluation of liver CYP3A4 activity and just before the morning dose of phenytoin. A 192-h pharmacokinetic study was then performed following gefitinib intake using the same schedule as during the control phase. On day 7, volunteers underwent a second evaluation of their liver CYP3A4 activity and the trough phenytoin plasma concentration was determined.
In fact, all volunteers who started with the interaction phase were enrolled in the control phase at least 3 weeks after the first one in order to comply with each individual time schedule. Moreover, the volunteers should have a phenytoin trough concentration under the limit of quantification before starting the control phase.
Erythromycin breath test procedure
The ERMBT was administered as previously described [18]. Briefly, a breath sample was collected at baseline and 20 min after 111 kBq (0.074 mmol, 0.0543 mg) of 14C-[N-methyl]-erythromycin (Metabolic Solutions Inc.) was injected intravenously. Breath test results were expressed as the percent of administered 14C that was exhaled during the first hour after the injection of erythromycin, estimated from the rate of 14CO2 exhaled at 20 min [18, 28].
Gefitinib serum concentration determination and pharmacokinetic analysis
Blood samples were centrifuged within 10 min at 1500 g for 10 min, at room temperature, to provide two plasma aliquots for analysis of gefitinib. Gefitinib concentrations in plasma were determined using a validated HPLC-MS-MS analytical method [29]. Drug assays were carried out by Analytico Medinet BV (Breda, the Netherlands). Briefly, after addition of the internal standard, the sample [0.5 ml calibrator, quality control (QC) sample or unknown] was extracted at pH 8 using 6 ml methyl-ter-butyl ether and 0.001 M NaOH. After centrifugation, snap freezing was performed and the organic layer was transferred to a clean tube. After evaporation to dryness at ambient temperature under a stream of nitrogen, the dry residue was reconstituted in 250 µl mobile phase (acetonitrile/water-ammonium acetate, 8 : 2, v/v) and aliquots injected into an Intersil 150 × 4.6 mm ODS3 C18 HPLC column. Gefitinib was detected using a triple quadrupole mass spectrometer with a heated nebulizer source. The lower limit of quantification of the assay was 0.5 ng ml−1. During the analysis, QC samples included in the analytical runs showed an inter- and intra-assay precision <14% and an overall relative standard deviation (SD) ranging from 101 to 115% of the corresponding nominal concentration.
Gefitinib oral pharmacokinetics was described by a noncompartmental method using WinNonlin (version 4.1; Pharsight, Mountain View, CA, USA). The terminal elimination rate constant (λz) was determined by linear regression of at least the three last data points from the log-linear concentration–time curve. The area under the concentration–time curve was determined by the linear trapezoidal method and extrapolation to infinity time by dividing the last measured concentration by λz. Apparent oral clearance (CL/F) was calculated as the ratio of the dose to AUC0–∞. The maximum concentration (Cmax) and the time to reach Cmax (Tmax) were determined by visual inspection of the concentration–time curve.
ABCB1 and CYP2D6 genotyping
Genomic DNA was extracted from whole-blood samples with the Puregene DNA isolation kit (Gentra Systems, Minneapolis, MN, USA) according to the manufacturer's recommendations. Purified genomic DNA was stored at −20°C. Genotyping for allelic variations was performed by use of the TaqMan allelic discrimination assay (Applied Biosystems, Foster City, CA, USA). C3435T ABCB1 SNP (rs1045642, GenBank Accession No. NT_007933) genotyping was performed as previously described [30]. Genotyping for the four major mutants alleles (*3, *4, *5, *6 alleles mutations) for the CYP2D6 gene determine most of the poor metabolizer phenotypes in Whites. Detection of the gene duplication and deletion (CYP2D6*5) was performed using the long polymerase chain reaction (PCR) method as previously described [31]. The CYP2D6*6 allele was detected by use of the long PCR method for the whole-gene amplification, followed by a subsequent nested PCR and restriction enzyme analysis [32]. Genotyping for *3 and *4 alleles was carried out by means of allele-specific 5′ nuclease assay using the predeveloped reagents of TaqMan Universal PCR Master Mix, TaqMan probes, and PCR primers (Applied Biosystems). Each probe set was designed to discriminate the studied mutation, respectively. The assay utilized specific 5′ degradation of probes during the PCR, resulting in allele-specific dye release from the probes. The thermocycling reaction and allele discrimination were performed using the ABI Prism 7700 sequence detection system (Applied Biosystems) according to the manufacturer's instructions.
The post-PCR-generated fluorescence intensity was quantified by use of an ABI PRISM 7700 Sequence Detector System (software version 1.7; Applied Biosystems). Each SNP genotyping procedure was performed in duplicate for each patient. Five samples of each genotype (wild-type homozygous, heterozygous, or homozygous for the allelic variant) of each SNP identified by TaqMan allelic discrimination (Applied Biosystems) were sequenced to validate the genotyping assays. All PCR reagents were purchased from Applied Biosystems.
Phenytoin assay
Blood samples were centrifuged at 1500 g for 10 min, at room temperature, to provide two plasma aliquots. The phenytoin plasma concentration was determined by fluorescence polarization immunoassay (FPIA) analyser (AxSYM™; Abott Diagnostic, Rungis, France) as previously described [31]. The FPIA (AxSYM™) phenytoin kits (reagents and calibrators) used in this study to measure total phenytoin concentration were obtained from Abbott Laboratories (Rungis, France). The limit of quantification was 1 mg l−1. The therapeutic range of phenytoin in plasma was set between 10 and 20 mg l−1, as previously described [33] and the absence of analytical interference with gefitinib was checked.
Statistical analysis
All continuous variables were expressed as means ± SD. A sample size of 18 subjects (nine carrying the CC and nine the TT genotype for the ABCB1 polymorphism in exon 26) was needed to have at least 80% power to detect a 50% decrease in gefitinib AUC0–∞ in the presence of phenytoin compared with control (with α= 0.05 as the level of significance), assuming an interindividual variability of 60% (SD of the observed effect). The effect of phenytoin on the gefitinib systemic exposure parameters was expressed as the percent change from control with the 95% confidence interval (CI) for the difference determined with a t-test for two-tailed paired comparisons. Paired comparisons were analysed with the nonparametric Wilcoxon signed rank test. The relationship between gefitinib systemic exposure and hepatic CYP3A4 activity (ERMBT) was examined using the nonparametric Spearman's rank correlation coefficient. The influence of CYP2D6 genotypes on the gefitinib CL/F was evaluated by means of the nonparametric Kruskal–Wallis test followed by Dunn test adjusted for multiple comparisons if any difference was detected in Kruskall–Wallis test. The influence of ABCB1 polymorphism was analysed on the gefitinib AUC0–∞ by the nonparametric Mann–Whitney U-test. All statistical analyses were performed using Graph-Pad Prism 3.0 software (GraphPad Software, San Diego, CA, USA). A P-value of ≤0.05 was considered as statistically significant for all performed comparisons.
Results
Demographic characteristics
Eighteen healthy male subjects were enrolled and completed the study. Mean age, weight and body surface area were 30 ± 9 years, 70 ± 11 kg and 1.9 ± 0.2 m2, respectively. Fourteen subjects (78%) were White, one (6%) was African and three (32%) Asian.
Tolerability and safety
Gefitinib alone or in combination with phenytoin was well tolerated. Only minor adverse events were reported during the interaction phase, including skin rash in one case and dizziness in three cases. These events were attributed to phenytoin because they were not reported during the control phase with gefitinib alone and completely resolved within 1 week after treatment completion.
Induction of liver CYP3A4 by phenytoin
Phenytoin significantly increased the ERMBT by 91 ± 44% (95% CI for the difference 75–105%, P < 0.001). No significant difference between the ERMBT at day 5 and day 7 of the interaction phase was observed (P= 0.2, Figure 1). Baseline liver CYP3A4 as measured by the ERMBT ranged between 1.1 and 3.1%. The mean inter- and intraindividual variability was 23 ± 3% and 11 ± 11%, respectively, and remained stable over time (P= 0.24). Mean phenytoin plasma concentration at day 7 was 14 ± 6 mg l−1 (range 4.5–26.4 mg l−1, as previously observed [33]).
Figure 1.
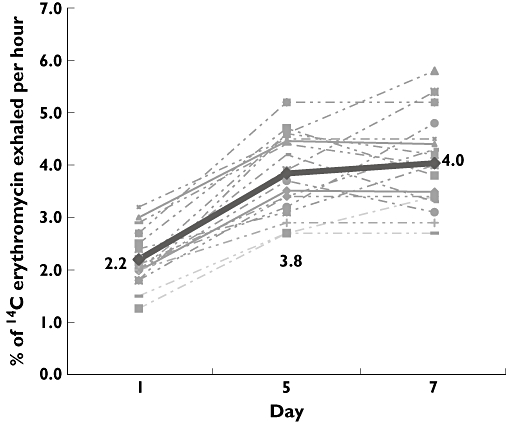
Effects of phenytoin treatment (5 mg kg−1 day−1) on the 14C-erythromycin breath test (ERMBT) results in 18 healthy volunteers. Dotted line represented individual ERBMT results and the continuous (bold) line represented mean ERMBT results. Errors bars have been omitted for clarity
Gefitinib pharmacokinetics alone and in the presence of phenytoin
As shown in Table 1 and Figure 2, phenytoin decreased the mean gefitinib Cmax by 26 ± 44% (95% CI for the difference 5–48%, P= 0.005), Tmax by 12 ± 3% (95% CI for the difference −2–27%, P= 0.04) and AUC0–∞ by 47 ± 26% (95% CI for the difference 34–60%, P < 0.001). Apparent oral clearance increased by 126 ± 93% (95% CI for the difference 80, 172, P= 0.004) compared with the control phase (t-test for two-tailed paired comparisons). Gefitinib elimination half-life remained unchanged (95% CI for the difference −5–25%, P= 0.16).
Table 1.
Effect of phenytoin on gefitinib pharmacokinetics in healthy volunteers
| Mean ± SD pharmacokinetic parameters | Control phase | Interaction phase with phenytoin | % Change mean ± SD (95% CI for the difference) | P-value** |
|---|---|---|---|---|
| Tmax (h) | 5.5 ± 2 | 4.5 ± 1.2 | 12 ± 30% | 0.04 |
| (−2, 27) | ||||
| Cmax (ng ml−1)* | 141 ± 80 | 91 ± 42 | 26 ± 44% | 0.005 |
| (5, 48) | ||||
| AUC0–∞ (ng h−1 ml−1)* | 3161 ± 1730 | 1530 ± 727 | 47 ± 26% | 0.001 |
| (34, 60) | ||||
| T1/2 (h) | 25 ± 9 | 21 ± 9 | 15 ± 10% | 0.16 |
| (−5, 25) | ||||
| CL/F (l h−1)* | 103 ± 54 | 234 ± 207 | 126 ± 93% | 0.004 |
| (80, 172) |
Stands for confidence interval.
Two-tailed paired comparisons with the nonparametric Wilcoxon signed rank test.
Figure 2.
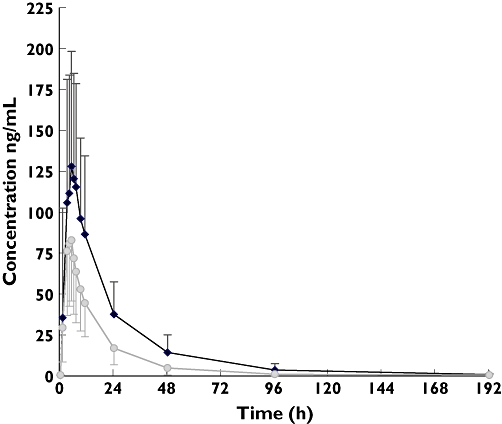
Geometric mean (± SD) plasma concentrations vs. time profiles of gefitinib following a single 250-mg oral dose with (squares) and without (diamonds) phenytoin. Error bars represented standard deviation for each time point. Gefitinib 250 mg ( ); Gefitinib 250 mg + Phenytoin 5 mg/kg/day (
 )
)
Influence of liver CYP3A4 activity, ABCB1 C3435T and CYP2D6 polymorphisms on gefitinib pharmacokinetics
The secondary aim of the current study was to characterize the interindividual variability of gefitinib systemic exposure. Baseline liver CYP3A4 activity did not correlate to the gefitinib pharmacokinetic parameters (rs= 0.004 for the respective correlation with CL/F and AUC0–∞, P= 0.8). Likewise, the systemic exposure of gefitinib was similar in CC and TT homozygous subjects (P≥ 0.43 for all tested comparisons) (Table 2). During the control phase, gefitinib CL/F was significantly lower in carriers of at least one CYP2D6*4 or CYP2D6*5 allele compared with those carrying two wild-type alleles (79 ± 68 vs. 118 ± 30 l h−1, respectively, 95% CI for the difference 17–60%, P= 0.02) (Table 3). As CYP2D6 seemed to be a significant player in gefitinib clearance, a more appropriate analysis restricted to CYP2D6 poor metabolizers (n= 7) showed that correlation between baseline liver CYP3A4 activity and gefitinib clearance during the control phase was significant (rs= 0.6, P= 0.046) when the outlier was omitted.
Table 2.
Gefitinib pharmacokinetics according to the ABCB1 C3435T genetic polymorphism
| Control phase | Interaction phase with phenytoin | |||
|---|---|---|---|---|
| Mean ± SD pharmacokinetic parameters* | CC (n= 9) | TT (n= 9) | CC (n= 9) | TT (n= 9) |
| Tmax (h)† | 5 | 5 | 5 | 5 |
| Cmax (ng ml−1) | 144 ± 85 | 137 ± 78 | 101 ± 45 | 82 ± 39 |
| AUC0–∞ (ng h−1 ml−1) | 3497 ± 2180 | 2824 ± 1161 | 1692 ± 829 | 1368 ± 615 |
| CL/F (l h−1) | 104 ± 67 | 102 ± 41 | 233 ± 255 | 235 ± 161 |
P > 0.4 for all tested comparisons with the two-tailed Mann–Whitney U-test.
Tmax were median values.
Table 3.
Apparent oral clearance (CL/F in l h−1) of gefitinib as a function of CYP2D6 genotypes
| Genotype group (n= 17)‡ Wild type (extensive metabolizers) CYP2D6 *1/*1 (n= 9) (50%) | Heterozygous (intermediate metabolizers) CYP2D6 *1/*4 (n= 5) (27.8%) CYP2D6 *1/*5 (n= 2) (11.1%) | Variant (poor metabolizers)CYP2D6 *4/*4 (n= 1) (5.6%) | P-value§ | |
|---|---|---|---|---|
| CP† | 118 ± 30 | 79 ± 68 | 54 | 0.02 |
| IP† | 235 ± 162 | 247 ± 290 | 140 | 0.4 |
CP, control phase; IP, interaction phase.
One sample did not yield PCR amplification.
Nonparametric Kruskall–Wallis test. P < 0.05 for wild-type CYP2D6 vs. heterozygous CYP2D6 genotype calculated with Dunn test adjusted for multiple comparisons.
Influence of liver CYP3A4 activity and ABCB1 C3435T genetic polymorphism on the pharmacokinetic interaction between gefitinib and phenytoin
No relationship was found between the increase in CL/F of gefitinib and liver CYP3A4 induction by phenytoin, as assessed by the ERMBT (rs= 0.15, P= 0.1, Figure 3). Likewise, the mean pharmacokinetic parameters of gefitinib were independent of ABCB1 C3435T genetic polymorphism (Figure 4). During this interaction phase, the gefitinib CL/F was no longer influenced by the CYP2D6 genetic variants (P= 0.2). The magnitude of induction of gefitinib clearance was greater in carriers of at least one CYP2D6*4 or CYP2D6*5 allele compared with those carrying two wild-type alleles (2.7 ± 0.8 vs. 2.0 ± 1.0, respectively, P= 0.046).
Figure 3.
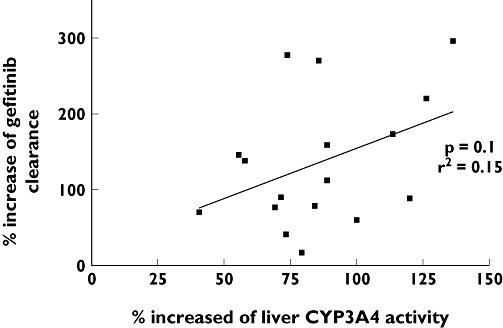
Relationship between percent increase of liver CYP3A4 activity and percent increase of gefitinib apparent oral clearance (rs= 0.15, P= 0.1). One data showing no increase apparent oral clearance gefitinib was omitted
Figure 4.
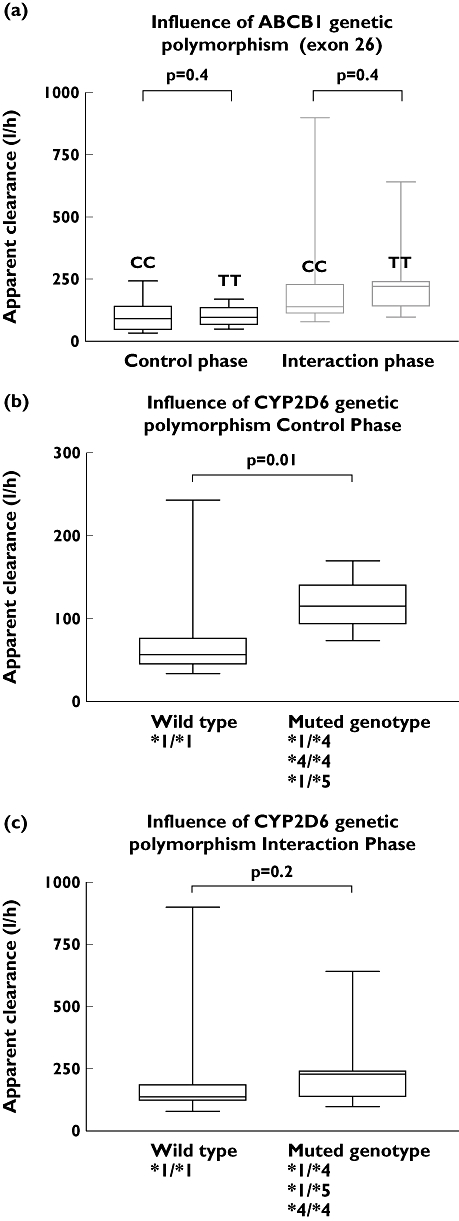
Influence of ABCB1 genetic polymorphism in exon 26 C3435T (a) and of CYP2D6 genotype (b,c) on gefitinib apparent clearance (l h−1) during control and interaction phase, respectively. Data for the muted CYP2D6 genotype were gathered from patients with one variant allele (heterozygous genotype) or two variant alleles (variant genotype)
Discussion
In the current study, we characterized the systemic exposure of the novel anticancer drug gefitinib in healthy volunteers as well as the extent and clinical significance of the interaction with phenytoin. The pharmacokinetic profile of gefitinib obtained in absence of phenytoin was consistent with previously published clinical trials conducted in healthy volunteers and in patients [5, 26, 34–36].
During phenytoin treatment, the AUC0–∞ of gefitinib was reduced by about a half, on average. The sensitivity of gefitinib to CYP induction has been shown in a previous study using rifampicin [5]. However, the effect of phenytoin in this study was much less than that of rifampicin, the latter reducing gefitinib AUC0–∞ to one-sixth of control values. Although there is evidence that the incidence of some effects of gefitinib is concentration dependent [26], no link has been established between gefitinib exposure and efficacy [5]. Furthermore, little relationship between efficacy and dose was observed over the range 150–1000 mg day−1[36]. Although it is reasonable to suppose that a decrease in the level of exposure to gefitinib has the potential to reduce its efficacy, in the absence of a definitive relationship it is difficult to put into clinical perspective the magnitude of the interaction between gefitinib and phenytoin observed in this study. Until more information becomes available, it must be concluded that the risk of reduced efficacy supports caution when using gefitinib in patients taking phenytoin.
Although the use of the ERMBT to demonstrate the induction of CYP3A4 by rifampicin has been reported [21], the effect of phenytoin on the ERMBT has not previously been described. In the current study, hepatic CYP3A4 activity, as measured by the ERMBT, was clearly doubled from baseline following phenytoin administration. Moreover, liver CYP3A4 induction appeared to have reached a maximal effect by day 5, since there was no further increase at day 7. This time course is consistent with the results of Fleishaker et al., who observed a rapid induction of CYP3A activity within 48 h after the beginning of phenytoin treatment [15]. Our study aimed to simulate therapeutically relevant effects of phenytoin. This was indicated in terms of phenytoin plasma concentrations being in the usual therapeutic range. Moreover, the dosing schedule achieved maximum induction of CYP 3A4, as judged by the similarity of the ERMBT values on days 5 and 7 of phenytoin dosing. Finally, the similarity of the baseline ERMBT values at the start of the two phases of the study indicated that normal CYP activity was restored during the wash-out period.
McKillop et al. demonstrated that gefitinib metabolism is mediated primarily by CYP3A4, whereas CYP3A5 and CYPD6 were minor contributors [37]. They concluded that the wide variability in CYP3A4 activity in human liver was probably a significant factor in the interindividual variability observed in gefitinib pharmacokinetics. Thus a positive correlation between liver CYP3A4 activity and gefitinib clearance would be expected. However, the ERMBT was not significantly associated with gefitinib clearance during either study phase, despite both gefitinib oral clearance and the ERMBT being increased by phenytoin treatment. Hirth et al. demonstrated that hepatic CYP3A4 activity was the strongest predictor of docetaxel clearance and accounted for two-thirds of the interindividual variability in clearance [19]. However, attempts to relate gefitinib clearance to measures of CYP3A4 activity have produced mixed results. Swaisland et al.[8] used a single oral dose of midazolam to examine the relationship between CYP3A activity and gefitinib clearance. Midazolam was chosen as it is recognized to reflect directly hepatic and intestinal CYP3A total activity including CYP3A4 and CYP3A5 [18, 38]. A trend towards a correlation was described between the midazolam and gefitinib AUCs, although this did not reach statistical significance [8]. In contrast, in a recent study performed in cancer patients taking 250 mg or 500 mg of gefitinib, midazolam oral clearance significantly correlated with steady-state gefitinib systemic exposure and predicted as much as 40% of its interindividual variability [26]. The involvement of intestinal CYP3A-mediated metabolism may represent an explanation for the lack of correlation between gefitinib clearance. Likewise, the extraction of gefitinib is estimated to be approximately 60% (48–68%) [39]. Therefore gefitinib clearance would become dependent on hepatic blood flow but also on the intrinsic clearance to a lesser extent. As the hepatic extraction ratio was not lower than 0.3, this could be a reason for the lack of ERMBT correlation.
Although erythromycin is a useful mechanistic probe, numerous studies have shown that a lack of ability to predict the disposition of CYP3A4 substrates is also owing to effects of erythromycin uptake and efflux transporters. As gefitinib is also a P-gp inhibitor, it is possible that gefitinib could have an effect on erythromycin efflux and compromised the ERMBT to be a predictor of gefitinib clearance [40, 41]. Frassetto et al. showed that the ERMBT increase was modest and statistically not significant with lansoprazole, suggestinf that modest P-gp inhibition may not affect ERMBT results at baseline or following phenytoin treatment in our study [40].
In another recent study, the mean clearance of docetaxel, a well-known substrate of CYP3A4, CYP3A5, P-gp (ABCB1), MRP-2 (ABCC2) and OATP1B3 (SLCO1B3), was significantly and independently correlated with sex, liver CYP3A4 activity, as measured by the ERMBT, CYP3A4*1B and CYP3A5*1A alleles, but none of the common haplotypes in SLCO1B3, ABCB1 or ABCC2, using multiple regression analysis [42]. This further supports that, especially in the case of strong induction, ERMBT results may not be confounded by these hepatocyte transporters.
The modulation of hepatic P-gp by phenytoin may have altered the current ERMBT results, as recently shown with the specific P-gp inhibitor tariquidar in humans [41]. This was indeed one of the main limitations to use of ERMBT in the current study, although our results were similar in subjects carrying the CC genotype compared with those who did not (i.e. carrying the TT genotype).
Although the total mass of CYP3A4 in the entire small intestine has been estimated to be around 1% of that in the liver, there is increasing evidence that intestinal CYP3A can contribute significantly, in some cases equally to hepatic CYP3A, to the overall first-pass metabolism of several drugs [43–46]. In addition, rifampicin has been shown to be capable of inducing intestinal CYP3A4 [47]. Some of the most documented, clinically relevant drug interactions were indeed observed with grapefruit juice. Grapefruit juice acts through inhibition of intestinal but not liver CYP3A4 [48]. Based on the current results and on the study by Li et al.[49], we hypothesize that gefitinib–phenytoin interaction may depend on induction of intestinal rather than liver CYP3A metabolism. This interpretation is supported by the small and nonsignificant change in gefitinib half-life. Further studies using selective intestinal CYP3A4 inhibition would be required to confirm this.
O-desmethyl-gefitinib (M523595) is produced by CYP2D6 and is the predominant metabolite in plasma. Although it is present at concentrations similar to those of gefitinib in human plasma, it is not thought to contribute significantly to the therapeutic activity of gefitinib in the clinical situation [50]. Swaisland et al.[8] found that following a single dose of gefitinib, systemic exposure to gefitinib in subjects carrying at least CYP2D6*4 or CYP2D6*5 alleles was nearly twice that of those carrying the wild-type alleles. Although CYP2D6 polymorphism had a statistically significant effect on the clearance of gefitinib during the control phase of the current study, the effect was not detectable during phenytoin treatment. It is likely that during CYP3A4 induction, the relative contribution of metabolism by CYP2D6 is reduced, which may explain why the influence of CYP2D6 genetic polymorphism disappeared. However, as the magnitude of induction of gefitinib clearance was greater in poor metabolizers than in extensive metabolizers, the latter seemed to be less sensitive to the interaction with phenytoin.
This clinical study was also designed to show the consequences of the most extensively studied ABCB1 variant, C3435T, on gefitinib pharmacokinetics, particularly during the absorption phase. No significant difference for gefitinib pharmacokinetics was observed between the two groups, although, with the known variability in gefitinib systemic exposure, the small sample size may have influenced this observation. Saturation of the multidrug transporter by high concentrations of gefitinib at the apical surface of the intestinal epithelial cells may explain these results. Moreover, the functional effect of the variant tested is controversial, with conflicting results throughout the literature [51]. In addition, phenytoin is a well-known P-gp inducer, in addition to CYP3A4 [52]. In this regard, it appeared relevant to determine whether the gefitinib–phenytoin interaction was the same in subjects carrying the CC genotype compared with those carrying the TT genotype.
However, although in vitro studies have previously demonstrated that gefitinib is transported by P-gp, it was with much lower affinity compared with another polymorphic efflux transporter protein, ABCG2, which is highly expressed in the intestine and liver [53]. In vitro studies using HEK293 human embryonic kidney cells transfected with wild-type and mutant ABCG2 demonstrated that gefitinib is transported by ABCG2 at clinically achievable concentrations (0.1–1.0 µm). A functional ABCG2 SNP has been identified in exon 5 (C421A) and showed a reduced transport associated with greater gefitinib plasma accumulation at steady state [54]. Furthermore, a recent study postulated that patients with reduced ABCG2 activity are at increased risk for diarrhoea, with implications for optimizing treatment with gefitinib [55]. Li et al. showed that ABCG2 (421C→A) was associated with greater accumulation of gefitinib at steady state and may be relevant to toxicity and antitumour activity [56]. As volunteers received only a 250-mg dose, our study was not designed to show this drug accumulation and we did not genotype on ABCG2 the volunteers enrolled in this study. Moreover, in our sample size we would probably have found fewer than four patients out of 18 carrying the ABCG2 421C→A, which is too low to find any statistically meaningful relationship with gefitinib–phenytoin interaction.
In addition, although it may be plausible that this efflux pump may have had greater influence than P-gp on gefitinib pharmacokinetics during the control phase, its role during the gefitinib–phenytoin interaction phase of the current study is uncertain, as phenytoin is not an inducer of ABCG2 to the best of our knowledge.
In conclusion, the significant and relevant drug–drug interaction involving phenytoin and gefitinib was not correlated to the ERMBT, but may possibly involve intestinal CYP3A4 since CL/F increased significantly whereas the half-life did not, although the latter hypothesis deserves further confirmation using selective in vivo knockout of intestinal CYP3A-mediated metabolism with furanocoumarins contained in grapefruit or Seville orange juice [57]. The assumption of an intestinal rather than liver CYP3A drug–drug interaction between gefitinib and phenytoin, rifampin, and other CYP3A modulators used in the management of cancer patients is paramount for the clinicians and further emphasizes the need for a non-invasive probe of intestinal first-pass in order to optimize drug dosage and management of drug associations in clinical practice on an individual basis. A clinical interaction study performed in patients, at steady state, using midazolam as a probe for liver and intestinal CYP3A4 and ABCG2 genotyping would be certainly warranted.
Competing interests
None to declare.
This study was supported by a Grant from Astra-Zeneca (Rueil-Malmaison, France) and from Analytico Medinet (Breda, the Netherlands). It was presented at the 17th International Congress on Anti-Cancer Treatment, February 2006 Paris, France, at the 1st Physiology, Pharmacology & Therapeutics Conference, April 2006 Montpellier, France and at the 14th United European Gastroenterology Week, October 2006, Berlin, Germany. The authors are indebted to the technicians at the Nuclear Medicine Department and the nurses of the Internal Medicine Department for their invaluable work throughout the entire study.
REFERENCES
- 1.Cohen MH, Sridhara R, Chen G, McGuinn WD, Morse D, Abraham S, Rahman A, Liang C, Lostritto R. United states Food and Drug Administration Drug approval summary: gefitinib (zd1839; Iressa) tablets. Clin Cancer Res. 2004;10:1212–8. doi: 10.1158/1078-0432.ccr-03-0564. [DOI] [PubMed] [Google Scholar]
- 2.Paine MF, Hart HL, Ludington SS, Haining RL, Rettie AE, Zeldin DC. The human intestinal cytochrome P450 ‘pie’. Drug Metab Dispos. 2006;34:880–6. doi: 10.1124/dmd.105.008672. [DOI] [PMC free article] [PubMed] [Google Scholar]
- 3.Guengerich FP. Cytochrome P450 proteins and potential utilization in biodegradation. Environ Health Perspect. 1995;103(Suppl. 5):25–8. doi: 10.1289/ehp.95103s425. [DOI] [PMC free article] [PubMed] [Google Scholar]
- 4.Wacher VJ, Wu CY, Benet LZ. Overlapping substrate specificities and tissue distribution of cytochrome P450 3A and P-glycoprotein: implications for drug delivery and activity in cancer chemotherapy. Mol Carcinog. 1995;13:129–34. doi: 10.1002/mc.2940130302. [DOI] [PubMed] [Google Scholar]
- 5.Swaisland HC, Ranson M, Smith RP, Leadbetter J, Laight A, McKillop D, Wild MJ. Pharmacokinetic drug interactions of gefitinib with rifampicin, itraconazole and metoprolol. Clin Pharmacokinet. 2005;44:1067–81. doi: 10.2165/00003088-200544100-00005. [DOI] [PubMed] [Google Scholar]
- 6.McKillop D, McCormick AD, Miles GS, Phillips PJ, Pickup KJ, Bushby N, Hutchison M. In vitro metabolism of gefitinib in human liver microsomes. Xenobiotica. 2004;34:983–1000. doi: 10.1080/02772240400015222. [DOI] [PubMed] [Google Scholar]
- 7.McKillop D, Hutchison M, Partridge EA, Bushby N, Cooper CM, Clarkson-Jones JA, Herron W, Swaisland HC. Metabolic disposition of gefitinib, an epidermal growth factor receptor tyrosine kinase inhibitor, in rat, dog and man. Xenobiotica. 2004;34:917–34. doi: 10.1080/00498250400009171. [DOI] [PubMed] [Google Scholar]
- 8.Swaisland HC, Cantarini MV, Fuhr R, Holt A. Exploring the relationship between expression of cytochrome P450 enzymes and gefitinib pharmacokinetics. Clin Pharmacokinet. 2006;45:633–44. doi: 10.2165/00003088-200645060-00006. [DOI] [PubMed] [Google Scholar]
- 9.Kitazaki T, Oka M, Nakamura Y, Tsurutani J, Doi S, Yasunaga M, Takemura M, Yabuuchi H, Soda H, Kohno S. Gefitinib, an EGFR tyrosine kinase inhibitor, directly inhibits the function of P-glycoprotein in multidrug resistant cancer cells. Lung Cancer. 2005;49:337–43. doi: 10.1016/j.lungcan.2005.03.035. [DOI] [PubMed] [Google Scholar]
- 10.Glavinas H, Krajcsi P, Cserepes J, Sarkadi B. The role of ABC transporters in drug resistance, metabolism and toxicity. Curr Drug Deliv. 2004;1:27–42. doi: 10.2174/1567201043480036. [DOI] [PubMed] [Google Scholar]
- 11.Fojo AT, Ueda K, Slamon DJ, Poplack DG, Gottesman MM, Pastan I. Expression of a multidrug-resistance gene in human tumors and tissues. Proc Natl Acad Sci USA. 1987;84:265–9. doi: 10.1073/pnas.84.1.265. [DOI] [PMC free article] [PubMed] [Google Scholar]
- 12.Fellay J, Marzolini C, Meaden ER, Back DJ, Buclin T, Chave JP, Decosterd LA, Furrer H, Opravil M, Pantaleo G, Retelska D, Ruiz L, Schinkel AH, Vernazza P, Eap CB, Telenti A. Response to antiretroviral treatment in HIV-1-infected individuals with allelic variants of the multidrug resistance transporter 1: a pharmacogenetics study. Lancet. 2002;359:30–6. doi: 10.1016/S0140-6736(02)07276-8. [DOI] [PubMed] [Google Scholar]
- 13.Gerloff T, Schaefer M, Johne A, Oselin K, Meisel C, Cascorbi I, Roots I. MDR1 genotypes do not influence the absorption of a single oral dose of 1 mg digoxin in healthy white males. Br J Clin Pharmacol. 2002;54:610–6. doi: 10.1046/j.1365-2125.2002.01691.x. [DOI] [PMC free article] [PubMed] [Google Scholar]
- 14.Blower P, de Wit R, Goodin S, Aapro M. Drug–drug interactions in oncology: why are they important and can they be minimized? Crit Rev Oncol Hematol. 2005;55:117–42. doi: 10.1016/j.critrevonc.2005.03.007. [DOI] [PubMed] [Google Scholar]
- 15.Fleishaker JC, Pearson LK, Peters GR. Phenytoin causes a rapid increase in 6 beta-hydroxycortisol urinary excretion in humans – a putative measure of CYP3A induction. J Pharm Sci. 1995;84:292–4. doi: 10.1002/jps.2600840305. [DOI] [PubMed] [Google Scholar]
- 16.Vecht CJ, Wagner GL, Wilms EB. Interactions between antiepileptic and chemotherapeutic drugs. Lancet Neurol. 2003;2:404–9. doi: 10.1016/s1474-4422(03)00435-6. [DOI] [PubMed] [Google Scholar]
- 17.Relling MV, Pui CH, Sandlund JT, Rivera GK, Hancock ML, Boyett JM, Schuetz EG, Evans WE. Adverse effect of anticonvulsants on efficacy of chemotherapy for acute lymphoblastic leukaemia. Lancet. 2000;356:285–90. doi: 10.1016/S0140-6736(00)02503-4. [DOI] [PubMed] [Google Scholar]
- 18.Watkins PB. Noninvasive tests of CYP3A enzymes. Pharmacogenetics. 1994;4:171–84. doi: 10.1097/00008571-199408000-00001. [DOI] [PubMed] [Google Scholar]
- 19.Hirth J, Watkins PB, Strawderman M, Schott A, Bruno R, Baker LH. The effect of an individual's cytochrome CYP3A4 activity on docetaxel clearance. Clin Cancer Res. 2000;6:1255–8. [PubMed] [Google Scholar]
- 20.Turgeon DK, Leichtman AB, Lown KS, Normolle DP, Deeb GM, Merion RM, Watkins PB. P450 3A activity and cyclosporine dosing in kidney and heart transplant recipients. Clin Pharmacol Ther. 1994;56:253–60. doi: 10.1038/clpt.1994.135. [DOI] [PubMed] [Google Scholar]
- 21.Polk RE, Brophy DF, Israel DS, Patron R, Sadler BM, Chittick GE, Symonds WT, Lou Y, Kristoff D, Stein DS. Pharmacokinetic interaction between amprenavir and rifabutin or rifampin in healthy males. Antimicrob Agents Chemother. 2001;45:502–8. doi: 10.1128/AAC.45.2.502-508.2001. [DOI] [PMC free article] [PubMed] [Google Scholar]
- 22.Cheng CL, Smith DE, Carver PL, Cox SR, Watkins PB, Blake DS, Kauffman CA, Meyer KM, Amidon GL, Stetson PL. Steady-state pharmacokinetics of delavirdine in HIV-positive patients: effect on erythromycin breath test. Clin Pharmacol Ther. 1997;61:531–43. doi: 10.1016/S0009-9236(97)90133-8. [DOI] [PubMed] [Google Scholar]
- 23.Mouly S, Lown KS, Kornhauser D, Joseph JL, Fiske WD, Benedek IH, Watkins PB. Hepatic but not intestinal CYP3A4 displays dose-dependent induction by efavirenz in humans. Clin Pharmacol Ther. 2002;72:1–9. doi: 10.1067/mcp.2002.124519. [DOI] [PubMed] [Google Scholar]
- 24.Mouly S, Rizzo-Padoin N, Simoneau G, Verstuyft C, Aymard G, Salvat C, Mahe I, Bergmann JF. Effect of widely used combinations of antiretroviral therapy on liver CYP3A4 activity in HIV-infected patients. Br J Clin Pharmacol. 2006;62:200–9. doi: 10.1111/j.1365-2125.2006.02637.x. [DOI] [PMC free article] [PubMed] [Google Scholar]
- 25.Rothenberg ML, LaFleur B, Levy DE, Washington MK, Morgan-Meadows SL, Ramanathan RK, Berlin JD, Benson AB, III, Coffey RJ. Randomized phase II trial of the clinical and biological effects of two dose levels of gefitinib in patients with recurrent colorectal adenocarcinoma. J Clin Oncol. 2005;23:9265–74. doi: 10.1200/JCO.2005.03.0536. [DOI] [PubMed] [Google Scholar]
- 26.Li J, Karlsson MO, Brahmer J, Spitz A, Zhao M, Hidalgo M, Baker SD. CYP3A phenotyping approach to predict systemic exposure to EGFR tyrosine kinase inhibitors. J Natl Cancer Inst. 2006;98:1714–23. doi: 10.1093/jnci/djj466. [DOI] [PubMed] [Google Scholar]
- 27.Hoffmeyer S, Burk O, Von Richter O, Arnold HP, Brockmoller J, Johne A, Cascorbi I, Gerloff T, Roots I, Eichelbaum M, Brinkmann U. Functional polymorphisms of the human multidrug-resistance gene: multiple sequence variations and correlation of one allele with P-glycoprotein expression and activity in vivo. Proc Natl Acad Sci USA. 2000;97:3473–8. doi: 10.1073/pnas.050585397. [DOI] [PMC free article] [PubMed] [Google Scholar]
- 28.Wagner D. CYP3A4 and the erythromycin breath test. Clin Pharmacol Ther. 1998;64:129–30. doi: 10.1016/S0009-9236(98)90031-5. [DOI] [PubMed] [Google Scholar]
- 29.Jones HK, Stafford LE, Swaisland HC, Payne R. A sensitive assay for ZD1839 (Iressa) in human plasma by liquid-liquid extraction and high performance liquid chromatography with mass spectrometric detection: validation and use in Phase I clinical trials. J Pharm Biomed Anal. 2002;29:221–8. doi: 10.1016/s0731-7085(02)00014-6. [DOI] [PubMed] [Google Scholar]
- 30.Anglicheau D, Verstuyft C, Laurent-Puig P, Becquemont L, Schlageter MH, Cassinat B, Beaune P, Legendre C, Thervet E. Association of the multidrug resistance-1 gene single-nucleotide polymorphisms with the tacrolimus dose requirements in renal transplant recipients. J Am Soc Nephrol. 2003;14:1889–96. doi: 10.1097/01.asn.0000073901.94759.36. [DOI] [PubMed] [Google Scholar]
- 31.Johansson I, Lundqvist E, Dahl ML, Ingelman-Sundberg M. PCR-based genotyping for duplicated and deleted CYP2D6 genes. Pharmacogenetics. 1996;6:351–5. doi: 10.1097/00008571-199608000-00008. [DOI] [PubMed] [Google Scholar]
- 32.Sachse C, Brockmoller J, Bauer S, Roots I. Cytochrome P450 2D6 variants in a Caucasian population: allele frequencies and phenotypic consequences. Am J Hum Genet. 1997;60:284–95. [PMC free article] [PubMed] [Google Scholar]
- 33.Datta P, Scurlock D, Dasgupta A. Analytic performance evaluation of a new turbidimetric immunoassay for phenytoin on the ADVIA 1650 analyzer: effect of phenytoin metabolite and analogue. Ther Drug Monit. 2005;27:305–8. doi: 10.1097/01.ftd.0000164315.13825.dd. [DOI] [PubMed] [Google Scholar]
- 34.Swaisland HC, Smith RP, Laight A, Kerr DJ, Ranson M, Wilder-Smith CH, Duvauchelle T. Single-dose clinical pharmacokinetic studies of gefitinib. Clin Pharmacokinet. 2005;44:1165–77. doi: 10.2165/00003088-200544110-00004. [DOI] [PubMed] [Google Scholar]
- 35.Hammond LA. Pharmacokinetic evaluation of gefitinib when administered with chemotherapy. Clin Lung Cancer. 2003;5(Suppl. 1):S18–21. doi: 10.3816/clc.2003.s.011. [DOI] [PubMed] [Google Scholar]
- 36.Wolf M, Swaisland H, Averbuch S. Development of the novel biologically targeted anticancer agent gefitinib: determining the optimum dose for clinical efficacy. Clin Cancer Res. 2004;10:4607–13. doi: 10.1158/1078-0432.CCR-04-0058. [DOI] [PubMed] [Google Scholar]
- 37.McKillop D, McCormick AD, Millar A, Miles GS, Phillips PJ, Hutchison M. Cytochrome P450-dependent metabolism of gefitinib. Xenobiotica. 2005;35:39–50. doi: 10.1080/00498250400026464. [DOI] [PubMed] [Google Scholar]
- 38.Thummel KE, Shen DD, Podoll TD, Kunze KL, Trager WF, Bacchi CE, Marsh CL, McVicar JP, Barr DM, Perkins JD. Use of midazolam as a human cytochrome P450 3A probe: II. Characterization of inter- and intraindividual hepatic CYP3A variability after liver transplantation. J Pharmacol Exp Ther. 1994;271:557–66. [PubMed] [Google Scholar]
- 39.Ranson M, Wardell S. Gefitinib, a novel, orally administered agent for the treatment of cancer. J Clin Pharm Ther. 2004;29:95–103. doi: 10.1111/j.1365-2710.2004.00543.x. [DOI] [PubMed] [Google Scholar]
- 40.Frassetto LA, Poon S, Tsourounis C, Valera C, Benet LZ. Effects of uptake and efflux transporter inhibition on erythromycin breath test results. Clin Pharmacol Ther. 2007;81:828–32. doi: 10.1038/sj.clpt.6100148. [DOI] [PubMed] [Google Scholar]
- 41.Kurnik D, Wood AJ, Wilkinson GR. The erythromycin breath test reflects P-glycoprotein function independently of cytochrome P450 3A activity. Clin Pharmacol Ther. 2006;80:228–34. doi: 10.1016/j.clpt.2006.06.002. [DOI] [PubMed] [Google Scholar]
- 42.Baker SD, Verweij J, Cusatis GA, van Schaik RH, Marsh S, Orwick SJ, Franke RM, Hu S, Schuetz EG, Lamba V, Messersmith WA, Wolff AC, Carducci MA, Sparreboom A. Pharmacogenetic pathway analysis of docetaxel elimination. Clin Pharmacol Ther. 2009;85:155–63. doi: 10.1038/clpt.2008.95. [DOI] [PMC free article] [PubMed] [Google Scholar]
- 43.Bailey DG, Kreeft JH, Munoz C, Freeman DJ, Bend JR. Grapefruit juice–felodipine interaction: effect of naringin and 6′,7′-dihydroxybergamottin in humans. Clin Pharmacol Ther. 1998;64:248–56. doi: 10.1016/S0009-9236(98)90173-4. [DOI] [PubMed] [Google Scholar]
- 44.Von Richter O, Greiner B, Fromm MF, Fraser R, Omari T, Barclay ML, Dent J, Somogyi AA, Eichelbaum M. Determination of in vivo absorption, metabolism, and transport of drugs by the human intestinal wall and liver with a novel perfusion technique. Clin Pharmacol Ther. 2001;70:217–27. doi: 10.1067/mcp.2001.117937. [DOI] [PubMed] [Google Scholar]
- 45.Kupferschmidt HH, Ha HR, Ziegler WH, Meier PJ, Krahenbuhl S. Interaction between grapefruit juice and midazolam in humans. Clin Pharmacol Ther. 1995;58:20–8. doi: 10.1016/0009-9236(95)90068-3. [DOI] [PubMed] [Google Scholar]
- 46.Fuhr U, Maier-Bruggemann A, Blume H, Muck W, Unger S, Kuhlmann J, Huschka C, Zaigler M, Rietbrock S, Staib AH. Grapefruit juice increases oral nimodipine bioavailability. Int J Clin Pharmacol Ther. 1998;36:126–32. [PubMed] [Google Scholar]
- 47.Greiner B, Eichelbaum M, Fritz P, Kreichgauer HP, Von Richter O, Zundler J, Kroemer HK. The role of intestinal P-glycoprotein in the interaction of digoxin and rifampin. J Clin Invest. 1999;104:147–53. doi: 10.1172/JCI6663. [DOI] [PMC free article] [PubMed] [Google Scholar]
- 48.Guo LQ, Fukuda K, Ohta T, Yamazoe Y. Role of furanocoumarin derivatives on grapefruit juice-mediated inhibition of human CYP3A activity. Drug Metab Dispos. 2000;28:766–71. [PubMed] [Google Scholar]
- 49.Li J, Brahmer J, Messersmith W, Hidalgo M, Baker SD. Binding of gefitinib, an inhibitor of epidermal growth factor receptor-tyrosine kinase, to plasma proteins and blood cells: in vitro and in cancer patients. Invest New Drugs. 2006;24:291–7. doi: 10.1007/s10637-006-5269-2. [DOI] [PubMed] [Google Scholar]
- 50.McKillop D, Guy SP, Spence MP, Kendrew J, Kemp JV, Bushby N, Wood PG, Barnett S, Hutchison M. Minimal contribution of desmethyl-gefitinib, the major human plasma metabolite of gefitinib, to epidermal growth factor receptor (EGFR)-mediated tumour growth inhibition. Xenobiotica. 2006;36:29–39. doi: 10.1080/00498250500523253. [DOI] [PubMed] [Google Scholar]
- 51.Leschziner GD, Andrew T, Pirmohamed M, Johnson MR. ABCB1 genotype and PGP expression, function and therapeutic drug response: a critical review and recommendations for future research. Pharmacogenomics J. 2007;7:154–79. doi: 10.1038/sj.tpj.6500413. [DOI] [PubMed] [Google Scholar]
- 52.Lombardo L, Pellitteri R, Balazy M, Cardile V. Induction of nuclear receptors and drug resistance in the brain microvascular endothelial cells treated with antiepileptic drugs. Curr Neurovasc Res. 2008;5:82–92. doi: 10.2174/156720208784310196. [DOI] [PubMed] [Google Scholar]
- 53.Ozvegy-Laczka C, Hagedus T, Varady G, Uljhelly O, Schuetz JD, Varadi A, Keri G, Orfi L, Nemet K, Sarkadi B. High-affinity interaction of tyrosine kinase inhibitors with the ABCG2 multidrug transporter. Mol Pharmacol. 2004;65:1485–95. doi: 10.1124/mol.65.6.1485. [DOI] [PubMed] [Google Scholar]
- 54.Li J, Sparreboom A, Zhao M, Robey RW, Bates SE, Baker SD. Gefitinib and erlotinib epidermal growth factor receptor (EGFR) tyrosine kinase inhibitors, are substrates for the breast cancer resistance protein (BCRP)/ABCG2 transporter. Clin Cancer Res. 2005;11S:120. Abstract A251. [Google Scholar]
- 55.Cusatis G, Gregorc V, Li J, Spreafico A, Ingersoll RG, Verweij J, Ludovini V, Villa E, Hidalgo M, Sparreboom A, Baker SD. Pharmacogenetics of ABCG2 and adverse reactions to gefitinib. J Natl Cancer Inst. 2006;98:1739–42. doi: 10.1093/jnci/djj469. [DOI] [PubMed] [Google Scholar]
- 56.Li J, Cusatis G, Brahmer J, Sparreboom A, Robey RW, Bates SE, Hidalgo M, Baker SD. Association of variant ABCG2 and the pharmacokinetics of epidermal growth factor receptor tyrosine kinase inhibitors in cancer patients. Cancer Biol Ther. 2007;6:432–8. doi: 10.4161/cbt.6.3.3763. [DOI] [PubMed] [Google Scholar]
- 57.Malhotra S, Bailey DG, Paine MF, Watkins PB. Seville orange juice–felodipine interaction: comparison with dilute grapefruit juice and involvement of furocoumarins. Clin Pharmacol Ther. 2001;69:14–23. doi: 10.1067/mcp.2001.113185. [DOI] [PubMed] [Google Scholar]