Abstract
Utilization of single-walled carbon nanotubes (SWNTs) in high-end applications hinges on separating metallic (met-) from semiconducting (sem-) SWNTs. Surfactant amines, like octadecylamine (ODA) have proven instrumental for the selective extraction of sem-SWNTs from tetrahydrofuran (THF) nanotube suspensions. The chemical shift differences along the tail of an asymmetric, diacetylenic surfactant amine were used to probe the molecular dynamics in the presence and absence of nanotubes via NMR. The results suggest that the surfactant amine head is firmly immobilized onto the nanotube surface together with acidic water, while the aliphatic tail progressively gains larger mobility as it gets farther from the SWNT. X-ray and high-resolution TEM studies indicate that the sem-enriched sample is populated mainly by small nanotube bundles containing ca. three SWNTs. Molecular simulations in conjunction with previously determined HNO3/H2SO4 oxidation depths for met- and sem-SWNTs indicate that the strong pinning of the amine surfactants on the sem-enriched SWNTs bundles is a result of a well-ordered arrangement of nitrate/amine salts separated with a monomolecular layer of H2O. Such continuous 2D arrangement of nitrate/amine salts shields the local environment adjacent to sem-enriched SWNTs bundles and maintains an acidic pH that preserves nanotube oxidation (i.e. SWNTn+). This, in turn, results in strong interactions with charge-balancing NO3- counter ions that through their association with neutralized surfactant amines provide effective THF dispersion and consequent sem-enrichment.
Introduction
Single-walled carbon nanotubes (SWNTs) have drawn considerable attention from the scientific community based on their unique 1D electronic, optical and mechanical properties.1 Their electronic structure depends strongly on the respective (n,m) indices, which exhibit metallic (met-) or semiconducting (sem-) behavior depending on whether or not the n-m reminder is an integer multiple of 3. A number of methodologies have come forward in order to separate sem- from met- SWNTs, among which the surfactant amine,2 dielectrophoresis,3 DNA-based ion exchange chromatography,4, 5 and density-gradient centrifugation6 routes present the most characterized embodiments.
In the case of amine-surfactant dispersion, the strong and localized ionic interactions between surfactant amines and carboxylic acids (located on the tips and side-walls of SWNTs) have been argued to assist nanotube dispersion in non-polar aprotic media, such as THF (scheme 1A).7, 8 It is now well-accepted that acid-induced treatment of SWNTs results in ca. 4-8 wt. % of carboxylic functionalities.9 However, a number of reports have raised strong indications that ionic complexes of carboxylic acid/surfactant amine base might not be the only contributor to the interactions of surfactant amines with SWNTs.2, 10, 11 Our group proposed that the preferential interactions of octadecylamine (ODA) with sem-SWNTs is assisted by the cooperative effect between ionic (acid-base) and physisorbed surfactant anchoring, where the presence of the former stimulates the organization of the latter, as shown in Scheme 1B.2 On a similar note, when oxidized SWNT are exposed to gaseous alkyl amines, the amount of amines incorporated is about an order of magnitude higher than that of the covalently bonded (amide) content in oxidized SWNTs.10 More recently, the group led by Bao reported that self-assembled amine monolayers can preferentially attract sem-SWNTs and produce thin film transistors with large on/off ratios, consistent with semiconducting enriched samples.11 Clearly, amine physisorption on the sidewall of SWNTs must be taken into account in order to explain the preferential enrichment of sem-SWNTs.
Scheme 1.
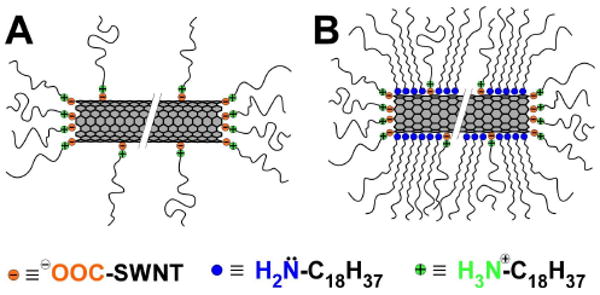
Previously-proposed octadecylamine interactions with SWNTs: (A) zwitterions and (B) physisorbed amines along with zwitterions
However, the physisorbed surfactant anchoring model lacks to account the driving force for overcoming the entropic barrier for surfactant amine organization. Clearly, the higher reactivity of met- over sem-SWNTs against oxidative treatment creates more carboxylic groups onto the sidewalls of met- as opposed to sem-SWNTs.12 One potential explanation might be that higher concentration of carboxy functionalities onto met-SWNTs could disturb the organization of the surfactant-amine. Such model, however, can not address the specific diameter selective pattern of this enrichment.13 More recently, a study from our group indicates that this enrichment appears to be intimately linked to the different level of oxidation that sem- and met-SWNTs experience when exposed to mixtures of HNO3 and H2SO4 acid.14 This explains the diameter dependence for this enrichment, as well as it links the electrochemical behavior of H2O and O2 at the vicinity of nanotubes to this enrichment process.
Nuclear magnetic resonance (NMR) has been instrumental in shedding more light to the local structure and dynamics of various molecules in confined architectures.15, 16 To this date, solution NMR behavior results involving carbon nanotube have shown that organic molecules attached on its sidewall experience: i) significant line broadening17-19 ii) signal attenuation in close proximity to SWNTs,18, 19 and iii) upfield shifts for the nearby NMR-active nuclei attached to SWNTs.17, 20 In particular, using solid state 13C NMR spectroscopy, Min Xu et al.,21 reported the disappearance of the α, β and γ-methylene groups adjacent to the amine group of ODA, when reacted with the thionyl chloride-activated carboxylic functionalities of multi-wall carbon nanotubes to form amide linkages.
In this contribution, nuclear magnetic resonance (NMR), differential scanning calorimetry (DSC), X-ray diffraction (XRD) and high-resolution transmission electron microscopy (HRTEM) characterization was employed to investigate in greater depth the local structure of nanotube/surfactant complex and its intramolecular dynamics in the presence and absence of H2O. For this, the 5, 7-eicosadiynoic amine (57ECA) surfactant was synthesized, in order to create chemical shift differences along the long fatty chain of the surfactant. 1H and 13C NMR studies suggested that the amine head is strongly immobilized onto the graphene sidewalls of SWNTs, along with the presence of acidic water. Upon closer inspection using XRD and HRTEM, the sem-enriched sample appears to be populated by small nanotube bundles containing three SWNTs. Molecular simulations in accordance with previously determined oxidation depths for met- and sem-SWNTs indicate that the strong immobilization of the amine surfactants on the side walls of these bundles is a result of a well-ordered arrangement of nitrate/amine salts separated with a monomolecular layer of H2O. Such continuous 2D arrangement of nitrate/amine salts shields the local environment adjacent to sem-enriched SWNTs bundles and maintains an acidic pH. This, in turn, preserves nanotube oxidation (i.e. SWNTn+) and results in strong interactions with charge-balancing NO3- counter ions that through their association with neutralized surfactant amines provide effective THF dispersion. Such continuous 2D arrangement of hydrated nitrate/amine salts can be attained only from a specific type and diameter nanotubes in accordance with previously observed experimental results.13, 14 This explains the profound stability of the physisorbed amines (in their salt form) on the nanotube bundle, which provides a non-covalent, “hairy-rod” nature to a very rigid structure and renders it dispersible in THF. These finding provides the missing link on the interaction of surfactant amines with sem-SWNTs and shed more light on the localized electrochemistry of nanostructured materials.
Experimental
Materials and Instrumentation
Single-walled carbon nanotubes prepared by the HiPco process22 were purchased from Carbon Nanotechnology Inc. (lot # CN1003). 5, 7-Eicosadiynoic acid (1) was purchased from GFS chemicals. 99.8 atom % deuterated D2O was purchased from Acros. Both deuterated tetrahydrofuran (99.5 atom % deuterated, THF-d8) and tetramethylsilane (TMS, 99.9%) were obtained from Sigma Aldrich. All remaining solvents and chemicals were reagent grade and used as received. All Raman spectra were collected with a Renishaw Raman scope in the backscattering configuration. SWNTs resonance Raman spectroscopy was conducted in Stokes mode using 514.5 nm (2.41 eV) excitation lasers source. Prior to the collection of Raman spectra, all drop-cast samples were vacuum-dried (less than 1 Torr) at 300 °C to sublime all residual 57ECA molecules that contribute substantial background luminescence,23 and further eliminates any possible interferences from the surfactant to the electronic structure of SWNTs. Nanotube diameter and wavenumber were correlated using ωRBM = α/dt +β, where α and β are 223.5 cm-1 nm and 12.5 cm-1, respectively.24 Differential scanning calorimetry (DSC) was performed on a DSC 2920 (TA instruments) at a ramping rate of 5 °C/ min, using a liquid DSC pan. X-ray diffraction was collected using Bruker D8 Avance using CuKα source (1.54 Å). Gas chromatography – mass spectrometry (GC-MS) was conducted using a Hewlett Packard # 5890 & 6890 series equipped with a custom-made injection head to confirm the purity of various chemicals. Transmission electron microscopy (TEM) characterization was performed using a JEOL JEM-2010 electron microscope, operating at 200 kV.
Synthesis: 5, 7-Eisosadiynoic acid chloride (2) and 5,7-eisosadiynoic amide (3)
A catalytic amount of N,N-dimethylformamide (DMF) was added dropwise into a mixture of 2.5 g (20 mmol) of oxalyl chloride, 2.0 g (3.3 mmol) of 5,7-eicosadiynoic acid (1) in 20 ml of anhydrous methylene chloride (MC). The solution was stirred at room temperature for 2 hr. The organic solvent was then rotary-evaporated to give a white viscous fluid containing compound 2. This was used in the next step without further purification (yield: 2.12 g, 99%).
2.12 g of compound 2 in 10 ml of anhydrous THF was added for 15 min dropwise to 100 ml of the ammonium hydroxide solution (28 wt. % aqueous solution) at 0 °C under vigorous stirring. The resulting white solid was filtered and washed several times with distilled water. The resulting solid was put into a timble together with magnesium sulfate and was extracted from 400 ml of diethyl ether using a Soxhlet apparatus. After extracting for 1 day, the extract was placed into a refrigerator and allowed to precipitate white flaky crystals of compound 3. The filtered solid produce ca. 1.88 g (yield : 95%) of compound 3: mp 116-118 °C, (From DSC, 120 °C), 1H NMR (CDCl3 with TMS as a internal reference) δ 0.88 (t, J = 7.0 Hz, 3H, -CH3), 1.26 (br m, 6H, -CH2-), 1.37 (br m, 2 H, -CH2-), 1.52 (q, J = 7.65 Hz, 2 H, -CH2-), 1.88 (q, J =7.0 Hz, 2 H, -CH2-), 2.25 (t, J = 7 Hz, 2H, triplet), 2.37 (t, J = 6.63 Hz, 2H, -CH2-C≡), 2.41 (t, J = 7.4 Hz, 2 H, -CH2-C≡), 5.90 (br s, 2H, -NH2); 13C NMR (CDCl3 with TMS as a internal reference) δ 14.12, 18.62, 19.22, 22.72, 23.79, 28.33, 28,89, 29.13, 29.37, 29.51, 29.65, 31.94, 34.13, 65.04, 66.36, 76.03, 76.52, 174.35; IR (neat film on KBr pellet) ν (cm-1) 3371, 2955, 2918, 2848, 1649, 1458, 1426, 722, 685; GC-MS Calcd. for C20H33NO m/z 303.26, 304.26, 305.26, Obtained 303.3, 304.2, 305.2; Elemental Analysis: Anal. Calcd. For C20H33NO (F.W.: 303.48): C, 79.15; H, 10.96; N, 4.62; O, 5.27. Found: C, 79.36; H, 11.31; N, 4.59, O, 5.53.
5, 7-Eicosadiynoylamine (57ECA)
0.748 g (26 mmol) of lithium aluminum hydride was slowly added to a solution of 1.5 g (4.9 mmol) of 3 in 100 ml of diethyl ether and the reaction was refluxed overnight. The reaction was terminated by quenching the excess hydride with careful addition of distill water until no further gas evolution was observed, while the flask was kept cold into an ice bath. The organic solvents were rotary-evaporated to produce a viscous yellow liquid. A thin layer chromatography (TLC) with a 1:1 mixture of MC: methanol yields a Rf value of the target compound of approximately 0.11, which could be visualized by the brown color using ninhydrin test.25 Purified 57ECA was obtained the subsequent silica gel column chromatography with the similar elusion composition as the case of TLC developer. Following rotary evaporation of the organic solvents, 1.0 g of a yellowish-white liquid was obtained with a yield of 70%. In order to obtain water-free 57ECA, the aforementioned liquid was micro-distilled at reduced pressure (0.1 mmHg) to produce neat (water-free) 57ECA that crystallized at low temperature. (m.p.: 18 °C). 1H NMR (THF-d8 with TMS as a internal reference) δ 0.89 (t, J = 6.89 Hz, 3H, -CH3), 1.26 (br m, 18H, -CH2-), 1.37 (br m, J = 6.9 Hz, 2H, -CH2-), 1.47 (q, 2H, -CH2-), 1.49 (q, J = 6.9 Hz, 2H, -CH2-), 1.51 (q, J = 5.5 Hz, 2H, -CH2-), 2.225 (t, J = 6.6 Hz, 2H, -CH2-C≡), 2.238 (t, J = 6.4 Hz, 2H, -CH2-C≡), 2.61(t, J = 7.4 Hz, 2H, -CH2-NH2); 13C NMR (THF-d8 with TMS as a internal reference) δ 14.44, 19.52, 19.58, 23.57, 26.80, 29.43, 29.77, 30.09, 30.32, 30.49, 30.59, 30.62, 32.88, 33.99, 42.56, 66.41, 75.76, 77.43, 77.56; IR (neat film on KBr pellet) ν (cm-1) 3378, 3259, 2925, 2854, 1663, 1623, 1576, 1464, 1335, 1080, 722; GC-MS Calcd. for C20H35N m/z 289.28, 290.28, Obtained 289.3, 290.3.; Elemental Analysis: Anal. Calcd. for C20H35N (F.W.: 289.50): C, 82.98; H, 12.19; N, 4.84. Found: C, 82.98; H, 12.36; N, 4.7.
Preparation of solid 57ECA sample
57ECA solution in n-hexane was subject to flow onto a humidified slide glass. Multiple times of this process leave a white solid film onto the slide glass, which was collected by razor blade and vacuum-dried at room temperature to produce a solid 57ECA.
Acid treatment of SWNTs (a-SWNTs)
HiPco SWNTs were treated by sonication-assisted oxidation in a mixture of H2SO4 (96%) and HNO3 (98%) according to the established methods.2, 8, 26 100 mg of SWNT were introduced into 40 ml of a 3:1 vol. mixture of H2SO4 and HNO3. The resulting black solution was mildly sonicated for 4 hr to allow SWNT to be shortened and functionalized with carboxylic groups. Following this, the nanotube suspension was filtered with 0.45 μm Teflon filter and washed with copious amount of distilled water until the pH of the filtrate has reached a value of 6. The resulting SWNT mat was peeled and vacuum dried at 60 °C for 1 day to give acid-treated SWNTs.
Functionalization of a-SWNT with 57ECA (57ECA-SWNT) and Dispersion of 57ECA-SWNT in THF
The functionalization process involves mixing 5 mg of acid-treated SWNTs with 100 mg of 57ECA into an amber-colored vial under argon and maintained for 5 days while heating at 95 °C. The mixture was allowed to cool down at room temperature and was briefly sonicated in ethanol and the solid was collected by filtration and dried in vacuum (wash step to remove free 57ECA). The dried black solid was then placed in 20 mL of THF, bath-sonicated (80 W intensity) for 1 hr and the dispersion was allowed to stand at room temperature for one day, in order to settle any precipitates. The supernatant was carefully collected and used in this study, while a substantial amount (i.e. 80 to 85%) of the aforementioned solid remained non-suspended. ODA was similarly functionalized with a-SWNTs, according to the aforementioned methods.
Preparation of HCl-acidified D2O
Partially deuterated HCl-acidified D2O was prepared according to the literature.27 38% aqueous HCl solution was dropwise added into first H2SO4 (98%), in which the generated HCl gas was again introduced into second H2SO4 (98%) vessel, to remove any remaining water. The passed HCl gas was trapped into D2O solution for 30 min. This HCl-acidified D2O solution was diluted with D2O to prepare different pH solutions (i.e., pH 2, 3, 4, and 5).
NMR Spectroscopy
NMR spectra were acquired on a Bruker DMX spectrometer operating at a proton Larmor frequency of 400 MHz. THF-d8 was dried over molecular sieve (4 Å) for one day, prior to NMR measurement. All spectra were recorded with 5 mm NMR tube containing 4.9 mM of tetramethylsilane (TMS) in 0.6 mL of THF-d8 at 25 °C, unless otherwise mentioned. In the case of NMR sample, around 1.55 mg of 57ECA-SWNTs was introduced into a vial containing 1 ml of THF-d8 and the heterogeneous solution was dispersed using bath-sonicator and was allowed to settle any precipitates while this solution was being dried over 4 Å molecular sieves. The supernatant was carefully collected and was introduced into a NMR tube. In order to prevent H2O absorption, two sealed NMR tubes including neat 57ECA at 8.6 and 69 mM in THF-d8 were prepared for 1H-1H correlation spectroscopy (2D COSY) and 1H-13C heteronuclear multiple bond correlation (HMBC) experiment, respectively. For temperature-controlled measurements, all samples were kept at each temperature for at least 20 min prior to spectra collection to allow thermal and convectional equilibration. Chemical shift (δ) and line-width monitoring experiment in the presence of D2O were conducted using NMR tube with a rubber septum, where D2O was carefully introduced in a 0.5 μl portions. Spin-lattice relaxation measurements were obtained by inversion recovery. The resulting relaxation curves were constructed from the randomized twelve time entries (i.e., 60, 2, 0.1, 0.5, 5, 30, 0.3, 15, 8, 0.8, 1, 1.5 sec).
Molecular Modeling
Cerius2 simulation software was utilized for molecular modeling using the Dreiding 2.21 force field for molecular mechanics, molecular dynamics and quenched dynamics simulations, as detailed elsewhere.28 Materials Studio 4 software was used for visualization. A hydrated NO3- geometry with sp3 configuration was reconstructed according to the literature.29
Results
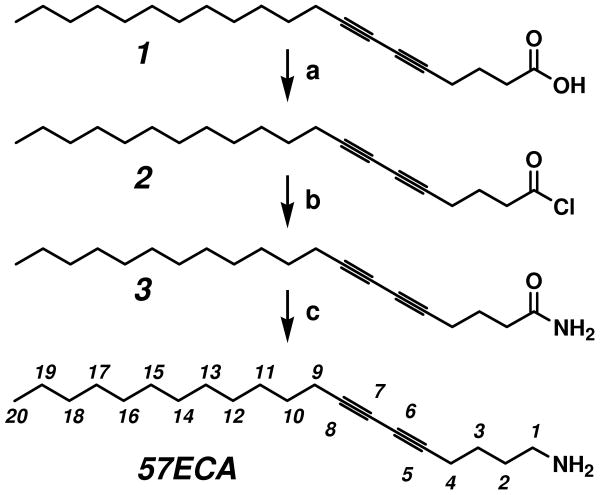
Octadecylamine (ODA) has been instrumental for attaining sem- to met-SWNT enrichement.2, 13 The similar chemical shifts for 1H and 13C NMR atoms located in the middle section of ODA, however, limits us from exploring its intramolecular dynamics within its neat- as well as nanotube-functionalized states. After a number of trial and errors we have arrived to the 5, 7-eicosadiynoylamine (57ECA) (see Scheme 2), imparting the adequate chemical anisotropy due to the asymmetric insertion of the diacetylenic moiety in 5th carbon of a 20 carbon-long chain. The additional two carbon atoms, compared to the 18 carbon of the ODA, were needed to raise its melting point comparable to ODA. This compound was synthesized via a facile three step reaction, in accordance to a previously reported protocol.30 The starting 5, 7-eicosadiynoic acid (1) was reacted with oxalyl chloride to yield 5, 7-eicosadiynoic acid chloride (2). This acid chloride (2) was further reacted with ammonium hydroxide, to generate compound 3 in an almost quantitative yield. This amide compound 3 was carefully reduced to 57ECA by using LiAlH4. Here it is important to mention that all diacetylenic compounds were handled and stored under a yellow light to prevent possible polymerization.31
Scheme 2.
Synthetic route of 57ECA¥
¥ Conditions: (a) (COCl)2/DMF/CH2Cl2, r.t., 2h; (b) NH4OH/water, 0°C; (c) LiAlH4/diethyl ether, reflux, overnight.
HiPco SWNTs were oxidized with a 1:3 v/v mixture of HNO3 and H2SO4 via 4 hr sonication. This step has been shown to: i) shorten32, ii) oxidize (p-dope) SWNTs8, and iii) add COOH functionality10 onto SWNTs. The nanotube solution was filtered, and the filtrated nanotubes were washed several times with water until the filtrate reaches a pH ca. 6. Spectroscopic evidences indicate that these nanotubes retain their p-doped state, which is locked within small bundles.14 The oxidized nanotube was vacuum-dried at 60 °C to remove the majority of water, yet some H2O is inevitably retained. Subsequently, the nanotube were mixed with 57ECA and annealed under argon at 95 °C for 5 days. This prompted nanotube exfoliation that produces a heavily dark, homogeneous suspension. Since 57ECA, like ODA, is partially soluble in ethanol, excess of 57ECA was removed by a brief sonication step in ethanol, followed by nanotube filtration and vacuum-drying at 60 °C. Subsequently, the 57ECA-treated nanotube sample was dispersed in THF via 1 hr sonication and the solution was kept for 1 day before carefully-decanting the supernatant that contains sem-enriched SWNTs.
Spectroscopic Characterization
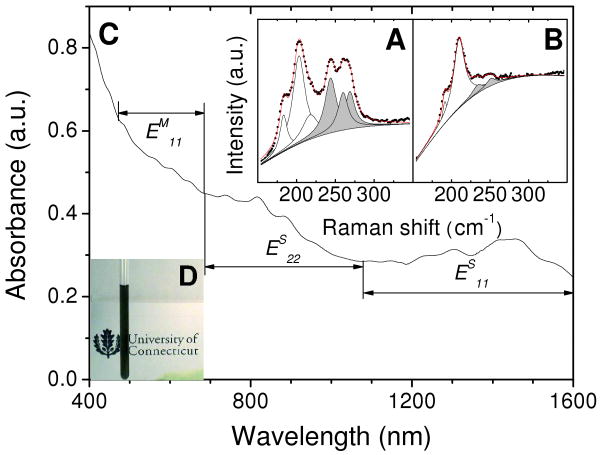
Figures 1A&B illustrate the radial breathing mode (RBM) of 514 nm excited SWNTs before (A) and after (B) 57ECA treatment. This excitation enables us to probe the ES44 of large diameter (dt) semiconducting (dt ranging from 1.15 – 1.3 nm) and EM11 of small dt metallic (dt ranging from 0.9 – 1.15 nm) transitions of HiPco SWNTs.24 Here it is important to mention that: i) the spectrum of Fig. 1A originates from the acid-treated nanotube sample, and ii) both samples were vacuum-annealed at 300 °C to remove any remaining absorbates, like acids, H2O and 57ECA. While the acid-treated sample contains both metallic and semiconducting species, 57ECA-treated sample shows enrichment mainly from the semiconducting portion. These results are in accordance with ODA-induced separation, indicating that 57ECA behaves similar to ODA.2
Figure 1.
(A&B) Resonance Raman spectra of the radial breathing mode (RBM) region of acid-treated SWNTs before (A) and after (B) 57ECA-assisted enrichment. Prior to spectral collection using 514 nm laser excitation, both samples were vacuum-annealed at 300 °C to remove all absorbates including 57ECA. Black circles and red lines denoted the experimental and summated data following peak deconvolution using Lorentzian line shapes. White and grey peaks indicate sem- and met- SWNT constituents, respectively. (C) UV-Vis-NIR spectrum of 57ECA enriched nanotubes dispersed in THF. (D) Optical image of an NMR tube containing a stable, 57ECA-dispersed, nanotube suspension in THF-d8.
Figure 1C illustrates the UV-Vis-NIR absorption spectrum of THF-suspended 57ECA-SWNTs. In accordance with the aforementioned resonance Raman results, both ES22 (680 to 1100 nm) and ES11 (1000 to 1600 nm) transitions are substantially bigger than the EM11 (470 to 680 nm) transitions of met-SWNTs. The small peaks at 566, 606, 651 nm indicate that large dt met-SWNTs are also present in agreement with previously reported results.2, 13 The ES11 absorptions are significantly less resolved than SDS-dispersed nanotube sample,33 providing a qualitative assessment of its lightly bundled state.4, 20, 33 Figure 1D depicts an optical image of an NMR tube with the 57ECA-SWNTs suspension in THF-d8 under investigation. The black appearance of this suspension is indicative of the significant amount of nanotubes suspended with 57ECA. A high resolution TEM (HRTEM) image in Figure S1 in the Supporting Information (SI) provides additional verification of their lightly bundled state.
Thermal and Structural Characterization
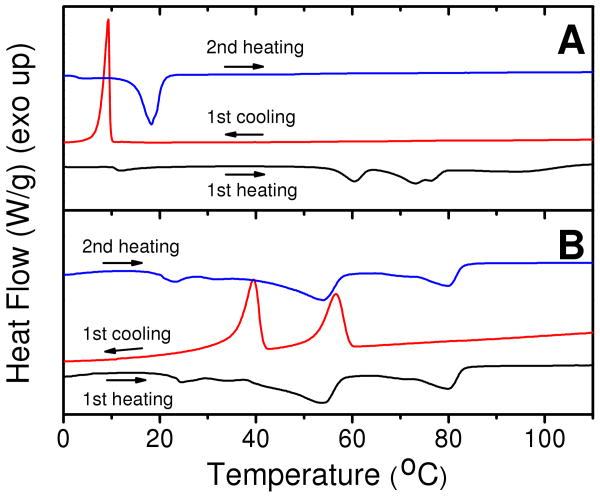
Typically 57ECA is a viscous liquid at room temperature. A prior report indicated that when alkyl amines are brought in contact with water, higher temperature liquid crystalline phases are formed.34 Following this finding, we solvent-cast n-hexane solutions of 57ECA onto a moisten glass surface to obtain a white crystalline solid. This solid was scraped off, vacuum-dried at room temperature, and subjected to DSC investigation as shown in Figure 2A. Multiple attempts using flame-dried sublimation setup failed to obtain the solid 57ECA sample, which suggests that water play a important role in formation of solid sample. The first heating scan indicates the presence of a small endotherm (ca. 12 °C) followed by multiple, higher temperature endotherms, between 50 and 80 °C. When this sample is subjected to cooling, only a low temperature exotherm was observed. Subsequent heating indicated a Tg around 5 °C, followed by a profound low-temperature endotherm peaking at 18 °C. Neat 57ECA (devoid of water) have shown similar DSC thermohistograms with the 2nd heating scan (data not shown), confirming its viscous liquid nature at room temperature. The water association with high temperature endotherms is also confirmed from Figure 2A, since, upon evaporating the H2O (at temperatures greater than 100 °C) at the end of the first heating scan, high temperature transitions were absent in the subsequent heating scan.
Figure 2.
5 °C/min differential scanning calorimetry (DSC) thermohistograms of 57ECA in the absence (A) and presence (B) of SWNTs. The 1st heating scan of Figure 2A originates from a H2O-containing 57ECA sample (see text for details).
Wide angle X-ray diffractometry (WAXD) was utilized to shed more light to the high-temperature order phase of 57ECA-H2O. The elimination of the low-temperature crystalline phase (Tm = 18 °C) was easily accomplished by performing WAXD at room temperature (ca. 25 °C). The strong 13.6 Å peak was indexed to the (004) longitudinal diffraction, based on the presence of four symmetry points, two of them originating from the diacetylene kinks and the other two from the 57ECA termini.35 Since 57ECA molecule is 28.5 Å long, the 54.4 Å (001) spacing suggests a slightly tilted herringbone type of structure (inset in Figure 3A), with significant lateral order as suggested by the multiplicity of diffraction peaks between 3 - 5 Å. The lack of higher order longitudinal diffractions (i.e. (006) and (008) at 9.1 and 6.8 Å, respectively) suggests that the high-temperature 57ECA-H2O phase belongs to higher ordered smectic phase, in accordance with a previous report.34
Figure 3.
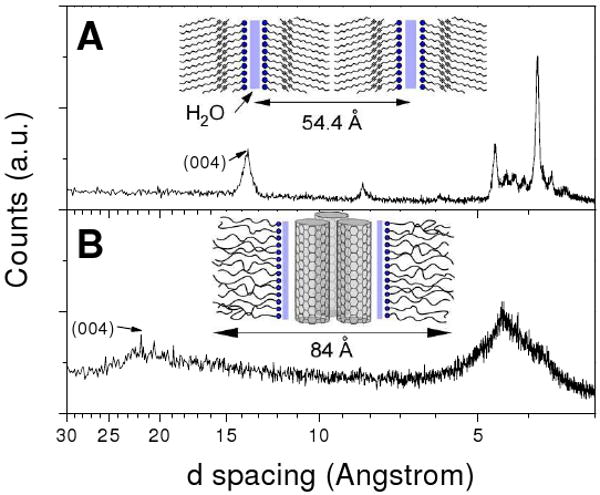
Wide angle X-ray diffraction of the high-melting point 57ECA-H2O structure (A) and 57ECA-SWNT (B). Insets portray the schematic organization of these complexes, with the blue solid lines indicating the location of water (close pack arrangement of the 57ECA amine heads on the sidewalls of SWNTs is supported by subsequent NMR and molecular simulations results).
Figure 2B illustrates heating and cooling DSC scans of 57ECA in the presence of SWNTs. In the first heating scan, a multiplicity of endotherms is observed, with the more pronounced endotherms peaking at 24, 54 and 81 °C. When this sample was cooled, supercooled exotherms corresponding to the 54 and 81 °C melting peaks were observed. On the second heating scan, all endothermic transitions of the 1st heating scan were observed, with out any diminution in their ΔH values. Unlike the 57ECA-H2O case of Figure 2A, the 57ECA-SWNT complexes exhibit profound stability of their underlying order, amid a strong tendency to also retain any residual H2O. Figure 3B depicts the corresponding WAXD results of 57ECA in the presence of SWNTs. The much broadened diffraction peaks indicate a higher degree of disorder. Utilizing the same formalism with the higher-temperature 57ECA-H2O smectic phase, the peak at 21 Å was similarly assigned to the (004) order. Unlike the lamellar 57ECA arrangement, the one dimensional (1D) character of SWNTs is expected to adopt a hexagonal lateral arrangement, with the 57ECA chains bend to accommodate close-packing. With a (001) spacing in the order of 84 Å, and assuming a 57ECA length slightly less than 54.4 Å (due to the trigonal disorder), a remaining 30 to 35 Å suggests the presence of a small SWNT bundle that consists of about 3 close-packed nanotubes. This is consistent with the HRTEM results of Figure S1 (in SI) along with the UV-Vis-NIR data of Figure 1C.
NMR Characterization
The peak assignments of various proton and carbon species within the aliphatic tail of 57ECA were accomplished on the basis of the known chemical shifts and inductive effects of functional groups.36 This has been confirmed using 1H-1H 2D-correlation spectroscopy (COSY) and 1H-13C heteronuclear multiple bond correlation (HMBC) as shown in Figures S2 and S3 in the SI, respectively. Figure S4 in the SI provides a close-up of the C10 to C17 region that is not easily visualized in Figure S3. Based on this analysis, all carbon species and the majority of proton species of 57ECA have been visualized and successfully assigned, according to the numbering shown in Scheme 2. In particular, H1 and H20 are isolated, while H4/H9, H3/H2/H10, H11-H19 are bundled within three separate peaks.
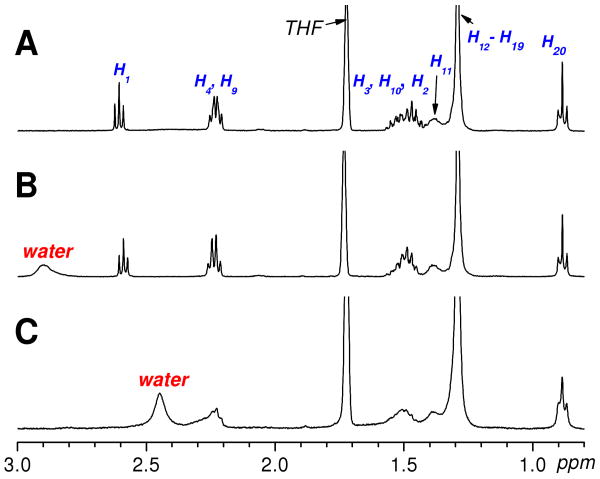
Figure 4A&B shows the 1H NMR of 57ECA in the absence (A) and presence (B) of water, dissolved in anhydrous THF-d8. Particular care was exerted to remove water from 57ECA using vacuum distillation and storing it within desiccated vials. When water is not present, 57ECA exhibits a 1H-NMR spectrum with a narrow line-width (i.e., 1.5 and 1.4 Hz for H1 and H20 peak, respectively). In the presence of water, 1H NMR of 57ECA shows a slight peak broadening (i.e., 1.7 and 1.5 Hz for H1 and H20 peaks, respectively). This broadening appears to be greater for the protons closer to the amine functionality. In addition, the H1 peak is rather upfield-shifted (by ca. 0.02 ppm) with respect to the neat 57ECA. This provides an initial indication that H2O (whose chemical shift is shown within a broad peak 2.9 ppm) is preferentially associated with the amine group of 57ECA and results in partial restriction of the mobility of its nearly H1.
Figure 4.
1H NMR spectra of 57ECA in the (A) absence and (B) presence of water. (C) 1H NMR spectrum of 57ECA-treated SWNTs, which are suspended in THF-d8.
Figure 4C illustrates the 1H NMR of 57ECA-treated SWNTs. This sample has a deep black appearance (Figure 1D), which indicates that considerable amounts of SWNTs are dispersed within the anhydrous THF-d8 solvent. As expected, the resulting 1H NMR spectrum is substantially broadened, and the H1 peak has completely disappeared. In the presence of SWNTs, the linewidth (3.8 Hz) of the terminal H20 proton is 2.5 times higher than that of neat 57ECA (i.e., 1.4 Hz). In the case of the composite H4/H9 peak, the H4 contribution appears substantially broadened, while the H9 peak exhibits a linewidth of 6.5 Hz as opposed to 3.7 Hz for neat 57ECA. Most interesting, however, is the position of the broad H2O peak that in the presence of SWNTs shows a dramatic (0.5 ppm) upfield shift to 2.4 ppm.
In order to elucidate the nature of the water peak shift, we added 20 μL of HCl-acidified D2O with varying pH values (i.e., 2, 3, 4 and 5) to the neat 57ECA THF-d8 solution. Figure S5 of the SI depicts the 1H NMR spectra of 57ECA as a function of the pH values of the added HCl-acidified D2O. The water peak is gradually upshifted and sharpened at lower pH values and in the case of pH of 2 addition of HCl-acidified D2O it peaked at a value of 2.8 ppm.37 As expected, the overwhelming amount of 57ECA within the THF-d8 solution neutralizes the majority of HCl. In the case of SWNT, the observed 2.4 ppm value indicates that this water is considerably acidic. In order to determine whether this water is evenly distributed within the suspension or locally resides at the vicinity of SWNTs, we have added 4 Å molecular sieves to the 57ECA/SWNT in THF-d8 suspension. Failure to remove or even lower the signal originating from water indicates that this acidic water is located at the vicinity of carbon nanotubes. This suggests that acid/base interactions between acidic water and basic 57ECA surfactant amine might be the reason for the strong association of the amine head group onto the nanotubes, with such ionic bond stabilized due to the low dielectric constant of the surrounding THF environment.
Since the H1 shift of 57ECA is situated close to the broad and pH-dependent resonance of H2O in Figure 4, it is important to ensure that in the case of 57ECA-SWNT (Figure 4C), the particular proton is absent and not buried underneath the water peak. For this we utilized ODA as opposed to 57ECA, since the H1 triplet is far away from other proton peaks, such as the H4 and H9 of 57ECA. Figure S6(A) of the SI, illustrates the 1H-NMR spectrum of neat ODA in anhydrous THF-d8, with the H1 triplet centered at 2.58 ppm, which is the exactly same position with that of 57ECA. Figure S6(B&C) of the SI depict the 1H-NMR spectra of ODA-treated SWNT at 27 and 57 °C, respectively. Acquiring the ODA-SWNT spectrum at different temperatures, enabled us to shift the H2O peak away from the chemical shift of H1, while all other protons remain unchanged.16 The absence of the H1 triplet in both temperatures suggests that the amine surfactants are strongly anchored on the nanotube side-walls and this complex is stable at 57 °C (close to the boiling point of THF).
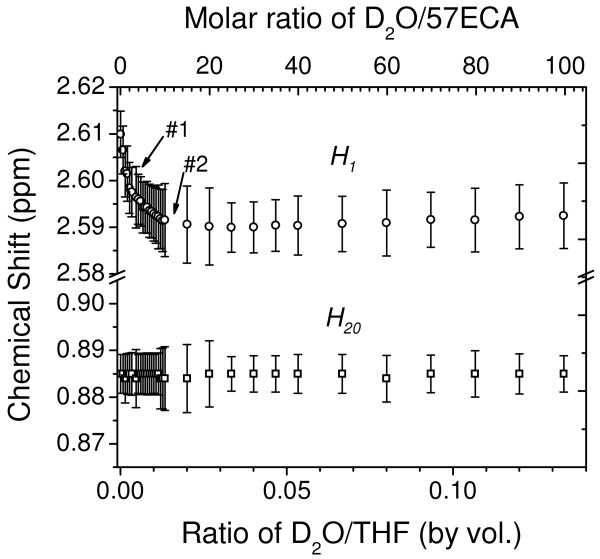
As shown in both DSC and XRD studies, the amount of H2O plays a strong role to the ordering of surfactant amines in the condensed state. In order to elucidate the effect of H2O in the dissolved state, we investigated the peak position and line broadening of the terminal protons of 57ECA (i.e., H1 and H20) protons as a function of water concentration. Figure 5 depicts the peak positions (open circles and squares for H1 and H20, respectively) along with line broadening (shown by error bars) as a function of D2O concentration, given in both D2O/THF volume and D2O/57ECA molar ratio (shown in bottom and top abscissa, respectively). While the chemical shift and linewidth of H20 remain almost constant upon addition of D2O, the same is not observed for the H1 peak. The H1 proton first experiences a rapid upfield (until ca. 0.0027 D2O/THF volume ratio corresponding to ca. 2-3 molecules of water per amine, shown with an arrow #1), which is then followed by a more gradual upfield shift before reaching a plateau (shown with an arrow #2). Similarly, the increase in line broadening follows these two regimes and records a 10 and 56 % raise (at the aforementioned arrow points), when compared with the neat value of 57ECA. This behavior is indicative of the water-assisted colloidal surfactant organization of 57ECA in 8.6 mM THF dilute solution. Moreover, the presence of two distinct regimes at ca. 3 and 10 equivalence of D2O/57ECA might suggest the formation of defined structures with preferred association patterns between water and surfactant amines.
Figure 5.
Chemical shift and line width variation of H1 and H20 peaks, as a function of increasing D2O concentration in THF-d8. Open circles and squares denote the chemical shifts of peaks, respectively. Error bars depict the corresponding full-width at half-maximum (FWHM) values of the H1 and H20 peaks.
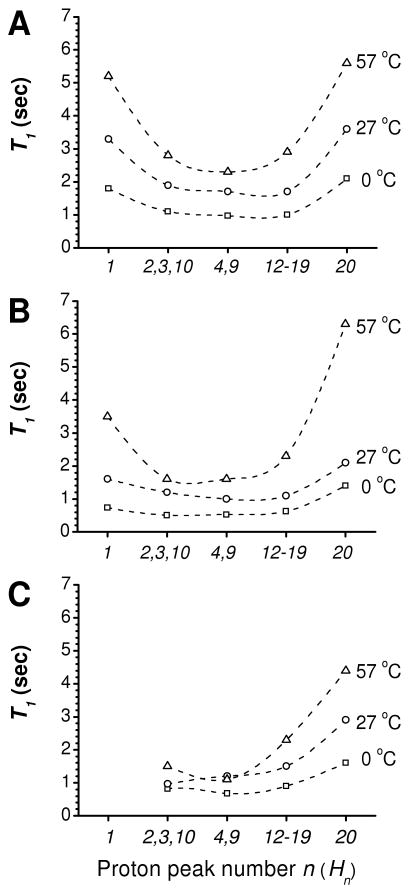
To better elucidate the effect of water and SWNTs on the 1H spin-lattice relaxation dynamics of 57ECA, we performed T1 measurements as a function of proton number (Hn) and sample temperature (0, 27, and 57 °C). With an exception of H10, Figure 6 plots the average T1 values in a sequential manner, with the H1 proton (adjacent to the amine) left and the H20 to the right. For neat 57ECA, and in the absence of water (Figure 6A), the central protons exhibit lower T1 values as opposed to both termini. This is typical for long alkyl chains.38, 39 These values steadily increase with increasing temperature.40 The addition of 200 μL of water (Figure 6B), which is in the plateau regime of H1 chemical shift (Figure 5), have caused the following effects to the T1 values of 57ECA: i) In the case of 0 and 27 °C experiments, all values are nearly half of that of neat 57ECA; ii) The T1 value of H1 is more significantly depressed than that of H20, and closer to the values of the central surfactant portion; (iii) A large increase in T1 values is observed for the 57 °C experiment. Here, the T1 value of terminal H20 raises to match or slightly exceed that of the neat 57ECA, while the H1 value increases from 0.5 to 0.67 of the neat 57ECA. These trends indicate H2O assists the self-organization of 57ECA and preferentially interacts with the amine group, thereby restricting H1 mobility. Moreover, a phase-transition appears to take place between 27 and 57 °C, which is beyond the scope of this investigation.
Figure 6.
57ECA 1H NMR T1 as a function of proton number (Hn) and sample temperature in the absence (A) and presence (B) of water, as well as in the presence of SWNTs (C). Dashed curves were drawn to guide the eye.
In the presence of SWNTs (Figure 6C) an additional reduction in T1 values is witnessed, particularly with the 27 and 57 °C curves. Here, due to nanotube immobilization, the H1 proton is absent (vide supra) and it is important to recognize that the T1 value from the H2/H3/H10 composite peak might be dominated by the H10 proton, which is the farthest away from the nanotube. Nevertheless, the remaining proton T1 values paint a consistent picture with increase mobility as we move away from the nanotube. Unlike the 57ECA-H2O case, the tail mobility increases gradually with temperature while retaining their strong nanotube association (vide supra).
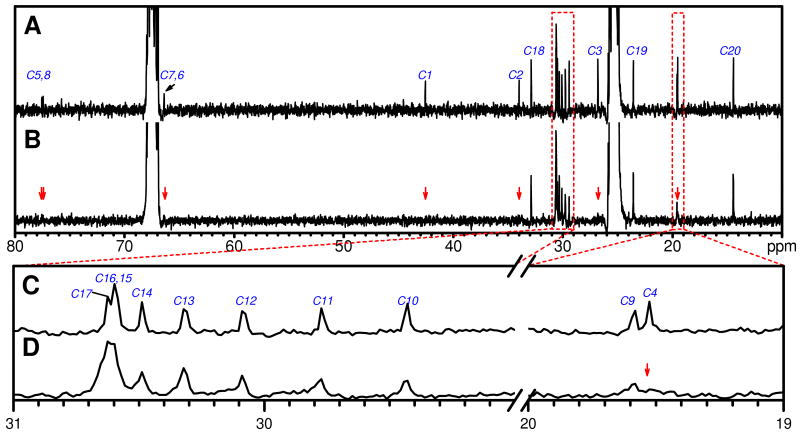
To further elucidate the gradual increase in surfactant chain mobility from C1 to C20 we investigated the 13C NMR spectra in the presence and absence of SWNTs. Figure 7A illustrates the 13C NMR spectrum of neat 57ECA in THF-d8 (in the absence of H2O). With the help of 1H-13C HMBC, the chemical shifts of all carbon atoms have been deciphered as labeled in Scheme 2 and Figure 7A. Figure 7C zooms in two sections of Figure 7A and exposes the chemical shifts of C10 to C17, as well as C9 and C4, which are otherwise too close to be visualized. In a similar fashion, Figures 7B and 7D show the 13C NMR spectrum of 57ECA-SWNTs. In the presence of SWNTs, the chemical shifts of C1 through C8 are completely lost within the noise, as indicated by the red arrows in Figures 7B and 7D. Moreover, the amplitudes (line-widths) of C9 to C17 atoms exhibit a progressive increase (decrease) as we move from the 9th to the 17th position (Figure 7D). For amplitude comparison, the two 13C spectra were normalized against the C20 peak. When, however, the C20 linewidth are compared, a near 2-fold increase is registered in the presence of SWNTs. These findings provide a comprehensive picture of amine anchoring onto the nanotube sidewalls. The gradual linewidth decrease as the carbon atom moves further from the nanotube depends on the surfactant stiffness and the progressively larger free volume that the surfactant experiences at greater distance from the graphene sidewalls. In terms of the C1 to C8 carbons, the slow tumbling rate of nanotubes in conjunction with the stiff diacetylenic group is believed to account for the loss of their signatures due to broadening.21 Starting from C9, the spectral lines are visible, but noticeably broadened compared to the free surfactant. This effect is more pronounced for carbons closer to the head group.
Figure 7.
13C NMR spectra of 57ECA in the absence (A and C) and presence (B and D) of SWNTs. (C) and (D) are close-ups of the respective spectral regions enclosed in dotted boxes in (A) and (B).
Discussion
The NMR results are indicative of strong affinity of the amine head for the sidewalls of SWNTs, with the surfactant tail gaining progressive mobility as it gets further from the nanotube surface. Based on 1H-NMR T1 results, it appears that the interaction with water also diminishes the mobility of the amine head, in a similar fashion with SWNTs, albeit to a lesser degree. Yet the question remains on how a hydrophobic entity like a nanotube is capable to bind to terminal amines in a way similar to water? A crucial piece of information to help us address this question is believed to originate from the acidity of water in the vicinity of SWNTs. It has been shown before by our group14 as well as others,41, 42 that H2O actively participates in the electrochemistry of SWNTs. In the presence of acid and O2, carbon nanotubes loose electrons to produce oxidized, p-doped SWNTs (SWNTn+), according to reaction (1).14, 41
| (1) |
In the presence of water and proton-withdrawing species (like amines), reaction (1) was shown to reverse its course and produce undoped or less p-doped SWNTs.14 For SWNTs with diameter (dt = 1.0 nm), where sem- from met-SWNT separation was shown experimentally2, 13 and by modeling14 to reach maximum, exposure to a mixture of HNO3/H2SO4 provides a depth of doping at ca. 0.04 and 0.01 electrons/carbon atom per sem- and met-SWNTs, respectively (Figure S7 in SI). This implies that a counter ion (i.e., NO3-) and its hydration sphere (ca. 5 H2O molecules29) needs to come in close proximity with either 25 carbon atoms of sem-SWNTs or with 100 carbon atoms of met-SWNTs. In accordance with reference,29 a two-dimensional (2D) close-packed arrangement of hydrated NO3- ions produces an intermolecular nitrate spacing of ca. 5.2 Å, shown in the left part of Figure 8A. Such 2D-arrangement of NO3- ions covers ca. 8 graphene carbons per hydrated nitrate, which is much less from the aforementioned 25 carbons per one electron doping of sem-SWNTs. This 2D arrangement creates a strong driving force for small bundling (i.e., three sem-nanotubes in a bundle), which is capable of accommodating both continuous counter ions/hydrate and the hydrophobic sidewall remainders of SWNTs (shown in the right part of Figure 8A). Assuming that nanotube bundling allows for charge distribution through all participating nanotubes,43 a small bundle of three sem-SWNTs with dt = 1.0 nm exposes ca. 8 to 9 carbon atoms per counter ion. This is in agreement with both simulation and experimental results, provided by XRD and HRTEM (Figures 3B and S1), respectively.
Figure 8.
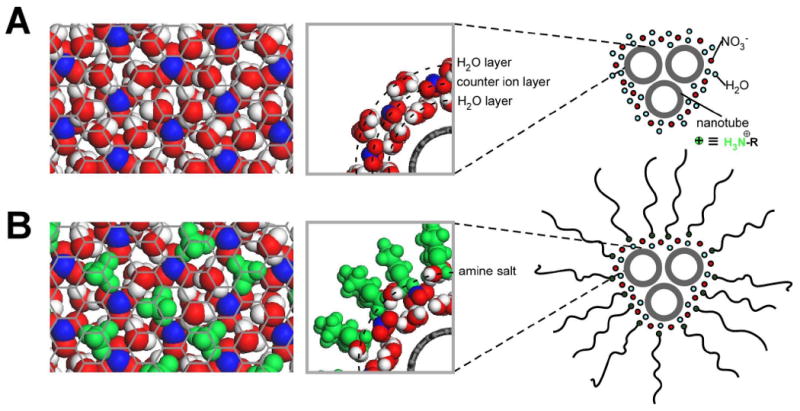
Molecular simulation arrangement of hydrated nitrate counter ions, in the absence (A) and presence (B) of the surfactant amine. N, O and H are shown in blue, red and white, respectively, while the surfactant amine is shown in green. (Left) 2D arrangements of NO3- ions on top of a graphene lattice. For clarity purposes, only the H2O molecules adjacent to the graphene lattice are shown. (Center) Edge views of hydrated NO3- ions (A) and surfactant amine salts (B). (Right) Schematic representation of 2D organization around small nanotube bundles containing three SWNTs.
When the hydrated, close-packed NO3-/(H2O)5 2D arrangement is presented to surfactant amines, the inverse of reaction (1) takes place as a result of acid neutralization. Since the molar volume of NH4+ ions is shown to be comparable to that of H2O (in terms of bond angles, interatomic distances, and hydrogen bonding)44 the replacement of surfactant amine with water is expected to occur with minimum change in the average molecular arrangement.45 If such neutralization is driven to completion, reaction (2) is expected for 25 carbon atoms equivalence of a nanotube (or 8.33 surface carbons per small bundle of three nanotubes) (Figure 8B).
| (2) |
The well-know affinity of O2 for hydrophobic entities is expected to remove the generated oxygen away from the nanotube surface, leaving behind a 2D hydrophilic layer that has been augmented by an amine and depleted by a half water molecule. Molecular simulations indicate that this corresponds to an approximate 10 to 11% volume increase in the hydrophilic 2D-layer that surrounds the small sem-SWNT bundles, since one molecule of H2O is replaced with two -NH3+ moieties. Moreover, the need for the surfactant amine head to get in close proximity of the NO3- ions exerts a substantial compression of the hydrophilic 2D-layer by its hydrophobic tail. Such compression is currently believed to lead in less than complete neutralization. For example, a 95% neutralization will leave 0.025 H3O+ per 462.5 H2O, assuming that the equilibrium constant of reaction (1) is unity. This corresponds to a 2.26 localized pH of the water in the vicinity of SWNTs, which is in good agreement with the NMR results of Figures 4 and S5. Such low pH is expected to retain significant part of the p-doped nature of SWNTs,46 and account for strong interactions of the graphene sheet with the adjacent charge-balancing NO3- counter ions. In addition, the surfactant-driven compressive force around the hydrophilic 2D-layer is expected to shield it from the surrounding amine-driven basic environment and retain its acidic nature.
The partial neutralization of surface acidity of p-doped SWNTs provides a more comprehensive picture of the surfactant amine-assisted enrichment of sem-SWNTs. First and foremost it indicates that the extraordinary stability of the (sem-SWNT)3/surfactant amine complex might originate from the regular 2D pattern of alternating NO3- and RNH3+ groups that are interspaced with acidic water (Figure 8B left). Moreover, the enrichment of sem- against met-SWNTs appears to originate not from the action of amines but rather the inherent redox differences between the sem- and met-SWNT species. Unlike the well-distributed 2D arrangements of NO3-/(H2O)5 and NO3-/RNH3+(H2O)4.5 around a small bundle of three sem-SWNTs, similar bundling arrangements between various mixtures of met- and sem-SWNTs can never be established due to: (i) inability of met-SWNTs to attain as large charge/carbon ratio, and (ii) progressively higher resistance for outer surface charge redistribution as the bundle size increase.43 For bundle mixtures of met- and sem-SWNTs, this ideal 2D arrangement of NO3-, RNH3+ and H2O is disturbed. This is expected to cause a discontinued, patch-like surfactant decoration on the surface of the nanotube bundles containing met- and sem-SWNTs mixtures. Such action depresses the ability to met-containing SWNT bundles to disperse in THF that ultimately leads to sem-enrichment. Having said this, it is important to stress that the kinetics of the formation of these small, sem-enriched, SWNT bundles in the present of surfactant amines are currently unknown, which warrants the topic of a separate study.
Conclusion
Both static and dynamic characteristics of surfactant amine organization on the surface of SWNTs were investigated using an asymmetrical diacetylene-based surfactant amine (57ECA), presenting a similar sem-enrichment to that of octadecylamine (ODA). Despite the non-bonding arrangement of the surfactant with SWNTs, 1H and 13C NMR investigations indicate that the amine head group is firmly immobilized onto the nanotube surface together with acidic water, while the tail attains progressively larger mobility as it gets farther from the SWNT. High resolution transmission electron microscopy in conjunction with X-ray diffraction results point toward the fact that the sem-enriched fraction is populated by small nanotube bundles containing approximately three SWNTs. With the help of molecular modeling and previously published differential oxidation depths for sem- and met-SWNT species, the formation of these small, sem-enriched bundles were explained on charge redistribution on the surface of these bundles together with the formation of a stable 2D arrangement of NO3-/surfactant amine/water layer. The significantly less oxidation depth of met-SWNTs renders the aforementioned arrangement discontinuous around the nanotube bundles, thereby explaining their inability for THF dispersion. This study provides a comprehensive picture of the surfactant amine-assisted met- from sem-enrichment methodology, explains its profound differences from other separation techniques, and further enhances our understanding of the complex molecular interaction at the surface of redox-prone nanomaterials.
Supplementary Material
Acknowledgments
The authors wish to thank to Martha Morton and Rongfu Li for helpful discussions and setup on NMR experiment and TEM measurement, respectively. Financial support, mainly from AFOSR FA9550-06-1-0030NSF, and in part by NSF-NIRT DMI-0422724, and NSF-CBET-0828771/0828824, NIH ES013557 is greatly appreciated.
Footnotes
Contribution from the Nanomaterials Optoelectronics Laboratory (NOEL), Polymer Program, Institute of Materials Science, University of Connecticut, Storrs, Connecticut 06269
Supporting Information available: High resolution transmission electron microscopy (HRTEM) images of 57ECA-SWNTs (Fig. S1), 2D 1H-1H COSY (Fig. S2), 2D 1H-13C HMBC (Fig. S3), and close-up of 1H-13C HMBC (Fig. S4) of neat-57ECA along with assignments of peaks, acidity effects on the 1H NMR position of water peak of 57ECA (Fig. S5), confirming the absence of buried peak under water using temperature-controlled 1H NMR (Fig. S6), and valence density of states (DOS) with respect to vacuum for a (7,7) met- and (11,3) sem-SWNTs (Fig. S7).
References
- 1.Dresselhaus MS, Dresselhaus G, Avouris P. Carbon nanotubes: synthesis, structure, properties and applications. Springer; Berlin: 2001. [Google Scholar]
- 2.Chattopadhyay D, Galeska I, Papadimitrakopoulos F. J Am Chem Soc. 2003;125:3370–3375. doi: 10.1021/ja028599l. [DOI] [PubMed] [Google Scholar]
- 3.Krupke R, Hennrich F, Lohneysen Hv, Kappes MM. Science. 2003;301:344–347. doi: 10.1126/science.1086534. [DOI] [PubMed] [Google Scholar]
- 4.Zheng M, Jagota A, Semke ED, Diner BA, McLean RS, Lustig SR, Richardson RE, Tassi NG. Nat Mater. 2003;2:338–342. doi: 10.1038/nmat877. [DOI] [PubMed] [Google Scholar]
- 5.Zheng M, Jagota A, Strano MS, Santos AP, Barone P, Chou SG, Diner BA, Dresselhaus MS, McLean RS, Onoa GB, Samsonidze GG, Semke ED, Usrey M, Walls DJ. Science. 2003;302:1545–1548. doi: 10.1126/science.1091911. [DOI] [PubMed] [Google Scholar]
- 6.Arnold MS, Green AA, Hulvat JF, Stupp SI, Hersam MC. Nat Nanotech. 2006;1:60–65. doi: 10.1038/nnano.2006.52. [DOI] [PubMed] [Google Scholar]
- 7.Hamon MA, Chen J, Hu H, Chen Y, Itkis ME, Rao AM, Eklund PC, Haddon RC. Adv Mater. 1999;11:834–840. [Google Scholar]
- 8.Liu J, Rinzler AG, Dai H, Hafner JH, Bradley RK, Boul PJ, Lu A, Iverson T, Shelimov K, Huffman CB, Rodriguez-Macias F, Shon YS, Lee TR, Colbert DT, Smalley RE. Science. 1998;280:1253–1256. doi: 10.1126/science.280.5367.1253. [DOI] [PubMed] [Google Scholar]
- 9.Hamon MA, Hu H, Bhowmik P, Niyogi S, Zhao B, Itkis ME, Haddon RC. Chem Phys Lett. 2001;347:8–12. [Google Scholar]
- 10.Basiuk EV, Basiuk VA, Banuelos JG, Saniger-Blesa JM, Pokrovskiy VA, Gromovoy TY, Mischanchuk AV, Mischanchuk BG. J Phys Chem B. 2002;106:1588–1597. [Google Scholar]
- 11.LeMieux MC, Roberts M, Barman S, Jin YW, Kim JM, Bao Z. Science. 2008;321:101–104. doi: 10.1126/science.1156588. [DOI] [PubMed] [Google Scholar]
- 12.Zhang G, Qi P, Wang X, Lu Y, Li X, Tu R, Bangsaruntip S, Mann D, Zhang L, Dai H. Science. 2006;314:974–977. doi: 10.1126/science.1133781. [DOI] [PubMed] [Google Scholar]
- 13.Samsonidze GG, Chou SG, Santos AP, Brar VW, Dresselhaus G, Dresselhaus MS, Selbst A, Swan AK, Unlu MS, Goldberg BB, Chattopadhyay D, Kim SN, Papadimitrakopoulos F. Appl Phys Lett. 2004;85:1006–1008. [Google Scholar]
- 14.Kim SN, Luo Z, Papadimitrakopoulos F. Nano Lett. 2005;5:2500–2504. doi: 10.1021/nl051840k. [DOI] [PubMed] [Google Scholar]
- 15.Panich AM. Diamond Relat Mater. 2007;16:2044–2049. [Google Scholar]
- 16.Mallamace F, Corsaro C, Broccio M, Branca C, Gonzalez-Segredo N, Spooren J, Chen SH, Stanley HE. Proc Nat Acad Sci U S A. 2008;105:12725–12729. doi: 10.1073/pnas.0805032105. [DOI] [PMC free article] [PubMed] [Google Scholar]
- 17.Holzinger M, Vostrowsky O, Hirsch A, Hennrich F, Kappes M, Weiss R, Jellen F. Angew Chem Int Ed. 2001;40:4002–4005. [PubMed] [Google Scholar]
- 18.Holzinger M, Abraham J, Whelan P, Graupner R, Ley L, Hennrich F, Kappes M, Hirsch A. J Am Chem Soc. 2003;125:8566–8580. doi: 10.1021/ja029931w. [DOI] [PubMed] [Google Scholar]
- 19.Star A, Stoddart JF, Steuerman D, Diehl M, Boukai A, Wong EW, Yang X, Chung SW, Choi H, Heath JR. Angew Chem Int Ed. 2001;40:1721–1725. doi: 10.1002/1521-3773(20010504)40:9<1721::aid-anie17210>3.0.co;2-f. [DOI] [PubMed] [Google Scholar]
- 20.Chen J, Liu H, Weimer WA, Halls MD, Waldeck DH, Walker GC. J Am Chem Soc. 2002;124:9034–9035. doi: 10.1021/ja026104m. [DOI] [PubMed] [Google Scholar]
- 21.Xu M, Huang Q, Chen Q, Guo P, Sun Z. Chem Phys Lett. 2003;375:598–604. [Google Scholar]
- 22.Nikolaev P, Bronikowski MJ, Bradley RK, Rohmund F, Colbert DT, Smith KA, Smalley RE. Chem Phys Lett. 1999;313:91–97. [Google Scholar]
- 23.Lin Y, Taylor S, Huang W, Sun YP. J Phys Chem B. 2003;107:914–919. [Google Scholar]
- 24.Bachilo SM, Strano MS, Kittrell C, Hauge RH, Smalley RE, Weisman RB. Science. 2002;298:2361–2366. doi: 10.1126/science.1078727. [DOI] [PubMed] [Google Scholar]
- 25.Nelson DL, Cox MM. Lehninger Principles of Biochemistry. 3rd. Worth Publishers Inc.; New York: 2003. [Google Scholar]
- 26.Ju SY, Papadimitrakopoulos F. J Am Chem Soc. 2008;130:655–664. doi: 10.1021/ja076598t. [DOI] [PubMed] [Google Scholar]
- 27.Vogel AI, Tatchell AR, Furnis BS, Hannaford AJ, Smith PWG. Vogel's Textbook of Practical Organic Chemistry. 5th. Prentice Hall; New York: 1996. p. 438. [Google Scholar]
- 28.Ju SY, Doll J, Sharma I, Papadimitrakopoulos F. Nat Nanotech. 2008;3:356–362. doi: 10.1038/nnano.2008.148. [DOI] [PubMed] [Google Scholar]
- 29.Kameda Y, Saitoh H, Uemura O. Bull Chem Soc Jpn. 1993;66:1919–1923. [Google Scholar]
- 30.Walsh SP, Lando JB. Langmuir. 1994;10:252–256. [Google Scholar]
- 31.Ahn DJ, Kim JM. Acc Chem Res. 2008;41:805–816. doi: 10.1021/ar7002489. [DOI] [PubMed] [Google Scholar]
- 32.Gooding JJ, Wibowo R, Liu J, Yang W, Losic D, Orbons S, Mearns FJ, Shapter JG, Hibbert DB. J Am Chem Soc. 2003;125:9006–9007. doi: 10.1021/ja035722f. [DOI] [PubMed] [Google Scholar]
- 33.O'Connell MJ, Bachilo SM, Huffman CB, Moore VC, Strano MS, Haroz EH, Rialon KL, Boul PJ, Noon WH, Kittrell C, Ma J, Hauge RH, Weisman RB, Smalley RE. Science. 2002;297:593–596. doi: 10.1126/science.1072631. [DOI] [PubMed] [Google Scholar]
- 34.Ralston AW, Hoerr CW, Hoffman EJ. J Am Chem Soc. 1942;64:1516–1523. [Google Scholar]
- 35.Yang Y, Lu Y, Lu M, Huang J, Haddad R, Xomeritakis G, Liu N, Malanoski AP, Sturmayr D, Fan H, Sasaki DY, Assink RA, Shelnutt JA, van Swol F, Lopez GP, Burns AR, Brinker CJ. J Am Chem Soc. 2003;125:1269–1277. doi: 10.1021/ja027332j. [DOI] [PubMed] [Google Scholar]
- 36.Pavia DL, Lampman GM, Kriz GS. Introduction to Spectroscopy. 3rd. Brooks Cole; 2000. [Google Scholar]
- 37.Farcasiu D, Ghenciu A. J Am Chem Soc. 1993;115:10901–8. [Google Scholar]
- 38.Oku K, Watanabe H, Kubota M, Fukuda S, Kurimoto M, Tsujisaka Y, Komori M, Inoue Y, Sakurai M. J Am Chem Soc. 2003;125:12739–12748. doi: 10.1021/ja034777e. [DOI] [PubMed] [Google Scholar]
- 39.Kobayashi H, Yoshida M, Maeda I, Miyashita K. J Oleo Sci. 2004;53:105–108. [Google Scholar]
- 40.Sanders JKM, Hunter BK. Modern NMR Spectroscopy: A Guide for Chemists. Oxford University Press; New York: 1987. [Google Scholar]
- 41.Zheng M, Diner BA. J Am Chem Soc. 2004;126:15490–15494. doi: 10.1021/ja0457967. [DOI] [PubMed] [Google Scholar]
- 42.O'Connell MJ, Eibergen EE, Doorn SK. Nat Mater. 2005;4:412–418. doi: 10.1038/nmat1367. [DOI] [PubMed] [Google Scholar]
- 43.Baughman RH, Cui C, Zakhidov AA, Iqbal Z, Barisci JN, Spinks GM, Wallace GG, Mazzoldi A, De Rossi D, Rinzler AG, Jaschinski O, Roth S, Kertesz M. Science. 1999;284:1340–1344. doi: 10.1126/science.284.5418.1340. [DOI] [PubMed] [Google Scholar]
- 44.Vollmar PM. J Chem Phys. 1963;39:2236–2248. [Google Scholar]
- 45.Narten AH. J Phys Chem. 1970;74:765–768. [Google Scholar]
- 46.Strano MS, Huffman CB, Moore VC, O'Connell MJ, Haroz EH, Hubbard J, Miller M, Rialon K, Kittrell C, Ramesh S, Hauge RH, Smalley RE. J Phys Chem B. 2003;107:6979–6985. [Google Scholar]
Associated Data
This section collects any data citations, data availability statements, or supplementary materials included in this article.


