Abstract
A central tenet of the lipid raft model is the existence of non-raft domains. In support of this view, we have established in model membranes that a phosphatidylethanolamine (PE)-containing docosahexaenoic acid (DHA) forms organizationally distinct non-raft domains in the presence of sphingomyelin (SM) and cholesterol (Chol). We have shown that formation of DHA-rich domains is driven by unfavorable molecular interactions between the rigid Chol molecule and the highly flexible DHA acyl chain. However, the molecular interactions between SM and the DHA-containing PE, which could also contribute to the formation of DHA-rich non-raft domains, have not been sufficiently investigated. To address this issue, we use differential scanning calorimetry (DSC) to study the phase behavior of mixtures of SM with either 1-palmitoyl-2-docosahexaenoyl-sn-glycero-3-phosphoethanolamine (16:0-22:6PE) or 1-palmitoyl-2-oleoyl-sn-glycero-3-phosphoethanolamine (16:0-18:1PE), an oleic acid (OA)-containing control, over a wide range of concentrations. Deconvolution of binary DSC scans shows that both 16:0-22:6PE and 16:0-18:1PE phase separate from SM. Analysis of transition temperatures and partial phase diagrams, constructed from the DSC scans for the first time, show that 16:0-22:6PE displays greater non-ideal mixing with SM compared to 16:0-18:1PE. Our findings support a model in which DHA- and OA-containing PEs differentially phase separate from SM over a wide range of molar ratios to initiate the formation of non-raft domains, which is greatly enhanced by DHA, but not OA, in the presence of cholesterol.
Keywords: non-raft domains, docosahexaenoic acid, differential scanning calorimetry
Docosahexaenoic acid (DHA, 22:6) is an n-3 polyunsaturated fatty acid (PUFA) that is increasingly consumed as a food supplement by the general public and is also being tested clinically for the treatment of specific human ailments [1,2]. Most notably, DHA is documented to provide some beneficial effects for the treatment of specific symptoms associated with autoimmune and inflammatory disorders [3,4]. However, effective use of DHA as a food additive or as a therapeutic agent has been limited by poor understanding of its mode of action at the molecular level.
One emerging view is that DHA-containing phospholipids modify the biophysical organization of the plasma membrane, which in turn modifies protein activity and cellular function [5–10]. This possible mechanism has a broad impact given that dietary intake of DHA can increase incorporation of the fatty acid into the sn-2 position of the major membrane phospholipids, phosphatidylcholine (PC) and phosphatidylethanolamine (PE), by up to 8 fold [11]. In support of a role for DHA in membrane organization, we have established that the heteroacid phospholipid 16:0-22:6PE, with palmitic acid in the sn-1 chain and DHA in the sn-2 chain, forms domains that are organizationally distinct from sphingomyelin (SM)- and cholesterol (Chol)-rich lipid rafts [12–15]. While tremendous attention has been given to SM/Chol-rich lipid rafts, which serve to compartmentalize cellular signaling events, very little is known about the composition, function or even existence of non-raft domains [9,16–18].
Using several biophysical methods, we have found that phase separation of 16:0-22:6PE from lipid rafts is driven by unfavorable interactions between the DHA acyl chain and Chol [15,19]. X-ray diffraction measurements, supported by solid state 2H NMR show the highly disordered structure of DHA is sterically incompatible with the rigid steroid moiety of Chol [19]. In contrast, 16:0-18:1PE, containing the monounsaturated oleic acid (OA), does not phase separate from SM and Chol to the same extent because the more ordered structure of OA allows close proximity to the sterol [20]. A key point that we have not thoroughly investigated in our model is the molecular relationship between SM and PE. Initially, we inferred from differential scanning calorimetry (DSC) that 16:0-22:6PE, but not 16:0-18:1PE, phase separates from SM [21]. More recently, data from our laboratories indicate that both 16:0-22:6PE and 16:0-18:1PE can phase separate from SM in the absence of Chol, contradictory to our initial interpretation [12,13]. To resolve this discrepancy, here we initiated a study comparing the phase behavior of 16:0-22:6PE vs. 16:0-18:1PE in mixtures with SM over a wide range of mol fractions. Using DSC, we find that both PEs do indeed phase separate from SM. However, there are differences in the phase behavior of 16:0-18:1PE/SM versus 16:0-22:6PE/SM. Phase diagrams for SM/16:0-22:6PE and SM/16:0-18:1PE mixtures, constructed from DSC scans, for the first time, confirm greater immiscibility for DHA- over an OA-containing PE with SM.
Materials and Methods
Materials
1-palmitoyl-2-oleoyl-sn-glycero-3-phosphoethanolamine (16:0-18:1PE), 1-palmitoyl-2-docosahexaenoyl-sn-glycero-3-phosphoethanolamine (16:0-22:6PE) and egg sphingomyelin (SM) were purchased from Avanti Polar Lipids (Alabaster, AL). The concentration of lipid stock solutions was quantified using phosphate analyses [13]. Lipid purity was assessed with thin layer chromatography (TLC) on high performance TLC plates (Alltech, Deerfield, IL). Water for buffer solutions was deionized, glass distilled and further purified with a Milli-Q system (Millipore, Bedford, MA) prior to use.
Differential Scanning Calorimetry (DSC)
DSC samples were prepared taking stringent precautions to prevent oxidation. As described before, the precautions entailed preparing samples under low light conditions in a glove box filled with nitrogen gas [12,13,21]. All lipid mixtures were co-dissolved in HPLC grade chloroform (Sigma, St. Louis, MO) and evaporated under a gentle stream of argon gas and subsequently placed in a vacuum pump overnight to remove residual organic solvent. The dried lipid mixtures (5 mg) were then mixed with 1 ml of 10 mM sodium phosphate buffer (pH 7.0) above the phase transition temperature (Tm) of sphingomyelin (>38 °C), the lipid in the mixture with the highest Tm, in order to ensure complete hydration. The resultant aqueous suspensions were frozen on dry ice and thawed three times in a water bath above the Tm of the lipids. 500μl samples were degassed and placed into the three chambers of a Calorimetry Sciences DSC (American Fork, UT) while the fourth chamber (reference) contained 500μl of buffer. All measurements were made at a scan rate of 0.125 °C/min. Consecutive heating and cooling scans were acquired and analyzed. They exhibited negligible hysteresis and, consistent with our previous reports [12,13,21], only the cooling scans are presented. Control samples of 16:0-16:0PC were routinely run to ensure instrument calibration.
Analysis
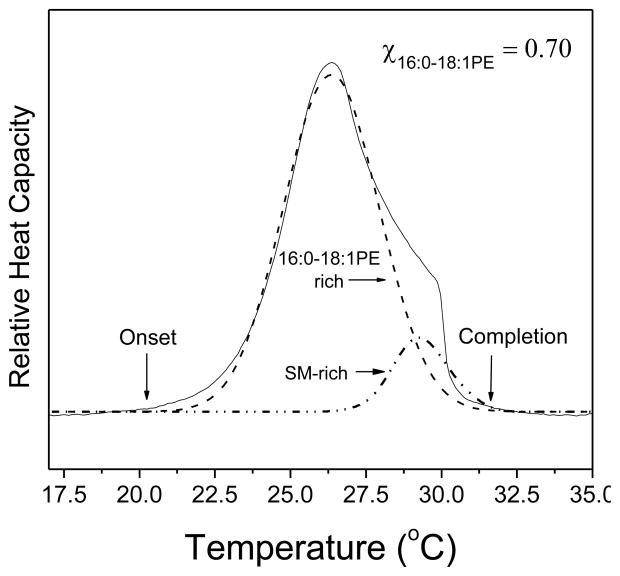
All deconvolutions of the multicomponent scans after baseline correction were conducted using Microcal Origin software as described recently [12]. The strategy employed is elaborated in Figure 1. Tms for a given solid to fluid transition are defined as the midpoint of the associated peak in the scan. Enthalpies for the pure components were determined by integrating the curves.
Figure 1. Deconvolution of multicomponent DSC scans.
Sample DSC scan of SM with 0.7 mol fraction 16:0-18:1PE. Deconvolution of the scan (solid line), as described in the Materials and Methods, allowed the assignment of a SM-rich phase melting at higher temperature and a 16:0-18:1PE-rich phase melting at lower temperature (dashed lines). For each phase, we determined the transition temperature (Tm), which is the mid-point of the Gaussian curve. The onset and offset temperatures were identified as the point at which the peak begins to emerge above the baseline or returns to the baseline, respectively.
Ideal phase diagrams were constructed as described by Mabrey and Sturtevant (1976), with the following equations [22]:
| (1) |
where the superscripts (l) and (s) for a given mol fraction (X) refer to the liquidus and solidus curves, respectively. The quantities α and β are defined for a given temperatureT as:
| (2) |
where ΔHA and ΔHB are the enthalpy of the pure lipids A and B, and TA and TB are their absolute transition temperatures [22].
Construction of the phase diagram from experimental data required determination of the onset and completion temperatures for each deconvoluted peak. In Figure 1, we show how these temperatures were determined. All data reported are from 2–4 independent measurements and are plotted as the average ± S.E.
Results
SM/16:0-18:1PE phase behavior
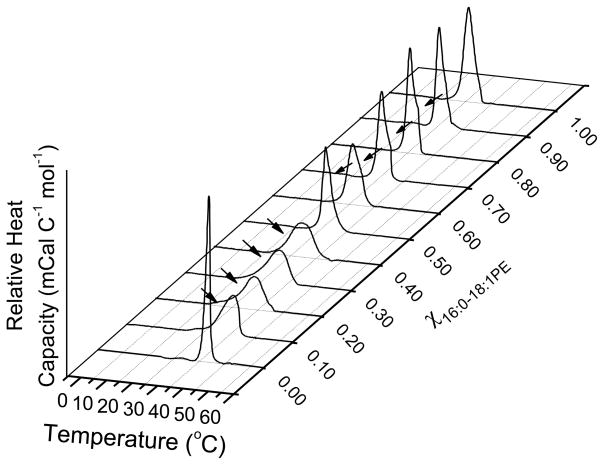
We utilized DSC to first investigate the phase behavior of SM/16:0-18:1PE mixtures. Figure 2A shows cooling scans for SM/16:0-18:1PE with increasing mol fraction of 16:0-18:1PE (χPE). With the addition of 0.1 to 0.4 mol fraction 16:0-18:1PE, we find a single transition peak that is asymmetric towards the low temperature side (indicated by an arrow) and that we interpret in terms of two overlapping transitions. In the presence of 0.5 to 0.8 mol fraction 16:0-18:1PE, we observe a single asymmetric transition peak with a shoulder on the high temperature side (indicated by an arrow) that we interpret as the presence of two components. We deconvoluted the measured transition into two transitions that, based on the Tms for the pure lipid components, we ascribe to a 16:0-18:1PE-rich phase melting at lower temperature and to a SM-rich phase melting at higher temperature. For 0.9 mol fraction 16:0-18:1PE, an obvious shoulder is no longer apparent in the transition that we assign to the melting of a single 16:0-18:1PE-rich phase.
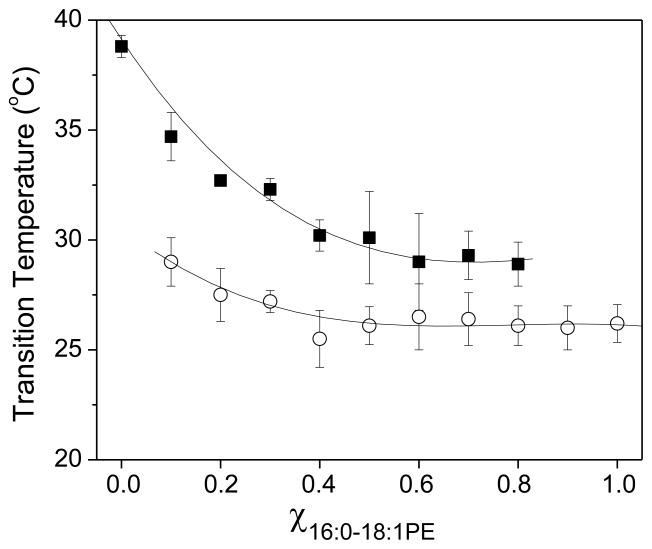
Figure 2. Phase behavior of SM/16:0-18:1PE.
(A) DSC cooling scans recorded for SM with increasing mol fraction 16:0-18:1PE. Arrows indicate the presence of a second phase transition. The data are a single set of experiments representative of 2–4 independent measurements. (B) Phase transition temperature (average ± S.E) for the 16:0-18:1PE-rich (solid squares) and SM-rich (open circles) phases as a function of mol fraction of 16:0-18:1PE. The solid lines are sigmoidal fits to the data.
In Figure 2B, Tm values measured from the DSC scans in Figure 2A for the 16:0-18:1PE-rich and SM-rich phases are plotted against mol fraction of 16:0-18:1PE. The first detectable phase transition attributed to a 16:0-18:1PE-rich phase emerges at χPE = 0.1 and the Tms for this phase decrease up to mol fraction 0.4 and then remain constant with further increase in χPE (Fig. 2B, open circles). For the transition attributed to a SM-rich phase, Tms decrease in an approximately linear fashion up to χPE = 0.4 (Fig. 2B, closed squares). Between χPE = 0.4 to 0.8, the Tms for the SM-rich phase show little change. The transition temperatures measured for pure 16:0-18:1PE and SM bilayers are, respectively, ~26 °C and ~39 °C, consistent with previous reports [12,13].
SM/16:0-22:6PE phase behavior
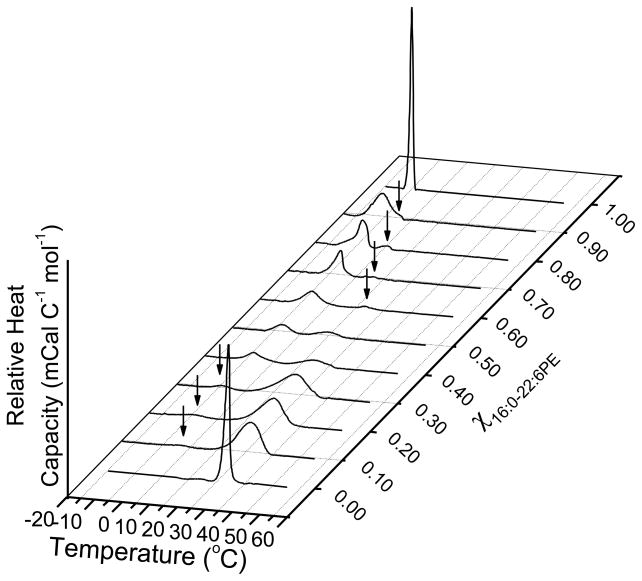
DSC cooling scans recorded for mixtures of SM/16:0-22:6PE mixtures in aqueous dispersion with increasing mol fraction of 16:0-22:6PE are shown in Figure 3A. They illustrate that because the transition temperature for SM and PE differs more when the phospholipid is polyunsaturated, separation into SM- and PE-rich domains is easier to discern with SM/16:0-22:6PE than with SM/16:0-18:1PE (compare Fig. 3A to Fig. 2A). Well resolved bimodal transitions emerge upon the addition of 0.1 mol fraction 16:0-22:6PE and continue up to a mol fraction of 0.8. Although there is subsequently only a single peak at χPE = 0.9, the presence of a shoulder on the high temperature side indicates that the transition is still bimodal. We ascribe the transitions at lower and higher temperature to the melting of 16:0-22:6PE-rich and SM-rich phases, respectively. Arrows in Figure 3A indicate co-existence of two transitions. Deconvolutions were not required for 16:0-22:6PE/SM mixtures since two distinct transitions could be observed without overlap, with the exception of χPE = 0.9.
Figure 3. Phase behavior of SM/16:0-22:6PE.
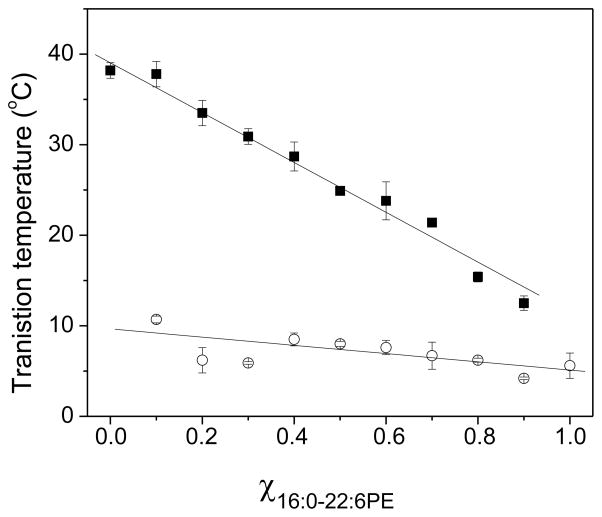
(A) DSC cooling scans recorded for SM with increasing mol fraction 16:0-22:6PE. Arrows indicate the presence of a second phase transition. The data are a single set of experiments representative of 2–4 independent measurements. (B) Phase transition temperature (average ± S.E) for the 16:0-22:6PE-rich (solid squares) and SM-rich (open circles) phases as a function of mol fraction of 16:0-22:6PE. The solid lines are linear fits to the data.
Figure 3B is a plot of Tms obtained for the 16:0-22:6PE-rich and SM-rich phases from the DSC scans for SM/16:0-22:6PE mixtures in Figure 3A versus mol fraction of 16:0-22:6PE. The transition temperature for the 16:0-22:6PE-rich phase (Fig. 3B, open circles) remains relatively constant, similar to the 16:0-18:1PE-rich phase (Fig. 2B, open circles) in SM/16:0-18:1PE mixtures. For the SM-rich phase (Fig. 3B, filled squares), the Tms decrease linearly with increasing mol fraction 16:0-22:6PE. This trend is different from the observation made for the transition temperature of the SM-rich phase in SM/16:0-18:1PE mixtures that show an abrupt change in slope at χPE = 0.4.
Phase diagrams reveal 16:0-22:6PE/SM deviates from ideal mixing more than 16:0-18:1PE/SM
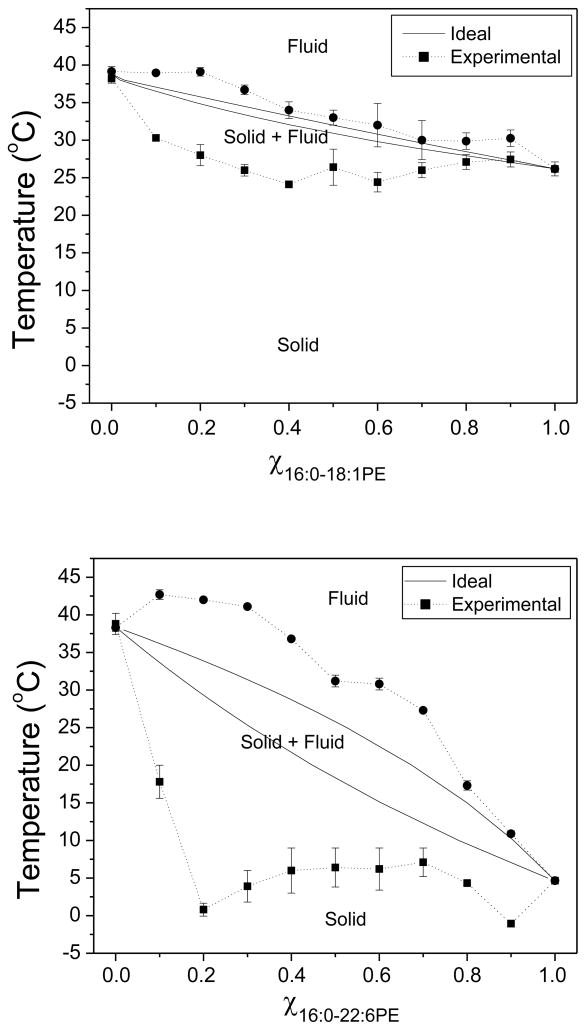
Binary temperature-composition phase diagrams constructed from the data presented in Figures 2 and 3 are shown in Figure 4 for SM/16:0-18:1PE (top) and SM/16:0-22:6PE (bottom). The experimental solidus and fluidus boundaries (dotted lines) were determined respectively from the onset and completion temperatures of the deconvoluted peaks in the DSC curves (Materials and Methods), while ideal mixing (solid lines) was determined as described by Mabrey and Sturtevant [22].
Figure 4. Phase diagrams for SM/16:0-18:1PE (top panel) and SM/16:0-22:6PE (bottom panel).
The ideal solidus and fluidus solid lines were calculated with equations 1 and 2, as described in the Materials and Methods. The experimental solidus and fluidus dashed lines were generated from the temperature of the onset and completion of the transitions in DSC scans. Data points are an average ± S.E from 2–4 independent measurements. The solid and fluid phases are indicated in each phase diagram.
The phase diagrams illustrate that neither 16:0-18:1PE nor 16:0-22:6PE mixes ideally with SM. The temperature range over which solid and fluid phases coexist in the two mixed membrane systems identified experimentally exceeds the relatively narrow differential in temperature between solidus and liquidus lines that were calculated on the basis of ideal mixing. However, it is clear that the deviation from ideal behavior is accentuated for 16:0-22:6PE relative to 16:0-18:1PE. The solid to solid + fluid (mixed state) transition for SM/16:0-18:1PE and SM/16:0-22:6PE generally lies below the solidus line, but 16:0-22:6PE depresses the temperature more and the smaller depression in temperature seen with 16:0-18:1PE disappears at χPE ≥ 0.8. The solid + fluid to fluid transition for both systems also generally lies above the liquidus line, but 16:0-22:6PE elevates the temperature more and the smaller elevation in temperature seen with 16:0-18:1PE is comparable to or only slightly bigger than experimental uncertainty. Overall, 16:0-18:1PE and 16:0-22:6PE exhibit immiscibility with SM, which is more pronounced with the DHA-containing phospholipid.
Discussion
In a series of earlier reports, using several biophysical methods, we have proposed a model for one possible molecular mode of action for DHA [12,13,15,23]. The proposed model explains how DHA modifies membrane structure as a mechanism to initiate changes in protein activity and cellular function [6,9]. In this model, DHA-containing phospholipids phase separate to form liquid disordered domains, depleted in Chol, that are compositionally and organizationally distinct from liquid ordered lipid raft domains enriched in sphingolipids and Chol [10]. From a mechanistic perspective, we have demonstrated that formation of DHA-rich/Chol-poor domains is driven by steric incompatibility between the highly disordered DHA acyl chain and the rigid steroid moiety of Chol [19]. PE, which incorporates dietary DHA more than PC, has been the focus of much of our work [11]. A central question that has remained unanswered in our model system is: what is the molecular relationship between the heteroacid DHA-containing PE and SM?
Resolving contradictory data on SM-PE molecular interactions
Our previous studies compared the molecular interactions of 16:0-22:6PE vs. 16:0-18:1PE with SM only at equimolar concentration [12,13,15]. Initially, we interpreted our data to conclude that 16:0-22:6PE, but not 16:0-18:1PE, phase separated from SM in the absence of Chol [21]. This assessment reflected the difficulty in recognizing that the DSC peak for SM/16:0-18:1PE in 1:1 mol mixture consists of two closely overlapping transitions (Tm ~39 °C and ~26 °C for pure SM and 16:0-18:1PE, respectively). This experimental problem was not encountered in the analysis of the DSC scan observed for equimolar SM/16:0-22:6PE where the two monotectic transitions occur at very different temperatures (Tm ~ 6 °C for pure 16:0-22:6 PE). In contrast, and in agreement with the current work, our recent 2H NMR spectroscopy experiments determined that both phospholipids could indeed phase separate from SM [12]. In these studies, analogs of PE ([2H31]16:0-22:6PE or [2H31]16:0-18:1PE) with a perdeuterated sn-1 chain and SM ([2H31]-N-palmitoylsphingomyelin, [2H31]16:0SM) with a perdeuterated amide-linked acyl chain were employed to probe the molecular organization of each lipid in PE/SM (1:1 mol) mixtures [12]. The smaller value of average order parameters S̄CD that were derived from spectra recorded at 35 °C for [2H31]16:0-22:6PE vs. [2H31]16:0SM and [2H31]16:0-18:1PE vs. [2H31]16:0SM in their respective mixed systems was attributed to the formation of PE-rich, characterized by lower order, and SM-rich, characterized by higher order, domains in both DHA- and OA-containing membranes. Physical insight into the molecular architecture of the domains was also deduced from the NMR data. A bilayer thickness that is 2–3 Å less for PE-rich than SM-rich domains was estimated on the basis of the average length 〈L〉 for [2H31]16:0 chains calculated from the S̄CD values. Because only a single spectral component is discernible for [2H31]16:0-22:6PE, [2H31]16:0-18:1PE or [2H31]16:0SM in the spectra recorded with SM/PE (1:1 mol) mixtures, despite incomplete demixing, the domains must be small enough for lipids to laterally diffuse between them on the NMR timescale. An upper limit of <200 Å was then assigned to the size on the basis of the difference in average quadrupolar splitting in the domains [12].
The purpose of the current study was to further elucidate the relative ability of DHA- vs. OA- (control) containing phospholipids to phase separate from SM. To accomplish this objective we extend our earlier work performed on PE and SM in only equimolar ratio to a wide concentration range.
Phase diagrams
The experimental phase diagrams plotted in Figure 4 show that although neither 16:0-18:1PE nor 16:0-22:6PE mix ideally with SM, the monounsaturated OA-containing PE is more miscible than the polyunsaturated DHA-containing PE when compared to ideal behavior. The phase diagrams were constructed from DSC scans by determining the temperature at which a transition peak emerges above and returns to the baseline. An alternative approach is to determine the temperature at which an asymptotic line to either side of the peak intersects the baseline. Employing this approach provides essentially the same results as shown in Figure 4 (data not shown). The only difference is a small shift in the temperature values but does not affect our appraisal of the difference in miscibility between 16:0-18:1PE vs. 16:0-22:6PE with SM.
The plots of Tm against χPE for SM/16:0-18:1PE and SM/16:0-22:6PE mixtures in Figures 2B and 3B, respectively, demonstrate a significant difference in behavior for OA- vs. DHA-containing systems. In SM/16:0-18:1PE, Tm for the SM-rich phase decreases approximately linearly with increasing amount of PE until χPE = 0.4 and then remains virtually constant with higher concentration (Fig. 2B). In SM/16:0-22:6PE, by contrast, Tm for the SM-rich phase falls in linear fashion with increasing amount of PE throughout the entire range of concentration (Fig. 3B). The variation in Tm for the PE-rich phase is small in comparison for both systems. Our interpretation is that 16:0-18:1PE is more readily accumulated into SM-rich domains than 16:0-22:6PE with its highly disordered DHA chain. Whereas the effect on Tm for the SM-rich phase in the mixed membrane levels off around χPE = 0.4 with the OA-containing PE, the corresponding concentration is not reached with the DHA-containing PE. An alternative view is that greater phase separation is apparent in SM/16:0-22:6PE because the difference in transition temperature for the individual lipids is bigger. Separate transition peaks for PE- and SM-rich phase are then resolved in the DHA-containing mixed membrane (monotectic behavior) (Fig. 3A), like in the pioneering DSC studies of binary lipid systems published by Demel [24,25]. In SM/16:0-18:1PE, the transition temperature for each lipid is much closer and overlapping transitions (non-monotectic behavior) that require deconvolution are observed (Fig. 2A).
Phase separation between PE and SM must be driven by unfavorable interactions between the lipid head groups and/or between the acyl chains. The head group of PE is small and complements the larger head group of SM, promoting close contact between the two lipids. Such a situation is similar to what is observed with cholesterol and SM [26]. Interactions between the rigid steroid moiety and the ordered saturated acyl chains of SM are favorable, and the sterol phase separates with SM into lipid rafts. However, the high disorder of the DHA chain makes interaction with SM much more difficult for 16:0-22:6PE, thus driving phase separation. OA is less disordered than DHA, thus reducing the tendency for 16:018:1PE to separate away from SM.
The presence of discontinuities in the liquidus and solidus curves in the phase diagrams constructed, particularly for SM/16:0-22:6PE, is noted (Fig. 4). Their origin is not known. Models invoking the regular distribution of cholesterol in superlattices in PC bilayers have been put forward on the basis of kinks or dips in the intensity recorded with fluorescent probes at critical sterol concentrations [27,28]. Similar evidence that superlattice arrangements exist for PE in PC/PE membranes has also been published [29].
Physiological implications
We conclude that 16:0-22:6PE has a greater tendency to phase separate from SM than does 16:0-18:1PE. The tremendously high disorder possessed by DHA chains is responsible. The polyunsaturated chain rapidly isomerizes through its entire conformational space within 50 ns [30] and pushes away ordered SM molecules. Based on our previous findings, phase separation of DHA-containing PE away from SM is further enhanced upon the addition of Chol [12,13,15]. The aversion the sterol has for DHA, but not OA, is the reason. As a result, DHA-rich/Chol-poor domains form, which according to our model, provide an environment that can change the lateral organization and/or conformation of proteins. Indeed, our in vitro studies have shown that DHA-containing phospholipids can modify the conformation of the major histocompatibility complex (MHC) class I protein [31].
Very recent cell culture and ex vivo studies highlight the physiological relevance of studying the relationship between DHA-containing phospholipids and their influence on lipid raft organization. For instance, the Shaikh laboratory recently showed that DHA, but not eicosapentaenoic acid (EPA), diminished lipid raft clustering and increased raft size in EL4 cells, which modified MHC class I lateral organization [32]. The study suggested that changes in lipid raft organization was driven by the formation of nanometer scale DHA-rich domains [32]. Similarly, others have also shown that DHA-containing phospholipids modify lipid raft organization and subsequently the lateral organization of several proteins of CD4+ T cells and breast cancer cells [33–37]. This has functional consequences for suppressing the activation of T cells associated with inflammation or inducing apoptosis of breast cancer cells [34,35].
Concluding remarks
Our study shows that both 16:0-18:1PE and 16:0-22:6PE phase separate from SM; however, 16:0-22:6PE displays greater non-ideal mixing with SM than 16:0-18:1PE over a wide range of concentrations. The findings are consistent with our model that shows DHA has an important role in triggering phase separation into SM/Chol-rich raft and DHA-rich/Chol-poor non-raft domains. Future studies will focus on the role of DHA in modifying protein conformation and/or lateral organization, which we predict will be modified in response to the formation of DHA-rich non-raft domains.
Footnotes
Publisher's Disclaimer: This is a PDF file of an unedited manuscript that has been accepted for publication. As a service to our customers we are providing this early version of the manuscript. The manuscript will undergo copyediting, typesetting, and review of the resulting proof before it is published in its final citable form. Please note that during the production process errors may be discovered which could affect the content, and all legal disclaimers that apply to the journal pertain.
References
- 1.Moghadasian MH. Advances in dietary enrichment with n-3 fatty acids. Crit Rev Food Sci Nutr. 2008;48:402–410. doi: 10.1080/10408390701424303. [DOI] [PubMed] [Google Scholar]
- 2.Harris WS, Mozaffarian D, Lefevre M, Toner CD, Colombo J, Cunnane SC, Holden JM, Klurfeld DM, Morris MC, Whelan J. Towards establishing dietary reference intakes for eicosapentaenoic and docosahexaenoic acids. J Nutr. 2009;139:804S–819. doi: 10.3945/jn.108.101329. [DOI] [PMC free article] [PubMed] [Google Scholar]
- 3.Calder PC. Immunomodulation by omega-3 fatty acids. Prost Leuk Essent Fatty Acids. 2007;77:327–335. doi: 10.1016/j.plefa.2007.10.015. [DOI] [PubMed] [Google Scholar]
- 4.Calder PC. n-3 Polyunsaturated fatty acids, inflammation, and inflammatory diseases. Am J Clin Nutr. 2006;83:S1505–1519S. doi: 10.1093/ajcn/83.6.1505S. [DOI] [PubMed] [Google Scholar]
- 5.Chapkin RS, Wang N, Fan Y, Lupton JR, Prior IA. Docosahexaenoic acid alters the size and distribution of cell surface microdomains. Biochim Biophys Acta. 2008;1778:466–471. doi: 10.1016/j.bbamem.2007.11.003. [DOI] [PMC free article] [PubMed] [Google Scholar]
- 6.Shaikh SR, Edidin M. Polyunsaturated fatty acids, membrane organization, T cells, and antigen presentation. Am J Clin Nutr. 2006;84:1277–1289. doi: 10.1093/ajcn/84.6.1277. [DOI] [PubMed] [Google Scholar]
- 7.Carrillo-Tripp M, Feller SE. Evidence for a mechanism by which omega-3 polyunsaturated lipids may affect membrane protein function. Biochemistry. 2005;44:10164–10169. doi: 10.1021/bi050822e. [DOI] [PubMed] [Google Scholar]
- 8.Feller SE, Gawrisch K. Properties of docosahexaenoic-acid-containing lipids and their influence on the function of rhodopsin. Curr Opin Struct Biol. 2005;15:416–422. doi: 10.1016/j.sbi.2005.07.002. [DOI] [PubMed] [Google Scholar]
- 9.Wassall SR, Stillwell W. Docosahexaenoic acid domains: the ultimate non-raft membrane domain. Chem Phys Lipids. 2008;153:55–63. doi: 10.1016/j.chemphyslip.2008.02.010. [DOI] [PubMed] [Google Scholar]
- 10.Wassall SR, Stillwell W. Polyunsaturated fatty acid cholesterol interactions: Domain formation in membranes. Biochim Biophys Acta. 2009;1788:24–32. doi: 10.1016/j.bbamem.2008.10.011. [DOI] [PubMed] [Google Scholar]
- 11.Salem N, Jr, Kim H-Y, Yergey JA. Docosahexaenoic acid: membrane function and metabolism. New York: Academic Press; 1986. [Google Scholar]
- 12.Soni SP, LoCascio DS, Liu Y, Williams JA, Bittman R, Stillwell W, Wassall SR. Docosahexaenoic acid enhances segregation of lipids between raft and nonraft domains: 2H-NMR study. Biophys J. 2008;95:203–214. doi: 10.1529/biophysj.107.123612. [DOI] [PMC free article] [PubMed] [Google Scholar]
- 13.Shaikh SR, Dumaual AC, Castillo A, LoCascio D, Siddiqui RA, Stillwell W, Wassall SR. Oleic and docosahexaenoic acid differentially phase separate from lipid raft molecules: A comparative NMR, DSC, AFM, and detergent extraction study. Biophys J. 2004;87:1752–1766. doi: 10.1529/biophysj.104.044552. [DOI] [PMC free article] [PubMed] [Google Scholar]
- 14.Shaikh SR, Dumaual AC, LoCassio D, Siddiqui RA, Stillwell W. Acyl chain unsaturation in PEs modulates phase separation from lipid raft molecules. Biochem Biophy Res Comm. 2003;311:793–796. doi: 10.1016/j.bbrc.2003.10.057. [DOI] [PubMed] [Google Scholar]
- 15.Shaikh SR, Cherezov V, Caffrey M, Stillwell W, Wassall SR. Interaction of cholesterol with a docosahexaenoic acid-containing phosphatidylethanolamine: trigger for microdomain/raft formation? Biochemistry. 2003;42:12028–12037. doi: 10.1021/bi034931+. [DOI] [PubMed] [Google Scholar]
- 16.Edidin M. The state of lipid rafts: From model membranes to cells. Ann Rev Biophys Biomol Struct. 2003;32:257–283. doi: 10.1146/annurev.biophys.32.110601.142439. [DOI] [PubMed] [Google Scholar]
- 17.Shaikh SR, Edidin MA. Membranes are not just rafts. Chem Phys Lipids. 2006;144:1–3. doi: 10.1016/j.chemphyslip.2006.06.017. [DOI] [PubMed] [Google Scholar]
- 18.Pike LJ. Rafts defined: a report on the Keystone symposium on lipid rafts and cell function. J Lipid Res. 2006;47:1597–1598. doi: 10.1194/jlr.E600002-JLR200. [DOI] [PubMed] [Google Scholar]
- 19.Shaikh SR, Cherezov V, Caffrey M, Soni SP, LoCascio D, Stillwell W, Wassall SR. Molecular organization of cholesterol in unsaturated phosphatidylethanolamines: X-ray diffraction and solid state 2H NMR reveal differences with phosphatidylcholines. J Am Chem Soc. 2006;128:5375–5383. doi: 10.1021/ja057949b. [DOI] [PubMed] [Google Scholar]
- 20.Pare C, Lafleur M. Polymorphism of POPE/cholesterol system: A 2H nuclear magnetic resonance and infrared spectroscopic investigation. Biophys J. 1998;74:899–909. doi: 10.1016/S0006-3495(98)74013-5. [DOI] [PMC free article] [PubMed] [Google Scholar]
- 21.Shaikh SR, Brzustowicz MR, Gustafson N, Stillwell W, Wassall SR. Monounsaturated PE does not phase-separate from the lipid raft molecules sphingomyelin and cholesterol: role for polyunsaturation? Biochemistry. 2002;41:10593–10602. doi: 10.1021/bi025712b. [DOI] [PubMed] [Google Scholar]
- 22.Mabrey S, Sturtevant JM. Investigation of phase transitions of lipids and lipid mixtures by sensitivity differential scanning calorimetry. Proc Natl Acad Sci USA. 1976;73:3862–3866. doi: 10.1073/pnas.73.11.3862. [DOI] [PMC free article] [PubMed] [Google Scholar]
- 23.Brzustowicz MR, Cherezov V, Zerouga M, Caffrey M, Stillwell W, Wassall SR. Controlling membrane cholesterol content. A role for polyunsaturated (docosahexaenoate) phospholipids. Biochemistry. 2002;41:12509–12519. doi: 10.1021/bi0262808. [DOI] [PubMed] [Google Scholar]
- 24.van Dijk PWM, de Kruijff B, van Deenen LLM, de Gier J, Demel RA. The preference of cholesterol for phosphatidylcholine in mixed phosphatidylcholine-phosphatidylethanolamine. Biochim Biophys Acta. 1976;455:576–587. doi: 10.1016/0005-2736(76)90326-6. [DOI] [PubMed] [Google Scholar]
- 25.Demel RA, Jansen JW, van Dijk PW, van Deenen LLM. The interaction of cholesterol with different classes of phospholipids. Biochim Biophys Acta. 1977;465:1–10. doi: 10.1016/0005-2736(77)90350-9. [DOI] [PubMed] [Google Scholar]
- 26.de Almeida RFM, Fedorov A, Prieto M. Sphingomyelin/phosphatidylcholine/cholesterol phase diagram: Boundaries and composition of lipid rafts. Biophys J. 2003;85:2406–2416. doi: 10.1016/s0006-3495(03)74664-5. [DOI] [PMC free article] [PubMed] [Google Scholar]
- 27.Chong PL-G. Evidence for the regular distribution of sterols in liquid crystalline phosphatidylcholine bilayers. Proc Natl Acad Sci USA. 1994;91:10069–10073. doi: 10.1073/pnas.91.21.10069. [DOI] [PMC free article] [PubMed] [Google Scholar]
- 28.Virtanen JA, Ruanala M, Vauhkonen M, Somerhaju P. Lateral organization of liquid-crystalline cholesterol-dimyristoylphosphatidylcholine bilayers. Evidence for domains with hexagonal and centered rectangular cholesterol superlattices. Biochemistry. 1995;34:11568–11581. doi: 10.1021/bi00036a033. [DOI] [PubMed] [Google Scholar]
- 29.Cheng KH, Ruonala M, Virtanen J, Somerharjut P. Evidence for superlattice arrangements in fluid phosphatidylcholine/phosphatidylethanolamine bilayers. Biophys J. 1997;73:1967–1976. doi: 10.1016/S0006-3495(97)78227-4. [DOI] [PMC free article] [PubMed] [Google Scholar]
- 30.Soubias O, Gawrisch K. Docosahexaenoyl chains isomerize on the sub-nanosecond time scale. J Am Chem Soc. 2007;129:6678–6679. doi: 10.1021/ja068856c. [DOI] [PubMed] [Google Scholar]
- 31.Jenski LJ, Nanda PK, Jiricko P, Stillwell W. Docosahexaenoic acid-containing phosphatidylcholine affects the binding of monoclonal antibodies to purified Kb reconstituted into liposomes. Biochim Biophys Acta. 2000;1467:293–306. doi: 10.1016/s0005-2736(00)00227-3. [DOI] [PubMed] [Google Scholar]
- 32.Shaikh SR, Rockett BD, Salameh M, Carraway K. Docosahexaenoic acid modifies the clustering and size of lipid rafts and the lateral organization and surface expression of MHC class I of EL4 cells. J Nutr. 2009;139:1632–1639. doi: 10.3945/jn.109.108720. [DOI] [PubMed] [Google Scholar]
- 33.Ruth MR, Proctor SD, Field CJ. Feeding long-chain n-3 polyunsaturated fatty acids to obese leptin receptor-deficient JCR:LA-cp rats modifies immune function and lipid-raft fatty acid composition. Br J Nutr. 2009;101:1341–1350. doi: 10.1017/S0007114508076277. [DOI] [PubMed] [Google Scholar]
- 34.Schley PD, Brindley DN, Field CJ. (n-3) PUFA alter raft lipid composition and decrease epidermal growth factor receptor levels in lipid rafts of human breast cancer cells. J Nutr. 2007;137:548–553. doi: 10.1093/jn/137.3.548. [DOI] [PubMed] [Google Scholar]
- 35.Kim W, Fan Y, Barhoumi R, Smith R, McMurray DN, Chapkin RS. n-3 Polyunsaturated fatty acids suppress the localization and activation of signaling proteins at the immunological synapse in murine CD4+ T cells by affecting lipid raft formation. J Immunol. 2008;181:6236–6243. doi: 10.4049/jimmunol.181.9.6236. [DOI] [PMC free article] [PubMed] [Google Scholar]
- 36.Ma DWL, Seo J, Davidson LA, Callaway ES, Fan Y, Lupton JR, Chapkin RS. n-3 PUFA alter caveolae lipid composition and resident protein localization in mouse colon. FASEB J. 2004;18:1040–1042. doi: 10.1096/fj.03-1430fje. [DOI] [PubMed] [Google Scholar]
- 37.Fan Y, McMurray DN, Ly LH, Chapkin RS. Dietary (n-3) polyunsaturated fatty acids remodel mouse T-cell lipid rafts. J Nutr. 2003;133:1913–1920. doi: 10.1093/jn/133.6.1913. [DOI] [PubMed] [Google Scholar]


