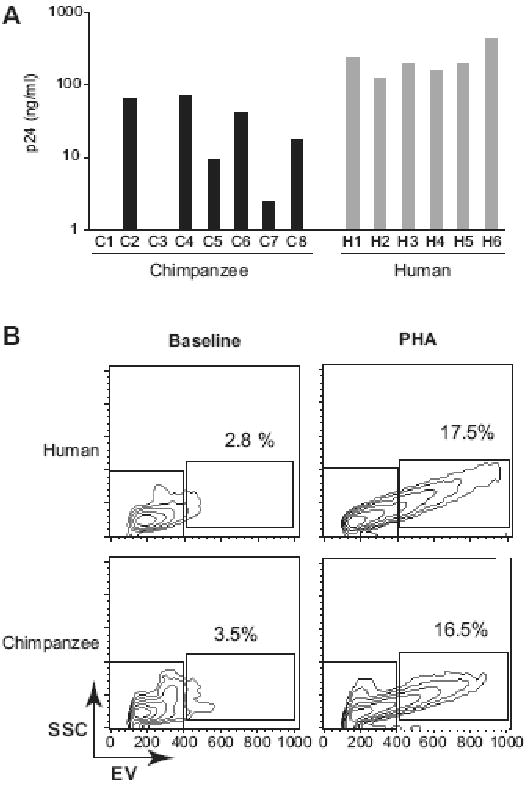
Figure 1. HIV-1 SG3 replication in PHA-activated chimpanzee and human CD4+ lymphocytes.

A. CD4+ lymphocytes from eight chimpanzees (C1 to C8) and six human (H1 to H6) donors were activated with PHA and tested for their ability to support HIV-1 SG3 replication. Infections were initiated at a multiplicity of infection (MOI) of 0.1. Virus replication was monitored by quantifying the p24 viral antigen in the culture supernatants on day 8 post-infection (y axis, nanograms of p24 per ml of culture supernatant). The grey box indicate the cutoff (1ng/ml) below which replication is considered negative. B. Representative flow cytometric density plots (x-axis, electronic volume; y axis, side scatter) of CD4+ lymphocytes at baseline (left panels) and 48 hours post PHA activation (right panels) for human (top panels) and chimpanzee (lower panels). The percentage of activated cells located in gate R2 are indicated.
