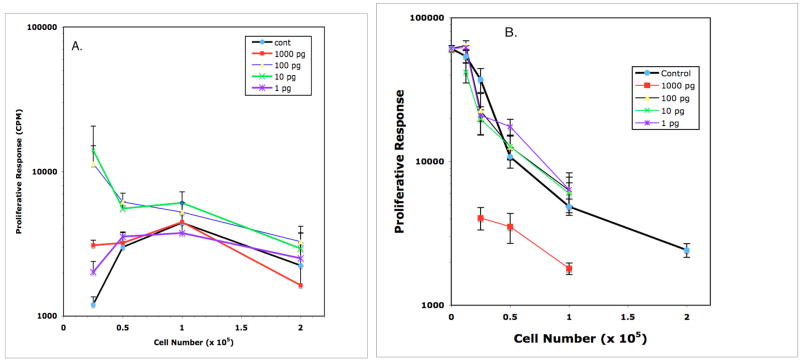
Figure 5.
Effect of IL-1α on Mls presentation by DBA/2J PerC cells (panel A) and PerC Mφ-suppressed DBA/2J SP cells (panel B). In Panel A, the T cell response to Mls was enhanced at 0.25 × 10⁵ PerC cells/well by all concentrations of IL-1α tested and at 0.5 × 10⁵ PerC cells/well by 10 and 100 pg/ml of IL-1α (p<.05).

