

Abstract
Word production is a complex multistage process linking conceptual representations, lexical entries, phonological forms and articulation. Previous studies have revealed a network of predominantly left‐lateralized brain regions supporting this process, but many details regarding the precise functions of different nodes in this network remain unclear. To better delineate the functions of regions involved in word production, we used event‐related functional magnetic resonance imaging (fMRI) to identify brain areas where blood oxygen level‐dependent (BOLD) responses to overt picture naming were modulated by three psycholinguistic variables: concept familiarity, word frequency, and word length, and one behavioral variable: reaction time. Each of these variables has been suggested by prior studies to be associated with different aspects of word production. Processing of less familiar concepts was associated with greater BOLD responses in bilateral occipitotemporal regions, reflecting visual processing and conceptual preparation. Lower frequency words produced greater BOLD signal in left inferior temporal cortex and the left temporoparietal junction, suggesting involvement of these regions in lexical selection and retrieval and encoding of phonological codes. Word length was positively correlated with signal intensity in Heschl's gyrus bilaterally, extending into the mid‐superior temporal gyrus (STG) and sulcus (STS) in the left hemisphere. The left mid‐STS site was also modulated by reaction time, suggesting a role in the storage of lexical phonological codes. Hum Brain Mapp, 2009. © 2009 Wiley‐Liss, Inc.
Keywords: functional MRI, event‐related, lexical access
INTRODUCTION
Word production is typically unconscious and effortless, yet this effortlessness belies a complex multistage process. In one current model [Levelt et al.,1999] (see Fig. 1), conceptual preparation leads to activation of a lexical concept, which is then linked to a lemma, an abstract lexical entry containing syntactic but no phonological information. This is followed by retrieval of a phonological word form, which is then encoded at progressively more concrete levels: phonological (e.g. syllabification), then phonetic (e.g. aspiration), leading finally to a motor program for articulation.
Figure 1.
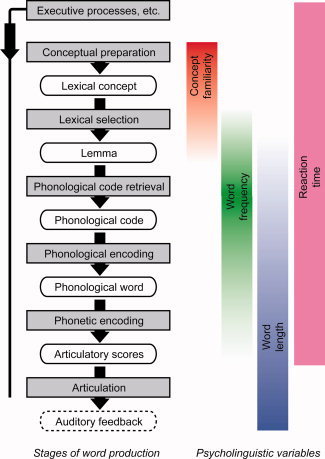
Stages of word production, based on the lexical access model of Levelt et al. [1999], and potential relationships between stages and psycholinguistic variables. The fading in and out of the colors for the variables reflects our view that variables do not have known one‐to‐one relationships with particular stages. Other models are similar in terms of the stages assumed [e.g. Dell et al.,1997].
The network of brain regions involved in word production has been outlined by a large body of neuroimaging and neuropsychological studies, mostly using picture naming paradigms [Indefrey and Levelt,2004; Price et al.,2005]. This work has suggested that conceptual preparation relies on distributed brain areas depending on the particular concept; in the context of picture naming, occipital and inferior temporal object processing areas are key [Price et al.,2005]. The loci of lemma selection and phonological retrieval are less well understood and both processes have been associated with a wide range of temporal lobe regions [Damasio et al.,1996; Graves et al.,2007; Indefrey and Levelt,2004; Okada and Hickok,2006]. Later phonological encoding processes such as syllabification have been linked with the posterior inferior frontal gyrus (IFG), and articulation with primary motor cortex [Indefrey and Levelt,2004].
To better delineate the roles of various regions involved in word production, we used fMRI to identify brain regions where signal change during picture naming was correlated with any of three psycholinguistic variables: concept familiarity, word frequency, and word length, and one behavioral variable: reaction time (RT). Each of these variables has been associated with different aspects of word production (see Fig. 1). Concept familiarity relates to prelinguistic semantic processes [Lambon Ralph et al.,1998], i.e. conceptual preparation leading to a lexical concept. Word frequency is thought to primarily reflect retrieval of phonological codes, though there may also be frequency effects at other levels, such as lemma retrieval [Jescheniak and Levelt,1994]. Word length could operate at any level from phonological retrieval onward, including articulation. RT could identify regions involved in any stage of lexical access, as well as executive functions, but not motor or perceptual process such as articulation or hearing one's own voice.
We assume that any variable that affects the processing time of a given stage will modulate neural activity, and hence signal, in brain regions associated with that stage. Thus, correlations between psycholinguistic variables and brain activity can constrain neuroanatomical models of language processes. Although we frame our study in terms of Levelt et al.'s [1999] model of lexical access (see Fig. 1), we are not committed to all of the specific theoretical claims of this particular model (e.g. strictly feed‐forward processing). We assume only that lexical access is a staged process with stages to some extent ordered in time [Hauk et al.,2006; Indefrey and Levelt,2004]. Our findings should be equally applicable to other staged models with different architectures [e.g. Dell et al.,1997].
Because the four variables of interest are correlated with one another, we used two different approaches to constructing linear models. In our main analysis, we entered all four variables into the same model. This conservative approach implies that statistical inferences regarding each variable reflect the contribution of that variable above and beyond any of the others. However, it is possible that regions which are modulated by a given variable may be overlooked with this approach if they are also modulated by another variable with which the first variable is correlated. To ensure that no such regions were missed, we also performed a secondary set of analyses in which each variable was entered alone into a separate linear model. This approach is more liberal, because correlated regions may not necessarily be modulated by the variable in question, but may instead reflect the influence of other variables correlated with it.
A previous study succeeded in identifying neural correlates of word frequency and other variables in picture naming [Graves et al.,2007] using the more liberal approach of entering each variable singly into separate linear models, along with masking and conjunction analyses aimed at examining the contributions of correlated variables. The present study confirms some of the basic findings of this earlier study, and extends it by modeling all variables simultaneously, and also by examining correlations with RT, which allows the identification of regions associated with executive and attentional processes [Binder et al.,2004,2005].
MATERIALS AND METHODS
Participants
Twelve native English speakers participated in the fMRI study. All participants were right handed, the male‐to‐female ratio was 7:5, and their mean age was 26.4 (range: 20–44). All participants gave written informed consent and were compensated for their participation, and the study was approved by the Institutional Review Board of the University of California, Irvine.
Experimental Design
Participants lay supine in the scanner and viewed a screen via a mirror. They were instructed to fixate on a crosshair, and during the functional runs, pictures and scrambled pictures were presented centered on this crosshair. Subjects were instructed to name each picture out loud (moving their head and jaw as little as possible), and to do nothing in response to the scrambled pictures. Responses were recorded over the scanner noise, which was later filtered out, and analyzed for RT and accuracy.
There were three functional runs per subject, each 400 seconds in duration. During each run, subjects were presented with 55 pictures and seven scrambled pictures, in a rapid event‐related design. Each picture was presented for 2 seconds. Stimulus timing was optimized using a custom program in conjunction with the FMRISTAT program efficiency [Worsley et al.,2002]. The mean intertrial interval (from the offset of one picture to the onset of the next) was 4.3 seconds (range 1.5–13.3 seconds).
Stimuli and Behavioral Data
There were 165 pictures, taken from a behavioral picture naming study [Howard et al.,2006]. They were colored photographs of real objects taken from a variety of sources. Several examples are shown in Fig. 2a. There were five pictures in each of 24 semantic categories (e.g. birds, furniture, etc.), and 45 other miscellaneous items. Items were ordered such that each set of five semantically related items were presented relatively close to one another in the sequence, in order to examine effects of cumulative semantic inhibition [Brown,1981; Howard et al.,2006]. However, we did not find any brain areas where signal reflected serial position within each set of semantically related items, and so we do not report further on this manipulation.
Figure 2.
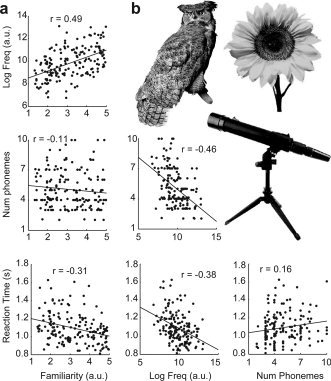
Picture stimuli. (a) Pairwise correlations between the four variables of interest: concept familiarity, word frequency, word length and reaction time. Best‐fit regression lines and correlation coefficients are shown. All correlations were significant except for that between familiarity and length. (b) Examples of the pictures. In the actual experiment, the pictures were presented in full color.
We quantified four variables of interest (concept familiarity, word frequency, word length and RT) and one covariate of no interest (visual complexity). Concept familiarity and visual complexity were calculated for each picture, whereas word frequency and word length were calculated for each name actually produced in the scanner (since some pictures did not elicit the same name from every subject). RT varied on a trial‐by‐trial basis.
Concept familiarity was determined for each picture in a prior norming study, closely following the procedure of Fiez and Tranel [1997] and Graves et al. [2007]. There were 37 participants ranging in age from 25 to 58 years (mean: 31.8). The study was performed online. Subjects were presented with a page containing the 165 pictures, and instructed to “rate each picture according to how usual or unusual the object is in your everyday realm of experience. In other words, the degree to which you come in contact with, or think about, the object.” These instructions are very similar to those provided in prior studies [Fiez and Tranel,1997]. Subjects used a 5‐point scale ranging from “very unfamiliar” to “very familiar.” The pattern of responses for each subject was examined to ensure that it correlated reasonably with other subjects' responses, to ensure task compliance. One subject was excluded because his responses were correlated negatively or not at all with those of other subjects. The familiarity ratings provided by the remaining 36 subjects in the norming study were averaged for each item to obtain a familiarity rating for that item.
Visual complexity was quantified as the size of the compressed jpeg image, an objective measure which has been validated [Szekely and Bates,2000] and used in previous imaging studies of picture naming [Graves et al.,2007]. Although this method seems satisfactory for factoring out a covariate of no interest, it is not sophisticated enough to justify reporting the neural correlates of this measure.
The remaining variables were quantified after responses had been recorded from subjects in the fMRI experiment. Responses were scored as correct if they were appropriate for the given picture, as there were many pictures for which the subjects did not all provide the same name. Word frequency, word length and RT were only calculated for correct items.
Word frequency was calculated using the Google search engine (http://www.google.com). Each picture name produced by one or more subjects was searched on English language pages only on the domain blogger.com, which contains mostly informal language. Use of a search engine allows frequency to be determined for compound words (e.g. “washing machine”), which are not included in most corpora. However, it is unlikely that the method of determining frequency has a major influence on the results; we calculated the correlation between logarithm of the frequency determined with Google and log frequency from the British National Corpus [Leech et al.,2001], and found a high correlation of r = 0.89. Logarithms were also used for all subsequent analyses, as is standard for word frequency.
Word length was quantified as the number of phonemes in each name produced. We also experimented with analyses using the length of the speech signal itself, measured manually from the recordings of speech in the scanner. This variable was highly correlated with number of phonemes (r = 0.77), and so these could not be simultaneously entered into the same models. Therefore, we decided to use number of phonemes only.
RTs (from the presentation of the picture to the onset of vocalization) for each trial were manually measured from the recordings of each subject's speech in the scanner.
Scrambled pictures were constructed as follows. An image was selected at random from the set of 165 pictures, and divided into a six by six grid of “tiles.” Then each tile which was at least 25% nonbackground was replaced by a random nonbackground tile from any other picture. This resulted in images which covered roughly the same parts of the visual field as the pictures, and were similar in terms of low‐level visual complexity, but did not comprise real objects. Scrambled pictures were used to identify brain regions responsive to low‐level visual features of the picture stimuli.
Image Acquisition
Image data were collected using a 3T Philips Achieva MRI scanner. For each of the three runs per subject, 205 functional T2*‐weighted echo‐planar images were acquired with the following parameters: 32 AC/PC‐aligned axial slices with sequential (bottom to top) acquisition; slice thickness = 3 mm with 1 mm gap; field of view = 230 mm; matrix 128 × 128; repetition time = 2 seconds, echo time = 30 ms, flip angle = 90°; no SENSE reduction. Additionally a T1‐weighted structural image was acquired for purposes of registration (150 sagittal slices; slice thickness = 1 mm; field of view = 240 mm; matrix 240 × 240; repetition time = 11 ms, echo time = 3.55 ms; flip angle = 18°; SENSE factor reduction 1.5 × 1.5).
Stimulus Presentation, Audio Recording and Processing
Visual stimuli were presented with MATLAB (Mathworks, Natick, MA), Cogent 2000, and Cogent Graphics (http://www.vislab.ucl.ac.uk/cogent.php). An IBM‐compatible PC was used to project stimuli onto a screen in the scanner room. The pictures subtended an average of 14° visual angle.
Subjects' responses were recorded with a scanner‐compatible optical microphone (Phone‐Or, Or‐Yehuda, Israel) and the digital audio editor Audacity (http://audacity.sourceforge.net). In the raw files, responses were not intelligible over the background scanner noise. We removed much of the scanner noise with a custom MATLAB program which fit a general linear model to each 2‐second period of audio, where the regressors consisted of audio from six adjacent 2‐second periods (three before and three after), shifted between −3 and 3 samples, i.e. there were a total of 42 regressors. Because surrounding periods contain the same scanner noise but no speech, these regressors remove scanner noise but not speech, leaving an analyzable speech signal in the residuals. Adjacent temporal periods were used for the reference because acoustic noise from the scanner can be affected by subject motion over time [Jung et al.,2005]. After processing the audio data, the words produced and the timing of their onsets were clearly audible. RTs and responses were manually determined for each trial using Audacity.
Image Processing
The functional data were preprocessed using tools from FMRIB Software Library (FSL) version 3.3 [Smith et al.,2004]. The first five volumes from each run were discarded to allow for T1 equilibrium effects. Brain extraction was performed with bet [Smith,2002]. Motion correction for small head movements was carried out with mcflirt [Jenkinson and Smith,2001]. Each image was aligned to the middle image of the middle run, and the three translation and three rotation parameters for each volume were saved. Then the images were smoothed with a Gaussian kernel (8 mm FWHM) with the program ip.
Each subject's representative functional image (the middle volume of the middle run) was linearly aligned to their anatomical image with flirt, using six degrees of freedom. Then each anatomical T1 image was aligned to the Montreal Neurological Institute (MNI) average of 152 brains using an affine transformation with 12 degrees of freedom. Later, these two transformations were concatenated and applied to statistical parameter maps for individual subjects to normalize them to MNI space.
Statistical Analysis
A general linear model was fit at each voxel using the fmrilm program from FMRISTAT (http://www.math.mcgill.ca/keith/fmristat; updated June 2, 2006) [Worsley et al.,2002].
Each functional run was analyzed independently, after motion correction but before any further registration. The design matrix contained one explanatory variable (EV) that encoded presentation of pictures or scrambled pictures (2‐second events timed to visual presentation) and another that encoded correct spoken responses (also 2‐second events timed to visual presentation). Note that we used picture presentation time rather than speech onset time under the assumption that we are modeling preparation of the response, which begins as soon as the picture is presented, as well as the response itself. These variables were thus identical for most trials, but they were dissociated on scrambled picture trials where there is no speech response. Trials where the picture was incorrectly named, or where the name provided was unintelligible, or where the RT was longer than 2 seconds, were modeled with another EV that was not examined further. Any superfluous speech events (e.g. comments on a missed trial) were also modeled with another EV but not examined further.
For the main analysis, the correct response EV was modulated by five additional variables which were orthogonal to it. These encoded concept familiarity, word frequency, word length, RT and visual complexity, as defined above. Each was normalized by subtracting the mean for the variable over that run, and dividing it by its standard deviation. For the secondary analysis, four separate models were also constructed where each normalized variable (except visual complexity) was entered alone.
All variables described so far were convolved with a hemodynamic response function modeled as a difference of two gamma functions. We reduced the poststimulus undershoot variable to 15% from the default value of 35%, since we observed little undershoot in preliminary analyses of our data. FMRISTAT does not require slice timing correction to be performed; rather, the convolved EVs are resampled at different points for each slice depending on its order in the acquisition sequence.
Contrasts were constructed to compare each EV with zero. Note that trials with pictures (and speech responses) were not explicitly compared with trials with scrambled pictures (and no speech responses). Instead, the presence of the latter in the model implied that common responses to visual processing would be modeled by the picture/scrambled picture EV, and not by the speech response EV.
A number of covariates of no interest were also included, which were not convolved with the hemodynamic response function: (i) slow temporal drift was accounted for with a cubic spline in the frame times (one covariate per 2 minute of scan time); (ii) spatial drift was modeled with a covariate in the whole volume average; (iii) the six translation and rotation parameters calculated during motion correction were included as covariates to reduce motion artifacts; (iv) to account for speech‐related movement and susceptibility artifacts, all actual speech, whether correct, incorrect, unintelligible, or superfluous, was modeled according to its actual onset and offset times, plus 100 ms on either side as a buffer.
Before model fitting, each volume was first normalized by dividing by the whole volume average. The analysis was based on a linear model with correlated errors. The correlation structure was modeled as an autoregressive process of degree 1. At each voxel, the autocorrelation parameter was estimated from the least squares residuals using the Yule‐Walker equations, after a bias correction for correlations induced by the linear model. The autocorrelation parameter was used to whiten the data and the design matrix. The linear model was then re‐estimated using least squares on the whitened data to produce estimates of effects and their standard errors. The three functional runs per subject were combined with a fixed effects model using multistat.
Then, statistical maps were registered to MNI space as described above. Subjects were combined using a mixed‐effects linear model with standard deviations carried up from the individual subject level. This model was fitted by the program multistat using ReML implemented by the EM algorithm. The ratio of the random effects variance to the fixed effects variance was not smoothed (i.e. a standard random effects analysis was performed).
The resulting t statistic images were first thresholded at t > 3.106 (df = 11, P < 0.005), and then corrected for multiple comparisons (P < 0.05, family‐wise error) by applying a minimum cluster size determined by Gaussian random field theory (whole brain search volume: 2,061 cm3; FWHM of data = 10 mm; minimum cluster size = 2.6 cm3). This was implemented by the program stat_summary. Some regions which did not meet the minimum cluster size were also displayed, as described in the Results section.
Images were overlaid on a high‐resolution single subject scan in MNI space using a custom MATLAB program. All coordinates are reported in MNI space. Anatomical locations of activations were determined by visual inspection of the data with reference to the atlas of Duvernoy et al. [1999]. Areas of overlap across contrasts (e.g. between frequency and RT) were true conjunctions in the sense that overlapping voxels had already been determined to be activated in each of the contrasts independently.
In several key regions of interest, parameter estimates (i.e. coefficients) for each variable were plotted along with their standard deviation across subjects. Two coefficients were plotted for each variable: one from the analysis where all variables were entered into the model simultaneously and one from the analysis where that variable was entered alone.
RESULTS
Behavioral Data
The variables associated with the 165 items are summarized in Table I. As described above, concept familiarity was quantified in a prior norming study, whereas accuracy, word frequency, word length and RT were determined based on subjects' actual responses in the scanner.
Table I.
Characteristics of the stimuli
| Mean | SD | Min | Max | |
|---|---|---|---|---|
| Correct (%) | 98.2 | 4.8 | 66.7 | 100 |
| Name agreement (% dominant) | 90.9 | 13.3 | 40.0 | 100 |
| Word frequency (log a.u.) | 9.85 | 1.34 | 6.73 | 13.07 |
| Number of phonemes | 5.02 | 1.86 | 2.00 | 10.00 |
| Reaction time (ms) | 1,091 | 166 | 808 | 1,624 |
Variables associated with the 165 pictures, with standard deviation (SD) and range (calculated across items).
The precise correlations between variables differed across subjects depending on the particular names they provided and their RTs. However, to gain a general impression of correlations between variables, we performed pairwise correlations between the four main variables of interest averaged across subjects for each item (Fig. 2b). All pairwise correlations were significant except for that between familiarity and length (familiarity and frequency: P < 0.0001; familiarity and length: P = 0.17; familiarity and RT: P < 0.0001; frequency and length: P < 0.0001; frequency and RT: P < 0.0001; length and RT: P = 0.040). These correlations underscore the importance of entering all variables into the model simultaneously in the fMRI analysis, in order to account for each variable's contribution above and beyond the others.
The mean accuracy across subjects was 98.2% (SD 1.6%; range 93.5–99.4%). The mean RT across subjects was 1,087 ms (SD 105 ms; range 934–1,242 ms). This is longer than typically reported in behavioral studies [Indefrey and Levelt,2004], but is comparable to the mean RT of 1031 ms reported in a previous naming study using naturalistic pictures in an fMRI scanner environment [Graves et al.,2007]. There were a mean of 2.7 unintelligible responses per subject (range 0–10), which were excluded from analysis.
fMRI Data
Brain regions activated by the task, and/or correlated with the variables of interest are depicted in Figure 3, and characterized in Table II.
Figure 3.
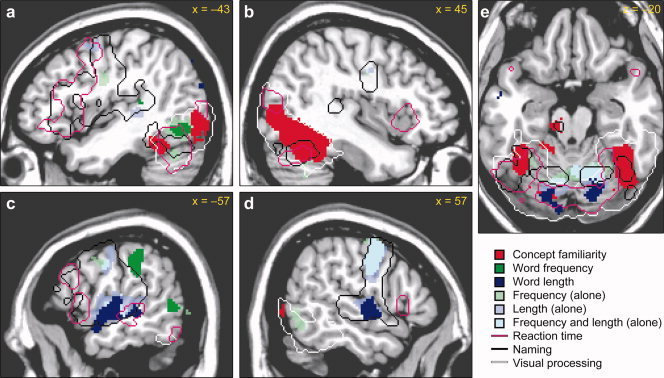
Regions with significant BOLD activations to the task, or significant correlations with psycholinguistic or behavioral variables (P < 0.05, corrected). Sagittal slices in the left (a, c) and right (b, d) hemispheres are shown, along with an axial slice through the cerebellum and fusiform gyrus (e). Regions activated by viewing pictures or scrambled pictures are shown with a white outline, while regions activated by picture naming are shown with a black outline. The four variables of interest shown are concept familiarity (red), word frequency (green), word length (blue) and reaction time (purple outline). These activations were observed when all variables were entered into a single model simultaneously. Additionally, regions which were correlated with frequency, length or both when entered into separate models alone are shown in faded greens and blues.
Table II.
Activated brain regions
| Brain region | Peak MNI coordinates | Extent (mm3) | P value | Max T | ||
|---|---|---|---|---|---|---|
| x | y | z | ||||
| Viewing pictures or scrambled pictures | ||||||
| Bilateral occipital cortex (all but the most dorsal parts), xtending to posterior ITG and posterior fusiform gyrus | −6 | −96 | −6 | 217,280 | <0.0001 | 23.52 |
| Naming pictures | ||||||
| Left frontal, temporal and subcortical regions | 110,096 | <0.0001 | ||||
| Precentral gyrus | −40 | −8 | 26 | 14.56 | ||
| Posterior IFG, pars opercularis and triangularis | −54 | 12 | 20 | 8.63 | ||
| STS | −56 | −28 | 0 | 7.97 | ||
| Left basal ganglia | −16 | −4 | 14 | 11.98 | ||
| Thalamus | −4 | −12 | 6 | 14.43 | ||
| Right precentral gyrus and STG | 31,112 | <0.0001 | ||||
| Central sulcus | 40 | −8 | 30 | 10.18 | ||
| STG | 66 | −24 | 6 | 7.69 | ||
| Pre‐SMA, anterior SMA, and dorsal mid Cingulate | −6 | 6 | 56 | 17,464 | <0.0001 | 10.91 |
| Left cerebellum and posterior ITG | −10 | −52 | −8 | 16,216 | <0.0001 | 7.05 |
| Cerebellum | −12 | −64 | −22 | |||
| Posterior ITG | −50 | −56 | −18 | 5.58 | ||
| Right cerebellum | 40 | −58 | −26 | 9,968 | <0.0001 | 7.95 |
| Correlations with familiarity (more signal for less familiar items) | ||||||
| Right fusiform gyrus and ventral occipital cortex | 31,176 | <0.0001 | ||||
| Fusiform gyrus | 36 | −46 | −28 | 12.29 | ||
| Occipital cortex | 22 | −92 | −2 | 11.56 | ||
| Left posterior fusiform gyrus and middle occipital gyrus | −50 | −80 | 4 | 5,448 | 0.0016 | 5.17 |
| Midbrain and left superior cerebellar peduncle | −14 | −54 | −32 | 4,064 | 0.0067 | 6.95 |
| Left posterior fusiform gyrus | −38 | −54 | −22 | 2,488 | 0.051 | 7.86 |
| Correlations with frequency (more signal for less frequent items) | ||||||
| Left SMG | −64 | −34 | 24 | 3,280 | 0.017 | 8.29 |
| Left posterior ITG | −44 | −68 | −10 | 2,752 | 0.035 | 5.33 |
| Correlations with length (more signal for longer items) | ||||||
| Cerebellum | 12 | −70 | −10 | 12,624 | <0.0001 | 6.19 |
| Left Heschl's gyrus, STG and STS | −54 | −2 | −16 | 4,824 | 0.0030 | 6.22 |
| Left middle occipital gyrus, superior part | −38 | −68 | 50 | 3,824 | 0.0088 | 6.19 |
| Left SFS and SMA | 2,944 | 0.027 | ||||
| SMA | −6 | 2 | 46 | 7.02 | ||
| Superior frontal sulcus | −26 | 10 | 60 | 5.15 | ||
| Right Heschl's gyrus | 58 | −10 | −4 | 2,528 | 0.048 | 5.24 |
| Correlations with reaction time (more signal for longer RTs) | ||||||
| Bilateral occipital cortex, fusiform gyrus and cerebellum, and left posterior ITG | 58,032 | <0.0001 | ||||
| Lingual gyrus | −4 | −80 | −12 | 10.83 | ||
| Left fusiform gyrus | −28 | −54 | −22 | 6.63 | ||
| Right fusiform gyrus | 26 | −52 | −22 | 6.34 | ||
| Left posterior ITG | −44 | −58 | −18 | 6.64 | ||
| Left cerebellum | −44 | −64 | −36 | 5.55 | ||
| Right cerebellum | 28 | −66 | −32 | 9.91 | ||
| Left posterior IFG, inferior precentral sulcus and precentral gyrus | 25,096 | <0.0001 | ||||
| Ventral pars opercularis | −56 | 8 | 2 | 10.12 | ||
| Pars triangularis | −58 | 18 | 22 | 8.03 | ||
| Pars orbitalis | −44 | 34 | −8 | 4.02 | ||
| Inferior precentral sulcus | −42 | 4 | 28 | 8.82 | ||
| Precentral gyrus | −44 | 4 | 48 | 5.02 | ||
| Pre‐SMA and dorsal mid‐cingulate | 13,904 | <0.0001 | ||||
| Mid‐cingulate | −6 | 14 | 40 | 9.36 | ||
| Pre‐SMA | −2 | 14 | 58 | 7.95 | ||
| Right anterior insula | 38 | 18 | −2 | 6,176 | 0.0009 | 7.75 |
| Left middle occipital gyrus | −32 | −86 | 14 | 5,288 | 0.0019 | 7.34 |
| Right middle occipital gyrus | 38 | −80 | 8 | 3,816 | 0.0089 | 7.63 |
| Thalamus | −2 | −6 | 2 | 3,624 | 0.011 | 7.55 |
| Left mid‐STS | −58 | −28 | −4 | 2,128 | 0.089 | 7.40 |
Brain regions significantly activated in contrasts of interest. For large clusters, prominent local maxima are listed separately (indented).
Viewing pictures or scrambled pictures activated all but the most dorsal parts of occipital cortex bilaterally, extending to the posterior inferior temporal gyrus (ITG) and fusiform gyrus (Fig. 3a–e, white outlines). These regions are well known to be involved in visual processing and object recognition [Grill‐Spector et al.,2000; Sereno et al.,1995].
Naming the pictures activated an extensive bilateral network of frontal and temporal regions, and the cerebellum (Fig. 3a–e, black outlines), consistent with prior studies [Price et al.,2005]. Frontal activations were much more extensive in the left hemisphere, encompassing much of the posterior IFG. These regions reflect potentially any stage of the word production process, including articulation as well as hearing one's own voice, and the parametric contrasts were designed to delineate the roles of particular areas.
Concept familiarity was negatively correlated with signal in occipital cortex and the fusiform gyrus bilaterally (Fig. 3a,b,e, red), i.e. these regions showed more signal when naming less familiar objects. These activations were more extensive in the right hemisphere. The regions correlated with concept familiarity were largely contained within the areas involved in viewing pictures or scrambled pictures, but overlapped only partially with regions activated by naming. It is likely that concept familiarity identifies brain areas that are involved in prelinguistic stages of word production, in this case, visual object recognition. When familiarity was entered into the model alone, leaving out other covariates, activation was somewhat more extensive but qualitatively similar and no additional regions were implicated (data not shown).
Word frequency (log‐transformed) was negatively correlated with two regions: one in the left posterior ITG (Fig. 3a, green) extending dorsally just into the posterior MTG (Fig. 3c, green), and one in the left supramarginal gyrus (SMG), extending ventrally to the Sylvian fissure (Fig. 3c, green; Table II). The posterior ITG region partially overlapped the region activated by visual processing, and partially overlapped regions activated by speech, and also regions positively correlated with RT (see below). However, this region did not overlap the region correlated with familiarity, which in the left hemisphere comprised two separate clusters anterior and posterior to the frequency‐modulated region. Plots of signal change in this region (Fig. 4a) showed that this region was correlated somewhat with familiarity when that variable was entered alone, but not when it was entered simultaneously with other variables.
Figure 4.

Estimates of signal modulation by four variables (concept familiarity, word frequency, word length and RT) in four regions of interest. The positive direction corresponds to less familiar, less frequent, more phonemes, and longer RT, respectively. The percent BOLD signal change per standard deviation of the variable is plotted. The dark gray bar for each variable shows the estimated coefficient when all variables were entered simultaneously into the same model, whereas the light gray bar shows the estimated coefficient when the variable in question was entered alone. Error bars show standard error of the mean. (a) The left posterior ITG region that was negatively correlated with frequency. (b) The left temporoparietal region that was negatively correlated with frequency. (c) The left precentral gyrus region where there the clusters for frequency alone and word length alone overlapped. (d) The left mid‐STS region that was correlated with both word length and RT.
The left SMG region that was negatively correlated with frequency extended ventrally to the Sylvian fissure (Fig. 3c, green). There was a smaller cluster immediately adjacent in the planum temporale (Fig. 3a, green) which also showed a negative correlation with frequency (peak −46, −36, 10; 128 mm3, n.s.). It is noteworthy that only this more ventral region was actually activated by naming relative to rest. The larger, more dorsal cluster was negatively correlated with RT (Fig. 4b), suggesting involvement in at least two processes: a frequency‐dependent component of naming, and a higher level process which results in reduced activation as a function of time on task.
When frequency was entered into the model alone (Fig. 3a–e, faded green), further activated regions were observed in the left premotor cortex (peak −44, −8, 26; 888 mm3, n.s.), right premotor cortex (peak 52, −8, 54; 3,608 mm3, P = 0.011), left STG (peak −56, −14, −2; 2,776 mm3, P = 0.034), right STG (peak 60, −8, −2; 1,480 mm3, n.s.) and the bilateral cerebellum (peak 16, −62, −22; 15,664 mm3, P < 0.0001). These regions did not emerge in the main model because they were also positively correlated with word length. However, the left and right precentral regions did appear to be modulated by both frequency and word length independently, as revealed by a plot of the signal change estimates in left premotor cortex (Fig. 4c). Note that the coefficients were greater when each variable was entered alone, but were still nonzero when they were entered simultaneously. A similar pattern was observed in right premotor cortex (data not shown). The frequency effect in the STG, however, appeared to be a consequence of the correlation between frequency and length, since there was no indication that frequency modulated this region in the main model where all variables were included (Fig. 4d).
Word length, quantified as number of phonemes, was positively correlated with signal in Heschl's gyrus bilaterally, the adjacent superior temporal gyrus (STG) and superior temporal sulcus (STS) in the left hemisphere, the cerebellum bilaterally, the supplementary motor area (SMA), and several other regions (Fig. 3c–e, blue, Table II). The cerebellar activations presumably reflect increased motor demands of longer words. Some or potentially all of the activity in auditory areas might reflect neural responses to hearing one's own voice, since there is more auditory input as a consequence of producing a longer word. However, the posterior part of the STS activation showed an overlap with a region positively correlated with RT (peak −56, −32, −4; Fig. 3c). Estimates of coefficients for this region are shown in Fig. 4d. This correlation with RT suggests a role in word production rather than just incidental auditory feedback, since RT would not affect a purely auditory response (note that primary auditory cortex in Heschl's gyrus was correlated with word length but not with RT). It should be noted that this RT activation was significant when RT was entered into the model alone (P = 0.038) but only marginally significant in the main model with all variables entered together (2,128 mm3, P = 0.089).
A model in which word length alone was included, but not the other variables (Fig. 3a–e, faded blue) revealed additional activations in left premotor cortex (peak −46, −4, 56; 2856 mm3, P = 0.030) and right premotor cortex (peak 48, −8, 38; 5784 mm3, P = 0.0012). As mentioned above, these regions were also correlated with frequency which is why they were not significant in the main analysis where all variables were included. However, it is certainly not surprising that speech motor areas should correlate with the length of the word produced.
With regard to RT (Fig. 3a–e, purple outline, Table II), several of the activated regions have already been mentioned, where they overlapped areas associated with other variables (posterior ITG, left STS). These regions are presumably involved in the stages of word production identified by the other variables in question. Besides these regions, RT was also positively correlated with an extensive network of brain regions known to be involved in executive and attentional processes, including the left posterior IFG, left inferior precentral sulcus, pre‐SMA, mid‐cingulate, and right anterior insula. A similar network of regions has been reported to be correlated with RT in prior studies [Binder et al.,2004,2005].
DISCUSSION
Picture naming is a complex, multistage process involving a distributed network of brain regions. The present study attempted to map the contributions of various brain regions to different stages of naming by correlating neural activity with a range of naming‐related variables. Our results demonstrated the potential usefulness of this approach in studying a complex process. Within the overall network of regions activated by overt picture naming, we observed distinct sub‐networks where signal correlated with concept familiarity, word frequency, word length or RT, despite moderate pairwise correlations between most of these variables. Familiarity modulated signal in occipital cortex and the fusiform gyrus bilaterally. Less frequent words led to greater signal in the left posterior ITG and left temporoparietal cortex. Longer words were associated with signal increases in primary auditory areas bilaterally, STG and STS in the left hemisphere, and the cerebellum. RT modulated some of these regions—occipitotemporal cortex bilaterally and the left STS—in addition to a wide network of regions involved in executive and attentional processes including left IFG, left premotor cortex, bilateral anterior insula, and the pre‐SMA. Each of these regions was identified in models where all variables were entered simultaneously into a model, confirming that they showed sensitivity to each variable in question above and beyond the effects of other variables. Several additional regions were observed when separate models were constructed for each variable alone: left and right premotor cortex and the bilateral cerebellum were modulated by both frequency and word length.
The bilateral occipital and fusiform regions correlated negatively with concept familiarity are well known to be involved in visual processing and object recognition [Grill‐Spector et al.,2000; Sereno et al.,1995]. Reduced responses for more familiar stimuli in occipitotemporal regions have been reported in several previous studies [Chao et al.,2002; Van Turennout et al.,2000,2003]. The regions correlated with familiarity were more extensive in the right hemisphere, consistent with a combined lesion‐deficit and functional imaging study that associated the right fusiform gyrus with processing visual attributes [Vandenbulcke et al.,2006]. In terms of the lexical access model of Levelt et al. [1999], concept familiarity presumably modulates the prelinguistic stage of conceptual processing leading to a lexical concept. Although our data suggest that these conceptual lead‐in processes involve posterior inferior temporal and occipital cortex, anterior temporal regions, which are difficult to image with fMRI due to susceptibility artifacts, likely also play an important role [Damasio et al.,1996; Gorno‐Tempini et al.,2004; Lambon Ralph et al.,1998].
A region in the left posterior ITG showed a negative correlation with frequency: it was more active for the production of less frequent words. The coordinates of this region matched closely those of the largest frequency‐correlated region in a previous fMRI picture naming study [Graves et al.,2007], and two parametric fMRI studies of frequency effects in single word reading also reported negative correlations with frequency in fusiform and/or occipital regions in this vicinity [Hauk et al.,2008; Kronbichler et al.,2004]. Although frequency effects are typically thought to act at the level of phonological code retrieval [Jescheniak and Levelt,1994], it is unlikely that such a ventral region plays a role in a phonological stage of naming, since practically no lesion‐deficit or imaging studies have identified a role for this region in phonological processes. However, frequency also exerts an effect at an earlier stage of processing: in a gender decision task which required access to the lemma but not the phonological form, a frequency effect was observed for the first presentation of each item [Jescheniak and Levelt,1994]. Another possibility is that if there is feedback between processing levels [e.g. Dell et al.,1997], a frequency effect driven by phonological code retrieval might result in more activity in a brain region reflecting input to that process, i.e. the lemma level. Based on these considerations, we suggest that this posterior ITG region is involved in lexical selection and/or representation of lemmas. A similar role was suggested by Graves et al. [2007], and the location of a conceptual‐lexical interface in this region is consistent with the neuroanatomical model of Hickok and Poeppel [2007]. Based on their meta‐analysis of naming and reading studies, Indefrey and Levelt [2004] locate lemma access anteriorly and dorsally, in the mid‐middle temporal gyrus (MTG). We believe that the activation of the mid‐MTG in naming but not reading studies could instead reflect greater demands on phonological retrieval in naming compared with reading.
Another region negatively correlated with frequency was the left temporoparietal junction. The two peaks we observed in this region (−64, −34, 24) and (−46, −36, 10) are close to a frequency‐correlated posterior STG region (−51, −37, 20) reported by Graves et al. [2007), and increased activation for low‐frequency words in this vicinity was also reported by Fiez et al. [1999) for reading. Another study of word and pseudoword repetition found decreased activity in the posterior STG (−67, −40, 20) for items on which subjects had been familiarized before the scan [Majerus et al.,2005], which may be somewhat similar to a frequency effect, albeit operating over a much shorter timeframe. In terms of the Levelt et al. [1999] model, frequency effects are thought to reflect predominantly phonological code retrieval [Jescheniak and Levelt,1994]. Phonological (e.g. syllabification) and phonetic (e.g. aspiration) encoding stages may also be plausible loci for frequency effects, though not articulation itself [Jescheniak and Levelt,1994; Monsell,1990].
Other evidence for a role for this region in phonological retrieval and/or encoding comes from functional imaging and lesion studies. In an fMRI study, de Zubicaray et al. [2002] found that orthographic/phonological facilitation of naming, an effect thought to be associated with the phonological retrieval stage, was associated with decreased activity in a posterior superior temporal region (−64, −46, 20). The more ventral of the two peaks we report likely reflects area Spt, argued to be involved in mapping between auditory and motor representations [Hickok and Poeppel,2007; Hickok et al.,2003], which would correspond to phonological and/or phonetic encoding in the terms of the Levelt et al. [1999] model. Lesions in left temporoparietal cortex often result in conduction aphasia, characterized by repetition deficits and phonemic paraphasias in speech production [Damasio and Damasio,1980; Green and Howes,1978], or anomic aphasia [Kertesz et al.,1979]. Neurodegenerative damage to temporoparietal regions leads to logopenic progressive aphasia, which like conduction aphasia is associated with poor repetition and phonemic paraphasias [Gorno‐Tempini et al.,2004]. The range of deficits observed in these disorders is consistent with impairments in phonological code retrieval or encoding.
We also observed both frequency and length effects in premotor cortex bilaterally, as did Graves et al. [2007]. While these correlated regions were significant only when each of these variables was entered alone, plots of signal change suggested that both variables have an independent effect (Fig. 4c). While the length effects are expected, presumably reflecting increased motor activity for longer words, the frequency effects are somewhat surprising. Given that premotor cortex is an unlikely repository for phonological forms, correlations with frequency in this region provide further evidence that frequency effects can operate not just at the level of phonological retrieval, but also phonological and/or phonetic encoding. In general, the fact that frequency effects were observed in such functionally distinct regions—posterior ITG, left temporoparietal cortex, and bilateral premotor cortex—suggests that frequency impacts multiple stages of lexical access, which is consistent with EEG studies, which have revealed frequency effects at multiple latencies [Hauk and Pulvermuller,2004; Hauk et al.,2006; Sereno et al.,1998].
We did not observe any correlations with frequency in the IFG, unlike previous studies of frequency effects in picture naming [Graves et al.,2007] single word reading [Fiez et al.,1999; Hauk et al.,2008; Kronbichler et al.,2004] and lexical decision [Carreiras et al.,2006; Fiebach et al.,2002]. However, it is noteworthy that the IFG activation in the only one of these studies using the same task [i.e. picture naming, Graves et al.,2007] was very small, and would not have reached significance using our thresholding methods. On the other hand, we did observe a strong correlation with RT in the whole posterior IFG (see below).
Word length, quantified as number of phonemes, modulated signal in primary auditory cortex bilaterally, extending in the left hemisphere into the STG and STS. Of particular interest was a subset of this region which also showed a positive correlation with RT. This subregion was located in the mid‐STS, with the peak for the conjunction at (−56, −32, −4). The correlation with word length shows that this region is modulated by the amount of phonological material retrieved, and the correlation with RT confirms that activity is not simply due to auditory feedback. We did not observe any correlations with frequency in this mid‐STS region once contributions of other variables (specifically length) were taken into account, nor were frequency correlations observed in this region by Graves et al. [2007]. One possibility is that the temporoparietal frequency‐correlated region is responsible for the retrieval and encoding of phonological forms, whereas this mid‐STS site constitutes a storage site for phonological forms. This region is close to a region which was more active for listening to words with high phonological neighborhood density (−53, −37, 3, averaged across the individual subject coordinates reported), another good assay of lexical‐phonological representations [Okada and Hickok,2006]. It is also close to a site implicated in phonemic over nonphonemic processing (−56, −31, 3) [Liebenthal et al.,2005].
We included the behavioral variable RT in the model along with the three psycholinguistic variables because previous studies have shown that many BOLD effects ascribed to stimulus differences may in fact reflect differences in time on task [Binder et al.,2004,2005]. Because RT is a behavioral variable directly affected by the three psycholinguistic variables, this approach could run the risk of decreasing our ability to detect correlations with the psycholinguistic variables. However, the only additional regions which emerged when variables were entered one at a time into separate models reflected the correlation between frequency and word length, rather than correlations with RT. The one exception might be the left IFG, where we observed an extensive region correlated with RT, but no regions correlated with frequency, in contrast to previous studies [Carreiras et al.,2006; Fiebach et al.,2002; Fiez et al.,1999; Graves et al.,2007; Hauk et al.,2008; Kronbichler et al.,2004]. However, we also saw no correlation with frequency in this region even when it was entered alone. These frontal regions are known to be involved in executive, attentional and other high‐level processes [Binder et al.,2004,2005], which would explain their correlation with RT. While the left IFG is clearly involved in lexical access, it is unclear whether the contribution of IFG is specifically linguistic or relates to higher level control processes such as these.
Future studies with carefully constructed stimulus sets could be very informative. For instance, it would be useful to understand in which situations concept familiarity and frequency dissociate. In terms of frequency, the effects of homophones could be examined to disentangle earlier and later phonological stages. Phonological complexity could be dissociated from number of phonemes to potentially yield more information about retrieval and processing of phonological forms. Finally, given the likely importance of the anterior temporal lobe in lexical semantics and possibly lexical access, pulse sequences which reduce signal loss in this area would be desirable. Despite these caveats, our parametric approach to disentangling correlated variables was successful in revealing new information about a range of brain areas involved in various stages of word production. Specifically, we identified two frequency‐modulated regions: a left posterior inferior temporal region which may be involved in lexical selection, and a left temporoparietal region which may play a role in phonological retrieval and encoding. A region in the left mid‐STS was modulated by word length and reaction time and may be a key site for storage of lexical phonological codes.
Acknowledgements
The authors thank L. Tugan Muftuler for preparing the fMRI pulse sequence, Maggie Hui Liu and Becky Semon for technical assistance with scanning, David Howard for providing us with the pictures, three anonymous reviewers for their constructive comments, and all of our study participants.
REFERENCES
- Binder JR,Liebenthal E,Possing ET,Medler DA,Ward BD ( 2004): Neural correlates of sensory and decision processes in auditory object identification. Nat Neurosci 7: 295–301. [DOI] [PubMed] [Google Scholar]
- Binder JR,Medler DA,Desai R,Conant LL,Liebenthal E ( 2005): Some neurophysiological constraints on models of word naming. Neuroimage 27: 677–693. [DOI] [PubMed] [Google Scholar]
- Brown AS ( 1981): Inhibition in cued retrieval. J Exp Psychol Hum L 7: 204–215. [Google Scholar]
- Carreiras M,Mechelli A,Price CJ ( 2006): Effect of word and syllable frequency on activation during lexical decision and reading aloud. Hum Brain Mapp 27: 963–972. [DOI] [PMC free article] [PubMed] [Google Scholar]
- Chao LL,Weisberg J,Martin A ( 2002): Experience‐dependent modulation of category‐related cortical activity. Cereb Cortex 12: 545–551. [DOI] [PubMed] [Google Scholar]
- Damasio H,Damasio AR ( 1980): The anatomical basis of conduction aphasia. Brain 103: 337–350. [DOI] [PubMed] [Google Scholar]
- Damasio H,Grabowski TJ,Tranel D,Hichwa RD,Damasio AR ( 1996): A neural basis for lexical retrieval. Nature 380: 499–505. [DOI] [PubMed] [Google Scholar]
- de Zubicaray GI,McMahon KL,Eastburn MM,Wilson SJ ( 2002): Orthographic/phonological facilitation of naming responses in the picture‐word task: An event‐related fMRI study using overt vocal responding. Neuroimage 16: 1084–1093. [DOI] [PubMed] [Google Scholar]
- Dell GS,Schwartz MF,Martin N,Saffran EM,Gagnon DA ( 1997): Lexical access in aphasic and nonaphasic speakers. Psychol Rev 104: 801–838. [DOI] [PubMed] [Google Scholar]
- Duvernoy HM ( 1999): The Human Brain: Surface, Three‐Dimensional Sectional Anatomy with MRI, and Blood Supply. Wien: Springer. [Google Scholar]
- Fiebach CJ,Friederici AD,Muller K,von Cramon DY ( 2002): fMRI evidence for dual routes to the mental lexicon in visual word recognition. J Cogn Neurosci 14: 11–23. [DOI] [PubMed] [Google Scholar]
- Fiez JA,Balota DA,Raichle ME,Petersen SE ( 1999): Effects of lexicality, frequency, and spelling‐to‐sound consistency on the functional anatomy of reading. Neuron 24: 205–218. [DOI] [PubMed] [Google Scholar]
- Fiez JA,Tranel D ( 1997): Standardized stimuli and procedures for investigating the retrieval of lexical and conceptual knowledge for actions. Mem Cognit 25: 543–569. [DOI] [PubMed] [Google Scholar]
- Gorno‐Tempini ML,Dronkers NF,Rankin KP,Ogar JM,Phengrasamy L,Rosen HJ,Johnson JK,Weiner MW,Miller BL ( 2004): Cognition and anatomy in three variants of primary progressive aphasia. Ann Neurol 55: 335–346. [DOI] [PMC free article] [PubMed] [Google Scholar]
- Graves WW,Grabowski TJ,Mehta S,Gordon JK ( 2007): A neural signature of phonological access: Distinguishing the effects of word frequency from familiarity and length in overt picture naming. J Cogn Neurosci 19: 617–631. [DOI] [PubMed] [Google Scholar]
- Green E,Howes DH ( 1978): The nature of conduction aphasia: A study of anatomic and clinical features and of underlying mechanisms. In: Whitaker H, Whitaker HA, editors. Studies in Neurolinguistics, Vol. 3 New York: Academic Press; pp 123–156. [Google Scholar]
- Grill‐Spector K,Kushnir T,Hendler T,Malach R ( 2000): The dynamics of object‐selective activation correlate with recognition performance in humans. Nat Neurosci 3: 837–843. [DOI] [PubMed] [Google Scholar]
- Hauk O,Davis MH,Ford M,Pulvermuller F,Marslen‐Wilson WD ( 2006): The time course of visual word recognition as revealed by linear regression analysis of ERP data. Neuroimage 30: 1383–1400. [DOI] [PubMed] [Google Scholar]
- Hauk O,Davis MH,Pulvermuller F ( 2008): Modulation of brain activity by multiple lexical and word form variables in visual word recognition: A parametric fMRI study. Neuroimage 42: 1185–1195. [DOI] [PubMed] [Google Scholar]
- Hauk O,Pulvermuller F ( 2004): Effects of word length and frequency on the human event‐related potential. Clin Neurophysiol 115: 1090–1103. [DOI] [PubMed] [Google Scholar]
- Hickok G,Buchsbaum B,Humphries C,Muftuler T ( 2003): Auditory‐motor interaction revealed by fMRI: Speech, music, and working memory in area Spt. J Cogn Neurosci 15: 673–682. [DOI] [PubMed] [Google Scholar]
- Hickok G,Poeppel D ( 2007): The cortical organization of speech processing. Nat Rev Neurosci 8: 393–402. [DOI] [PubMed] [Google Scholar]
- Howard D,Nickels L,Coltheart M,Cole‐Virtue J ( 2006): Cumulative semantic inhibition in picture naming: Experimental and computational studies. Cognition 100: 464–482. [DOI] [PubMed] [Google Scholar]
- Indefrey P,Levelt WJ ( 2004): The spatial and temporal signatures of word production components. Cognition 92: 101–144. [DOI] [PubMed] [Google Scholar]
- Jenkinson M,Smith S ( 2001): A global optimisation method for robust affine registration of brain images. Med Image Anal 5: 143–156. [DOI] [PubMed] [Google Scholar]
- Jescheniak JD,Levelt WJM ( 1994): Word frequency effects in speech production: Retrieval of syntactic information and of phonological form. J Exp Psychol Learn 20: 824–843. [Google Scholar]
- Jung KJ,Prasad P,Qin Y,Anderson JR ( 2005): Extraction of overt verbal response from the acoustic noise in a functional magnetic resonance imaging scan by use of segmented active noise cancellation. Magn Reson Med 53: 739–744. [DOI] [PMC free article] [PubMed] [Google Scholar]
- Kertesz A,Harlock W,Coates R ( 1979): Computer tomographic localization, lesion size, and prognosis in aphasia and nonverbal impairment. Brain Lang 8: 34–50. [DOI] [PubMed] [Google Scholar]
- Kronbichler M,Hutzler F,Wimmer H,Mair A,Staffen W,Ladurner G ( 2004): The visual word form area and the frequency with which words are encountered: Evidence from a parametric fMRI study. Neuroimage 21: 946–953. [DOI] [PubMed] [Google Scholar]
- Lambon Ralph MA,Graham KS,Ellis AW,Hodges JR ( 1998): Naming in semantic dementia–What matters? Neuropsychologia 36: 775–784. [DOI] [PubMed] [Google Scholar]
- Leech G,Rayson P,Wilson A ( 2001): Word Frequencies in Written and Spoken English: Based on the British National Corpus. London: Longman. [Google Scholar]
- Levelt WJ,Roelofs A,Meyer AS ( 1999): A theory of lexical access in speech production. Behav Brain Sci 22: 1–38. [DOI] [PubMed] [Google Scholar]
- Liebenthal E,Binder JR,Spitzer SM,Possing ET,Medler DA ( 2005): Neural substrates of phonemic perception. Cereb Cortex 15: 1621–1631. [DOI] [PubMed] [Google Scholar]
- Majerus S,Van der Linden M,Collette F,Laureys S,Poncelet M,Degueldre C,Delfiore G,Luxen A,Salmon E ( 2005): Modulation of brain activity during phonological familiarization. Brain Lang 92: 320–331. [DOI] [PubMed] [Google Scholar]
- Monsell S ( 1990): Frequency effects in lexical tasks: Reply to Balota and Chumbley. J Exp Psychol Gen 119: 335–339. [DOI] [PubMed] [Google Scholar]
- Okada K,Hickok G ( 2006): Identification of lexical‐phonological networks in the superior temporal sulcus using functional magnetic resonance imaging. Neuroreport 17: 1293–1296. [DOI] [PubMed] [Google Scholar]
- Price CJ,Devlin JT,Moore CJ,Morton C,Laird AR ( 2005): Meta‐analyses of object naming: Effect of baseline. Hum Brain Mapp 25: 70–82. [DOI] [PMC free article] [PubMed] [Google Scholar]
- Sereno MI,Dale AM,Reppas JB,Kwong KK,Belliveau JW,Brady TJ,Rosen BR,Tootell RB ( 1995): Borders of multiple visual areas in humans revealed by functional magnetic resonance imaging. Science 268: 889–893. [DOI] [PubMed] [Google Scholar]
- Sereno SC,Rayner K,Posner MI ( 1998): Establishing a time‐line of word recognition: Evidence from eye movements and event‐related potentials. Neuroreport 9: 2194–2200. [DOI] [PubMed] [Google Scholar]
- Smith SM ( 2002): Fast robust automated brain extraction. Hum Brain Mapp 17: 143–155. [DOI] [PMC free article] [PubMed] [Google Scholar]
- Smith SM,Jenkinson M,Woolrich MW,Beckmann CF,Behrens TE,Johansen‐Berg H,Bannister PR,De Luca M,Drobnjak I,Flitney DE,Niazy RK,Saunders J,Vickers J,Zhang Y,De Stefano N,Brady JM,Matthews PM ( 2004): Advances in functional and structural MR image analysis and implementation as FSL. Neuroimage 23: S208–S219. [DOI] [PubMed] [Google Scholar]
- Szekely A,Bates E ( 2000): Objective visual complexity as a variable in studies of picture naming. CRL Newsletter 12: 1–33. [Google Scholar]
- van Turennout M,Bielamowicz L,Martin A ( 2003): Modulation of neural activity during object naming: Effects of time and practice. Cereb Cortex 13: 381–391. [DOI] [PubMed] [Google Scholar]
- van Turennout M,Ellmore T,Martin A ( 2000): Long‐lasting cortical plasticity in the object naming system. Nat Neurosci 3: 1329–1334. [DOI] [PubMed] [Google Scholar]
- Vandenbulcke M,Peeters R,Fannes K,Vandenberghe R ( 2006): Knowledge of visual attributes in the right hemisphere. Nat Neurosci 9: 964–970. [DOI] [PubMed] [Google Scholar]
- Worsley KJ,Liao CH,Aston J,Petre V,Duncan GH,Morales F,Evans AC ( 2002): A general statistical analysis for fMRI data. Neuroimage 15: 1–15. [DOI] [PubMed] [Google Scholar]