Abstract
The elastic network interpolation (ENI)1 is a computationally efficient and physically realistic method to generate conformational transition intermediates between two forms of a given protein. However it can be asked whether these calculated conformations provide good representatives for these intermediates. In this study, we use ENI to generate conformational transition intermediates between the open form and the closed forms of adenylate kinase (AK). Based on Cα-only intermediates, we construct atomic intermediates by grafting all the atoms of known AK structures onto the Cα atoms and then perform CHARMM energy minimization to remove steric conflicts and optimize these intermediate structures. We compare the energy profiles for all intermediates from both the CHARMM force-field and from knowledge-based energy functions. We find that the CHARMM energies can successfully capture the two energy minima representing the open AK and closed AK forms, while the energies computed from the knowledge-based energy functions can detect the local energy minimum representing the closed AK form and show some general features of the transition pathway with a somewhat similar energy profile as the CHARMM energies. The combinatorial extension (CE) structural alignment2 and the k-means clustering algorithm are then used to show that known PDB structures closely resemble computed intermediates along the transition pathway.
Introduction
Proteins are essential biological macromolecules participating in most cellular processes such as enzyme catalysis3, cell signaling transduction4,5, and structural functions including cytoskeleton and motor proteins6,7. Many proteins perform their functions through conformational changes. Simple examples are the enzymes, the most remarkable and highly specialized proteins, which catalyze various reactions in biological systems8,9. In contrast to synthetic and organic catalysts, enzymes have an extraordinary catalytic power and usually have a high degree of specificity for their substrates. In addition to enzymes, there are many other types of proteins requiring motions to perform their function, such as molecular motors, receptors, and transport proteins.10
The conformational changes of proteins are so important for biological systems that scientists have devoted tremendous efforts to study the mechanisms of these phenomena. Because the conformational transition pathways of proteins are not easy to capture using experimental methods, computational research in this field is really important and active.
There are three main computational approaches to study this problem: molecular dynamics (MD) simulation11-13, normal mode analysis (NMA)14,15 or its simplified versions - elastic network model (ENM)16-19, and Monte Carlo (MC) simulation20. The MD simulation is predominant among all the above computational approaches, although it is computationally expensive and often leads to local minima energy traps. The extensions of classical MD simulation include targeted MD21, replica-exchange MD22, and conformational flooding23,24. Recently, the combination of new energy minimization schemes and MD simulation has been employed to tackle large-scale allosteric conformational transitions in adenylate kinase25. Although MD simulations for large scale and long time conformational change are a challenging task, Pontiggia et al. have performed 100ns MD simulation for both the open and the closed form of AK and extensively analyzed the trajectory of their MD simulation using principal component analysis, structure clustering and other methods26. These atomic level studies of AK conformational change25,26 reveal that the enzyme can interconvert between the open and closed conformation even in the absence of its substrate. Dual Go-like model with two reference structures was proposed recently to study structural changes of myosin motor from the pre-power stroke to near-rigor state27. The MC simulation is another popular approach for studying protein folding pathways20, but more rarely used for analyses of protein motions. There are several reasons for the relatively rare usage of MC in the researches of conformational change. MC elementary movements (like crankshaft, reptations, etc. are somewhat artificial and it was originally developed for computation of ensemble averages and not for time dependent problems. Conformational space is extremely large, and there are huge attrition problems for compact structures. Additionally, until recently when Kolinski & Skolnick developed their TASSER28 and CABS model29 there were no good enough coase-grained potentials for such simulations.
ENMs are computationally more efficient and therefore are recently becoming widely used in this field. Recent studies have shown that the low frequency, global motions are of functional importance in proteins and other biological structures and can be simulated with ENMs30. A modified ENM, named coarse-grained elastic network interpolation (ENI)1,31,32, has been developed to efficiently generate the transition pathways by interpolating uniformly the distance between open and closed conformations of a given protein. The ENI has been shown its usefulness for studying the functional transitions of HK97 capsid33 and has been validated by MD simulation of 16S ribosomal RNA34. Maragakis and Karplus proposed a modification of ENM called the Plastic Network Model (PNM) to generate conformational pathways between two structural forms of adenylate kinase35. Recently a mixed elastic network model (MENM) has been proposed by Zheng et. al36 to study large-scale conformational transitions between two or more structures.
Although coarse-grained ENI greatly reduces the computational cost, detailed information on side-chain atoms in the structure is inevitably lost. Here we extend the application of the ENI to generate atomic (instead of the coarse-grained) transition intermediates. This is realized by assuming that all atoms in each residue move collectively, but small-scale rearrangements are allowed. We also calculate the energies of all of the generated transition intermediates by using both the CHARMM energy force-field and knowledge-based potential functions.
Adenylate kinase (AK) displays an extremely large-scale motion upon binding its substrate (ATP/AMP) or an inhibitor (AP5A). AK is a monomeric phosphotransferase enzyme that catalyzes the reactions:
The structure of AK has three domains: the ATP binding domain - LID, the NMP binding domain - NMP, and the CORE domain, shown in red, yellow and blue, respectively, in Figure 1. The substrate of AK induces a large-scale domain motion as can be seen in Figure 1. This type of motion is classified as a hinge motion since it involves relatively large changes in the main chain torsion angles37.
Figure 1.
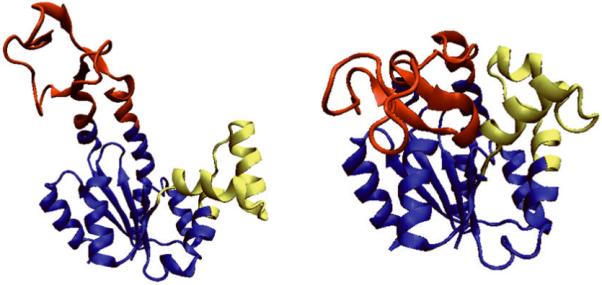
The open and closed forms of AK. The open form (PDB id: 4AKE) is on the left and the closed form (PDB id: 1AKE) is on the right. The LID domain is shown in red, the NMP domain in yellow, and the CORE domain in blue. The inhibitor AP5A binding with 1AKE is not shown here.
Methods
Generation of conformational transition intermediates
We use coarse-grained ENI model to generate conformational transition intermediates. Only Cα atoms are chosen to represent the residues. We generate transition pathway frames between the open form of AK (4AKE) and its closed form (1AKE). The ENI model was first developed in 2002 and its details are given in reference31. Here we briefly summarize the principles of this model. The ENI is based on a coarse-grained elastic network model and assumes that the optimal intermediates can be found by small changes in the Cα positions that result from introducing correspondingly small changes in the inter-residual distances31. The ENI introduces the linking (contact) matrix κ which is the “union” of the connectivity matrices of the starting and ending structures, defined by the sets of coordinates of atoms (residues) and denoted as {xi} and {χi} respectively. It is assumed that the element κi,j has value 1 whenever residues i and j are within the cutoff range in either conformation, and zero otherwise. The Taylor series expansion of the potential energy is used to obtain the equation of motion of the protein. A cost function C(δ) defined in Eq. 1 is introduced, which is the function of atomic displacements , where δi is a vector of displacements for the i-th residue. Then each intermediate conformation is defined by the value of δ that minimizes the cost function, when all other parameters are held constant. The value lij is the targeted distance between residues i and j, modeled as a linear combination of corresponding distances in the starting and the ending conformation (Eq. 2), and α is a parameter measuring the extent to which the intermediate conformation has moved away from the starting structure towards the ending structure. In this study, we set α=0.01, so that 99 intermediate structures were generated.
| (1) |
| (2) |
Construction of atomic intermediates
The conformational transition intermediates generated by the ENI provide scaffolds with coordinates of only Cα atoms. We assume that all other atoms in a given residue move collectively with the corresponding Cα atom, i.e., all atoms in a residue move like a rigid body. We superimpose each intermediate structure with the Cα -traces from the starting structure: 4AKE. Atoms other than Cαs are then grafted from 4AKE to the intermediate scaffold by using the same translation and rotation as their corresponding Cα atom. The new atomic structures generated from the Cα scaffolds inevitably have some steric clashes. These steric clashes can be removed by a local structure rearrangement using CHARMM energy minimization.
Energy calculations
We use the CHARMM22 force-field given by Eq. 3 to calculate the energies of all conformational transition intermediates at the atomistic detail. CHARMM energy minimization is done using the steepest descent algorithm and the conjugate gradient method.
| (3) |
Knowledge-based statistical potentials and gapless threading methods are also employed to evaluate the free energies of the conformational transition pathways. Four-body contact potentials, two-body potentials and short-range interaction energies have been derived by us in the past considering different aspects of protein structures. The four-body contact potentials represent the cooperative parts of the protein folding process38. The two-body potentials have been developed using the quasi-chemical approximation with an approximate estimation of the chain connectivity effects39,40. Short-range interaction energies allow us to estimate free energies from the statistical distribution of local conformational descriptors41.
Results
CHARMM energy minimization effects on the structure rearrangement
We construct the all-atom models of intermediates by assuming that all other atoms in a residue move collectively with their corresponding Cα atom. These atomic intermediates are optimized further using CHARMM energy minimization. We calculate the RMSDs of Cα atoms, non-Cα backbone atoms and side chain atoms between each pair of intermediate structures and find the side chain RMSDs (the average value is 2.09 Å) are larger than the RMSDs of the Cαs and non-Cα backbone atoms (Fig 2). However, the RMSDs of Cα and non-Cα backbone atoms are quite similar and the average values of these RMSDs are 0.72 Å and 0.85 Å respectively. The results shown in Figure 2 indicate that CHARMM energy minimization causes mostly side chain rearrangements, having less effect on the displacement of the backbone atoms.
Figure 2.
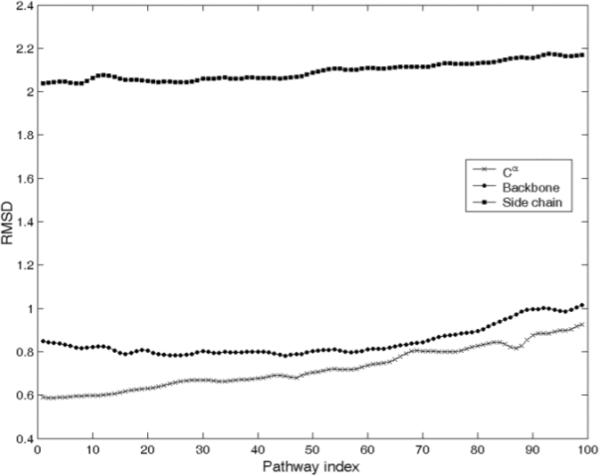
RMSDs (in Å) of the Cα atoms (crosses), non- Cα backbone atoms (filled circles), and side chain atoms (filled squares) before and after CHARMM energy minimization for all transition intermediates generated using ENI model and grafting all other atoms from 4AKE. Pathway index indicates the extent along the path from open to closed form.
Energy profiles of the conformational transition pathway
The CHARMM-computed energies for all structural intermediates along the pathway are shown in Figure 3. This pathway was generated for AK using the Elastic Network Interpolation between the open form (4AKE) and the closed form (1AKE). Because we assume that all atoms in each residue move collectively with the corresponding Cα atom, we graft all non-Cα atoms from 4AKE onto all intermediate structures. The energies of all these atomistically modeled intermediate structures were then minimized with CHARMM, and the final results are plotted in Fig. 3.
Figure 3.
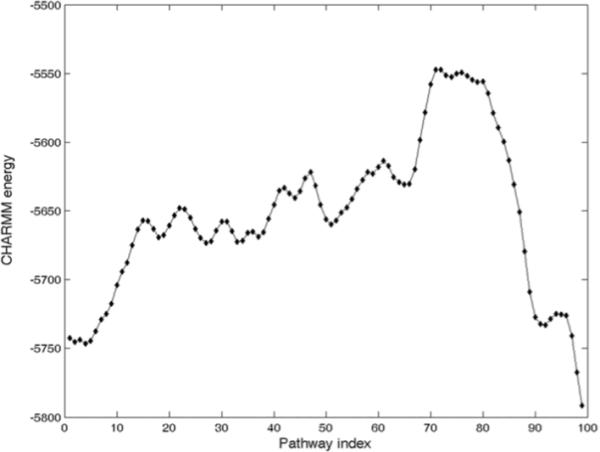
CHARMM computed energies of structural intermediates with all non- Cα atoms grafted from 4AKE. The transition barrier is around pathway index 75, i.e. ¾ the way toward the closed form.
The intermediates in Figure 3. can successfully capture two local minima close to the open form AK and the closed form AK, and also capture the maximum position near the pathway index 75, after which the pathway intermediates show a fast decrease of their total CHARMM-computed energies down to the minimum corresponding to the closed form (1AKE). The pathway intermediates generated by the ENI can capture two local minima around the starting and the ending state and allow us to estimate the energy barrier along the pathway. The transition barrier (around the pathway index 75) is nearer to the closed form than to the open form.
We also use knowledge-based statistical potentials based on coarse-grained models of proteins to evaluate the energies of all these intermediates structures (Fig 4). All results were calculated using the intermediates with all non-Cα atoms grafted from 4AKE. We used four different statistical potentials, namely: short-range interaction energies derived by Bahar et. al 41, two types of Miyazawa-Jernigan (MJ) contact potentials eij 40 and eij'40, and 4-body potentials derived recently by us38. The MJ two-body contact potentials, eij and eij', are respectively derived from the assumptions and . Here i, j, and 0 represent residue i, residue j and solvent respectively. For instance, is the statistical average of the contacts between residue i and j nij. There are more details about the derivation of these two-body contact potentials in the publication in 1985.39 The two-body potentials we are using here are from the publication in 1996.40 None of these statistical potentials capture the local minimum energy around the starting structure 4AKE. However, the Miyazawa-Jernigan (MJ) two-body potential eij'39,40 detects the energy barrier near the ending point 1AKE and assigns relatively low energies to intermediates near the ending point. We combine all these different energies using Eq. 4 after we first standardize all of them using Eq. 5 to remove the effect of the different scales of energies in the combined potentials.
| (4) |
| (5) |
Figure 4.
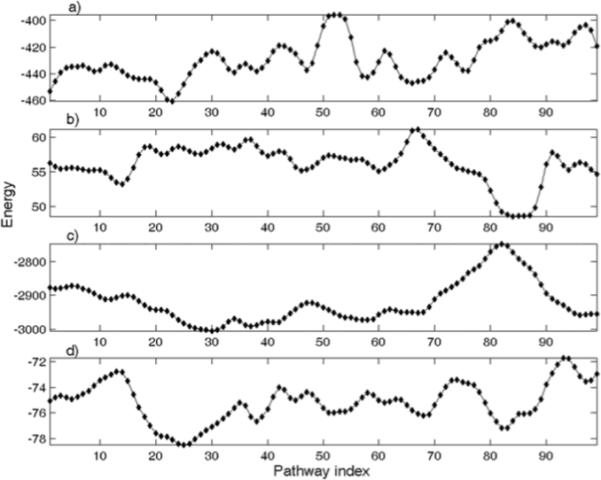
Free energies of conformational transition intermediates evaluated by knowledge-based statistical potentials a) short-range interaction energies; b) Miyazawa-Jernigan (MJ) two-body potential: eij'; c) MJ two-body potential: eij; d) four-body potential (SET1)
In Equation 4, short stands for short-range interaction energies, eij and eij' for two different MJ two-body contact potentials, and 4body for our four-body contact potentials. The minimal energy region around the pathway indices from 20 to 33 in Figure 4 most likely represents intermediates with the LID domain closed and the NMP domain open, which is further supported by the correspondingly low CE RMSD between 1DVR (the semi-closed form) and the intermediates in this region.
The results in Figure 5 show that the general features of the transition can be captured with several different potentials. Some of the features present in the atomistically modeled CHARMM-based transition pathway (Figure 3) are also observed here, particularly the maximum near the closed form.
Figure 5.
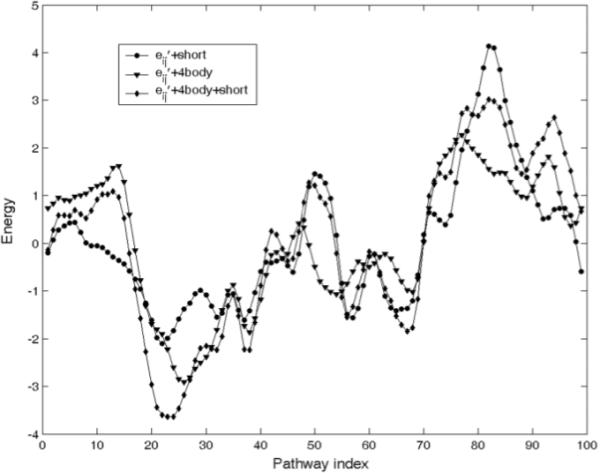
The combination of standardized energies from statistical potentials (computed from Eq. 4). Short: short-range interaction energies, eij': MJ two-body potentials, 4body: four-body contact potentials
Comparison of computational intermediates with experimental structures
We use combinatorial extension (CE) program2 to compare all the transition intermediates with various experimentally solved structures of AK in the PDB (http://www.pdb.org) (Figure 6, Figure 7 and supplementary materials). Here we show 7 crystal structures: 2RH5A, 2RH5B, 2RH5C, 1AK2, 1DVRA, 2AK3A, and 1E4YA, in Figure 7 to compare the computationally generated intermediates with experimentally determined structures. Among them, 2RH5 is from hyperthermophilic E. coli42,43,44. 2RH5 is an interesting protein containing 3 chains which are conformational change intermediates of the ligand free AK44. 1AK2, 1DVR, and 2AK3 are semi-closed structures. 1AK2 and 2AK3 are AK isozymes existing in mitochondrial intermembrane space and mitochondrial matrix, respectively. 1DVR is the AK homolog from yeast. 1AK2 and 1DVR have the LID domain closed and the NMP domain open. 2AK3 has the LID domain open but the NPM domain closed. 1E4Y is AK mutant having 99% sequence identity with 4AKE and 1AKE and is closed form of AK binding with AP5A.
Figure 6.
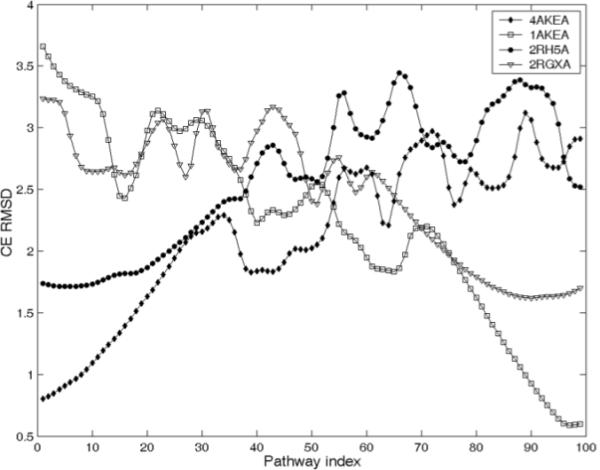
The CE RMSD between all pathway intermediates and the PDB structures. 2RH5 and 2RGXA have same sequence and their sequence identity with 4AKE and 1AKE is 43%. The closest pathway intermediates are identified by k-means clustering and results are shown in Table 1. (CE RMSD along the pathway for other known PDB structures shown in Figure 1 and Figure 2 are shown in supplementary materials)
Figure 7.
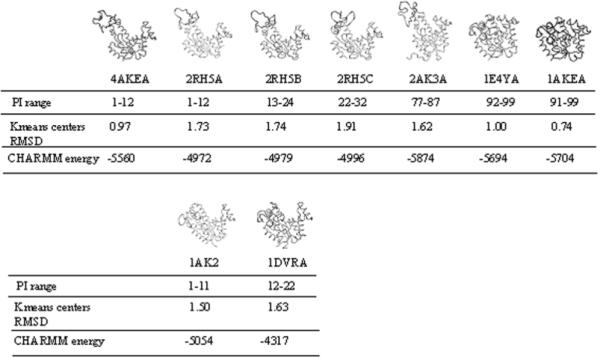
The conformational transition pathway represented by PDB structures of AK. The closest pathway index ranges (PI ranges) and the CE RMSD of the K-means centers corresponding to each PDB structures shown in Table 1 are listed. 2RH5 is from a hyperthermophilic E. coli. 1AK2 and 2AK3 are AK isozymes existing in mitochondria. 1DVR is an AK homolog from yeast. 1E4Y is an AK mutant having 99% sequence identity with 1AKE and 4AKE.
We use CE structural alignment to find the transition intermediates closest to those PDB structures. The CE RMSD results usually show that a cluster of consecutive intermediates has similar CE RMSD, which motivates us to use clustering algorithm to find pathway index ranges (PI ranges) representing a cluster of consecutive intermediates closest to PDB structures. Here we use the simplest unsupervised clustering algorithm, the K-means clustering, to classify transition intermediates into different groups according to the CE RMSD and the pathway indices. K-means algorithm assigns all data to k groups by iteratively moving the K-means centers and minimizing the square error function. The transition intermediates in the cluster having lowest CE RMSD of the K-means center are chosen as the closest intermediates for a given pathway index range.
2RH5 is the structural homolog of 1AKE and 4AKE having 43% sequence identity. Chains A, B and C in the ligand-free PDB structure: 2RH5 strikingly have significantly different conformations mainly caused by hinge-bending, and clearly they are in the order from the open to the closed form44. The CE structure alignment results in Figure 6 shows that 2RH5A, the chain closest to the open form 4AKE, has the lowest CE RMSD to the pathway intermediates near the open form AK. The lowest CE RMSD regions for chains B and C move forwards. For the closed AK homolog having the same sequence as 2RH5, 2RGXA, the lowest CE RMSD region is located near the closed form 1AKE (see Figure 2 in supplementary materials). We compared the CE RMSD results in Figure 6 with the data from Figure 3 of the plastic network model (PNM) paper34, and found that the pathway intermediates on the closed end of the trajectory generated by ENI are closer to the PDB structures: 1E4Y, 1ANK and 2ECK than those obtained with the PNM method. The transition intermediates with pathway indices around 30-60 generated by both ENI and PNM show similar CE RMSD results to the known PDB structures, such as 2AK2 and 1DVR (see Figure 3 in the supplementary materials for this comparison).
We further use K-means algorithm to identify the transition intermediates having lowest CE RMSD to the PDB structures by finding the cluster having lowest CE RMSD of K-means centers (Table 1 and Figure 7). For chain A, B and C of 2RH5, the PI ranges corresponding to the lowest CE RMSD of K-means centers are 1-12, 13-24, and 22-32, respectively, and the PI range for 2RGX is 89-99. We can find that these regions actually have lower energies by referring to Figure 3 here and Figure 1 in supplementary materials. Therefore the transition intermediates in these PI ranges may reliably represent the stable conformational change intermediates in the physiological environment.
Table 1. The summary of K-means clustering results for 2RH5A, 2RH5B, 2RH5C and 2RGXA from hyperthermophilic E. coli.
The columns having lowest CE RMSD of K-means centers are show in bold representing the PI ranges closest to the corresponding PDB structures. PI: pathway index; RMSD: RMSD (in Å) reported by CE program.
| Cluster ID | 1 | 2 | 3 | 4 | 5 | 6 | 7 | 8 | 9 | 10 | ||
|---|---|---|---|---|---|---|---|---|---|---|---|---|
| 2RH5A | PI range | 1-12 | 13-24 | 25-35 | 36-45 | 46-54 | 55-63 | 64-71 | 72-80 | 81-90 | 91-99 | |
| Kmeans centers | RMSD | 1.73 | 1.86 | 2.24 | 2.67 | 2.60 | 3.09 | 3.21 | 2.81 | 3.27 | 2.95 | |
| PI | 6.5 | 18.5 | 30 | 40.5 | 50 | 59 | 67.5 | 76 | 85.5 | 95 | ||
| 2RH5B | PI range | 1-12 | 13-24 | 25-36 | 37-47 | 48-57 | 58-66 | 67-75 | 76-84 | 85-92 | 93-99 | |
| Kmeans centers | RMSD | 1.77 | 1.74 | 1.98 | 2.36 | 2.32 | 2.61 | 2.75 | 3.13 | 3.25 | 2.36 | |
| PI | 6.5 | 18.5 | 30.5 | 42 | 52.5 | 62 | 71 | 80 | 92 | 99 | ||
| 2RH5C | PI range | 1-10 | 11-21 | 22-32 | 33-42 | 43-52 | 53-61 | 62-70 | 71-79 | 80-89 | 90-99 | |
| Kmeans Centers | RMSD | 1.97 | 1.99 | 1.91 | 2.19 | 2.52 | 2.75 | 2.66 | 2.81 | 3.05 | 3.01 | |
| PI | 5.5 | 16 | 27 | 37.5 | 47.5 | 57 | 66 | 75 | 85 | 95 | ||
| 2RGXA | PI range | 1-9 | 10-18 | 19-28 | 29-38 | 39-48 | 49-57 | 58-67 | 68-77 | 78-88 | 89-99 | |
| Kmeans centers | RMSD | 3.02 | 2.66 | 2.82 | 2.88 | 3.04 | 2.58 | 2.50 | 2.08 | 1.72 | 1.64 | |
| PI | 5 | 14 | 23.5 | 33.5 | 43.5 | 53 | 62.5 | 72.5 | 83 | 94 | ||
1AK2 and 2AK3 are adenylate kinase isozymes that have 52% and 44% sequence identity with 1AKE and 4AKE, respectively. 1DVR is the structure of a mutant adenylate kinase ligated with an ATP analogue and therefore the LID domain of 1DVR is closed. The sequence identity of 1DVR with 1AKE and 4AKE is 45%. Our results from structural alignments using the CE program show that the PDB structure 1AK2 with the LID domain closed and the NMP domain open has the best structural similarity to the transition intermediates near the starting points (Figure 2 in supplementary materials). For the other semi-closed structure 1DVR, our results show that intermediate with PI = 9 has the lowest RMSD (1.39 Å) and then it reaches plateau between indices 10 and 35 with an average RMSD 1.6 Å. 2AK3 with the NMP domain closed and the LID domain open is a different type of semi-closed structure and has the closest structure similarity with intermediates with PI 76-80. And the CE RMSDs for them are all 1.59 Å. The PI ranges (Figure 7) for 1AK2, 1DVR and 2AK3 are 1-11, 12-22 and 77-87 respectively. By combining energy profiles shown earlier (Figures 3 and 5) and the CE RMSD results (Figure 7), we find that PI ranges usually have lower energies except for 2AK3. These three PDB structures in this group are all semi-closed conformations, which possibly account for the smaller ratio between the open and closed populations and may not be accurately explained by the oversimplified two-state model43,44.
The sequence of the PDB structure 1E4Y in the second group only differs in one residue from the sequences of 1AKE and 4AKE. This structure is in closed form with both the LID domain and the NMP domain closed upon binding with AP5A. We also performed CE structural alignments for other PDB structures with identical sequence or differing by single residue and found that the results are highly similar to 1E4Y. Therefore we only show the results for 1E4Y here. 1E4Y have highly similar CE RMSD plot to 1AKE, and both of them reach their lowest RMSD near the ending point (Figure 2 in supplementary material).
The known PDB structures in Figure 7 are arranged along the transition pathway from the open form AK to the closed form AK. The CHARMM energies of these structures show that 1AKE (closed) and 4AKE (open) have lower energies than other known PDB structures corresponding closely to the different ranges of intermediates (see the PI ranges in Figure 7), which is consistent with the CHARMM energies of all the calculated intermediates (Figure 3, grafted from 4AKE). The k-mean centers RMSDs (Figure 7) inform us about how close the known PDB structure is to the intermediates (see the PI ranges in Figure 7). 2AK3A is an exceptional case having a lower CHARMM energy, but corresponding to the range 77-87 of the intermediate pathway, which is in the range of the energy barrier region of the transition pathway (Figure 3).
Discussion
We use the ENI algorithm31,32 to generate the conformational transition pathways of AK involving only Cα atoms. By assuming that other atoms in each residue move collectively with the corresponding Cα atom, we construct fully atomistic models for all transition intermediates. We find that grafting atoms from the open form (the starting point) provides a reasonable way to compute the energy profiles. Recent studies have shown that the large-scale motions in ligand-free AK intrinsically have the preferred direction, which is proved using both experimental methods (X-ray crystallography, NMR and single molecule FRET) and computational methods (normal mode analysis and MD44). These results strongly support the ENI algorithm, which non-randomly generates the conformational transition pathway by interpolating linearly between the contact maps of the extrema.
Both physics-based empirical potential energy functions and knowledge-based statistical potential functions have been employed to evaluate the energy profiles of the generated transition intermediates. Energies computed by using the CHARMM force-field presumably correctly show two low energy regions near the starting and ending points of the pathway, and the transition energy barrier located nearer to the end point, which is consistent with a previous study by Maragakis and Karplus35. The reason for of the failure of the four-body and the two-body statistical potentials to capture the low energy region near the starting point may be that the open form is loosely packed with fewer inter-residue interactions which are required for good performance of four-body and two-body knowledge-based potentials. Solvent effects might be another important reason for the failure to identify the local energy minimum around the open form of AK. A recent study shows that solvent effects are important for the slow motions.45 However, both eij' and four-body contact potentials were able to find the intermediates around PI 20-30 corresponding to the PDB structure 1DVR, 2RH5B and 2RH5C (Figure 4).
Compared with previous studies of the conformational transition in AK, the CE RMSD values in this study are similar or smaller (for those intermediates on the last half of the trajectory) than those generated using the PNM35 (see Figure 7 or Figure 3 in the supplementary materials), and this may indicate that the known protein structures correspond more closely to intermediates along the transition pathway generated with the ENI model, especially for the intermediates near the closed form of AK.
Supplementary Material
Acknowledgements
It is a pleasure to acknowledge the financial support provided by the National Institutes of Health through grants 1R01GM081680, 1R01GM072014, and 1R01GM073095.
References
- 1.Kim MK, Jernigan RL, Chirikjian GS. Efficient generation of feasible pathways for protein conformational transitions. Biophysical Journal. 2002;83(3):1620–1630. doi: 10.1016/S0006-3495(02)73931-3. [DOI] [PMC free article] [PubMed] [Google Scholar]
- 2.Shindyalov IN, Bourne PE. Protein structure alignment by incremental combinatorial extension (CE) of the optimal path. Protein Engineering. 1998;11(9):739–747. doi: 10.1093/protein/11.9.739. [DOI] [PubMed] [Google Scholar]
- 3.Bairoch A. The ENZYME database in 2000. Nucleic Acids Research. 2000;28(1):304–305. doi: 10.1093/nar/28.1.304. [DOI] [PMC free article] [PubMed] [Google Scholar]
- 4.Shinozaki K, Dennis ES. Cell signalling and gene regulation - Global analyses of signal transduction and gene expression profiles - Editorial overview. Current Opinion in Plant Biology. 2003;6(5):405–409. doi: 10.1016/s1369-5266(03)00093-1. [DOI] [PubMed] [Google Scholar]
- 5.Witzany G. Life: The Communicative Structure. Libri BoD; Norderstedt: 2000. [Google Scholar]
- 6.Amos Linda A., Amos W. Gradshaw. Molecules of the Cytoskeletion. Guilford, LoC: 1991. QP552.C96A46. [Google Scholar]
- 7.Mallik R, Gross SP. Molecular motors: strategies to get along. Current Biology. 2004;14:R971–R982. doi: 10.1016/j.cub.2004.10.046. [DOI] [PubMed] [Google Scholar]
- 8.Smith AD, et al., editors. Oxford Dictionary of Biochemistry and Molecular Biology. Oxford University Press; 1997. [Google Scholar]
- 9.Garrett RH, Grisham CM. Biochemistry. Second Edition Saunders College Publishing; 1999. pp. 426–427. [Google Scholar]
- 10.Seeliger D, Haas J, de Groot BL. Geometry-based sampling of conformational transitions in proteins. Structure. 2007;15(11):1482–1492. doi: 10.1016/j.str.2007.09.017. [DOI] [PubMed] [Google Scholar]
- 11.Rahman A. CORRELATIONS IN MOTION OF ATOMS IN LIQUID ARGON. Physical Review a-General Physics. 1964;136(2A):A405–&. [Google Scholar]
- 12.Stilling Fh, Rahman A. IMPROVED SIMULATION OF LIQUID WATER BY MOLECULAR-DYNAMICS. Journal of Chemical Physics. 1974;60(4):1545–1557. [Google Scholar]
- 13.McCammon JA, Gelin BR, Karplus M. DYNAMICS OF FOLDED PROTEINS. Nature. 1977;267(5612):585–590. doi: 10.1038/267585a0. [DOI] [PubMed] [Google Scholar]
- 14.Brooks B, Karplus M. NORMAL-MODES FOR SPECIFIC MOTIONS OF MACROMOLECULES - APPLICATION TO THE HINGE-BENDING MODE OF LYSOZYME. Proceedings of the National Academy of Sciences of the United States of America. 1985;82(15):4995–4999. doi: 10.1073/pnas.82.15.4995. [DOI] [PMC free article] [PubMed] [Google Scholar]
- 15.Case DA. NORMAL-MODE ANALYSIS OF PROTEIN DYNAMICS. Current Opinion in Structural Biology. 1994;4(2):285–290. [Google Scholar]
- 16.Bahar I, Atilgan AR, Erman B. Direct evaluation of thermal fluctuations in proteins using a single-parameter harmonic potential. Folding & Design. 1997;2(3):173–181. doi: 10.1016/S1359-0278(97)00024-2. [DOI] [PubMed] [Google Scholar]
- 17.Haliloglu T, Bahar I, Erman B. Gaussian dynamics of folded proteins. Physical Review Letters. 1997;79(16):3090–3093. [Google Scholar]
- 18.Atilgan AR, Durell SR, Jernigan RL, Demirel MC, Keskin O, Bahar I. Anisotropy of fluctuation dynamics of proteins with an elastic network model. Biophysical Journal. 2001;80(1):505–515. doi: 10.1016/S0006-3495(01)76033-X. [DOI] [PMC free article] [PubMed] [Google Scholar]
- 19.Tirion MM. Large amplitude elastic motions in proteins from a single-parameter, atomic analysis. Physical Review Letters. 1996;77(9):1905–1908. doi: 10.1103/PhysRevLett.77.1905. [DOI] [PubMed] [Google Scholar]
- 20.Kmiecik S, Kolinski A. Folding pathway of the B1 domain of protein G explored by multiscale modeling. Biophysical Journal. 2008;94(3):726–736. doi: 10.1529/biophysj.107.116095. [DOI] [PMC free article] [PubMed] [Google Scholar]
- 21.Zhang J, Lu CJ, Chen K, Zhu WL, Shen X, Jiang HL. Conformational transition pathway in the allosteric process of human glucokinase. Proceedings of the National Academy of Sciences of the United States of America. 2006;103(36):13368–13373. doi: 10.1073/pnas.0605738103. [DOI] [PMC free article] [PubMed] [Google Scholar]
- 22.Sugita Y, Okamoto Y. Replica-exchange molecular dynamics method for protein folding. Chemical Physics Letters. 1999;314(1-2):141–151. [Google Scholar]
- 23.Schulze-Fiehn BG, Grubmueller H, Evanseck JD. Conformational flooding of carbonmonoxy myoglobin (MbCO) reveals functionally important large-scale motions. Abstracts of Papers of the American Chemical Society.1998. pp. U709–U709. [Google Scholar]
- 24.Bouvier B, Grubmueller H. Molecular dynamics study of slow base flipping in DNA using conformational flooding. Biophysical Journal. 2005;88(1):59A–59A. doi: 10.1529/biophysj.106.091751. [DOI] [PMC free article] [PubMed] [Google Scholar]
- 25.Arora K, Brooks CL. Large-scale allosteric conformational transitions of adenylate kinase appear to involve a population-shift mechanism. Proceedings of the National Academy of Sciences of the United States of America. 2007;104(47):18496–18501. doi: 10.1073/pnas.0706443104. [DOI] [PMC free article] [PubMed] [Google Scholar]
- 26.Pontiggia F, Zen A, Micheletti C. Small- and Large-Scale Conformational Changes of Adenylate Kinase: A Molecular Dynamics Study of the Subdomain Motion and Mechanics. Biophysical Journal. 2008;95(12):5901–5912. doi: 10.1529/biophysj.108.135467. [DOI] [PMC free article] [PubMed] [Google Scholar]
- 27.Takagi F, Kikuchi M. Structural change and nucleotide dissociation of myosin motor domain: Dual G(o)over-bar model simulation. Biophysical Journal. 2007;93(11):3820–3827. doi: 10.1529/biophysj.106.103796. [DOI] [PMC free article] [PubMed] [Google Scholar]
- 28.Zhang Y, Arakaki AK, Skolnick JR. TASSER: An automated method for the prediction of protein tertiary structures in CASP6. Gaeta, ITALY: Dec 04-08, 2004. pp. 91–98. [DOI] [PubMed] [Google Scholar]
- 29.Kolinski A. Protein modeling and structure prediction with a reduced representation. Acta Biochimica Polonica. 2004;51(2):349–371. [PubMed] [Google Scholar]
- 30.Yang L, Song G, Carriquiry A, Jernigan RL. Close correspondence between the motions from principal component analysis of multiple HIV-1 protease structures and elastic network modes. Structure. 2008;16(2):321–330. doi: 10.1016/j.str.2007.12.011. [DOI] [PMC free article] [PubMed] [Google Scholar]
- 31.Kim MK, Chirikjian GS, Jernigan RL. Elastic models of conformational transitions in macromolecules. Journal of Molecular Graphics & Modelling. 2002;21(2):151–160. doi: 10.1016/s1093-3263(02)00143-2. [DOI] [PubMed] [Google Scholar]
- 32.Kim MK, Jernigan RL, Chirikjian GS. Rigid-cluster models of conformational transitions in macromolecular machines and assemblies. Biophysical Journal. 2005;89(1):43–55. doi: 10.1529/biophysj.104.044347. [DOI] [PMC free article] [PubMed] [Google Scholar]
- 33.Kim MK, Jernigan RL, Chirikjian GS. An elastic network model of HK97 capsid maturation. Journal of Structural Biology. 2003;143(2):107–117. doi: 10.1016/s1047-8477(03)00126-6. [DOI] [PubMed] [Google Scholar]
- 34.Kim MK, Li W, Shapiro BA, Chirikjian GS. A comparison between elastic network interpolation and MD simulation of 16S ribosomal RNA. Journal of Biomolecular Structure & Dynamics. 2003;21(3):395–405. doi: 10.1080/07391102.2003.10506935. [DOI] [PubMed] [Google Scholar]
- 35.Maragakis P, Karplus M. Large amplitude conformational change in proteins explored with a plastic network model: Adenylate kinase. Journal of Molecular Biology. 2005;352(4):807–822. doi: 10.1016/j.jmb.2005.07.031. [DOI] [PubMed] [Google Scholar]
- 36.Zheng WJ, Brooks BR, Hummer G. Protein conformational transitions explored by mixed elastic network models. Proteins-Structure Function and Bioinformatics. 2007;69(1):43–57. doi: 10.1002/prot.21465. [DOI] [PubMed] [Google Scholar]
- 37.Gerstein M, Schulz G, Chothia C. DOMAIN CLOSURE IN ADENYLATE KINASE - JOINTS ON EITHER SIDE OF 2 HELICES CLOSE LIKE NEIGHBORING FINGERS. Journal of Molecular Biology. 1993;229(2):494–501. doi: 10.1006/jmbi.1993.1048. [DOI] [PubMed] [Google Scholar]
- 38.Feng YP, Kloczkowski A, Jernigan RL. Four-body contact potentials derived from two protein datasets to discriminate native structures from decoys. Proteins-Structure Function and Bioinformatics. 2007;68(1):57–66. doi: 10.1002/prot.21362. [DOI] [PubMed] [Google Scholar]
- 39.Miyazawa S, Jernigan RL. ESTIMATION OF EFFECTIVE INTERRESIDUE CONTACT ENERGIES FROM PROTEIN CRYSTAL-STRUCTURES - QUASI-CHEMICAL APPROXIMATION. Macromolecules. 1985;18(3):534–552. [Google Scholar]
- 40.Miyazawa S, Jernigan RL. Residue-residue potentials with a favorable contact pair term and an unfavorable high packing density term, for simulation and threading. Journal of Molecular Biology. 1996;256(3):623–644. doi: 10.1006/jmbi.1996.0114. [DOI] [PubMed] [Google Scholar]
- 41.Bahar I, Kaplan M, Jernigan RL. Short-range conformational energies, secondary structure propensities, and recognition of correct sequence-structure matches. Proteins-Structure Function and Genetics. 1997;29(3):292–308. doi: 10.1002/(sici)1097-0134(199711)29:3<292::aid-prot4>3.0.co;2-d. [DOI] [PubMed] [Google Scholar]
- 42.Henzler-Wildman K, Kern D. Dynamic personalities of proteins. Nature. 2007;450(7172):964–972. doi: 10.1038/nature06522. [DOI] [PubMed] [Google Scholar]
- 43.Henzler-Wildman KA, Lei M, Thai V, Kerns SJ, Karplus M, Kern D. A hierarchy of timescales in protein dynamics is linked to enzyme catalysis. Nature. 2007;450(7171):913–U927. doi: 10.1038/nature06407. [DOI] [PubMed] [Google Scholar]
- 44.Henzler-Wildman KA, Thai V, Lei M, Ott M, Wolf-Watz M, Fenn T, Pozharski E, Wilson MA, Petsko GA, Karplus M, Hubner CG, Kern D. Intrinsic motions along an enzymatic reaction trajectory. Nature. 2007;450(7171):838–U813. doi: 10.1038/nature06410. [DOI] [PubMed] [Google Scholar]
- 45.Hinsen K, Kneller GR. Solvent effects in the slow dynamics of proteins. Proteins-Structure Function and Bioinformatics. 2008;70(4):1235–1242. doi: 10.1002/prot.21655. [DOI] [PubMed] [Google Scholar]
Associated Data
This section collects any data citations, data availability statements, or supplementary materials included in this article.


