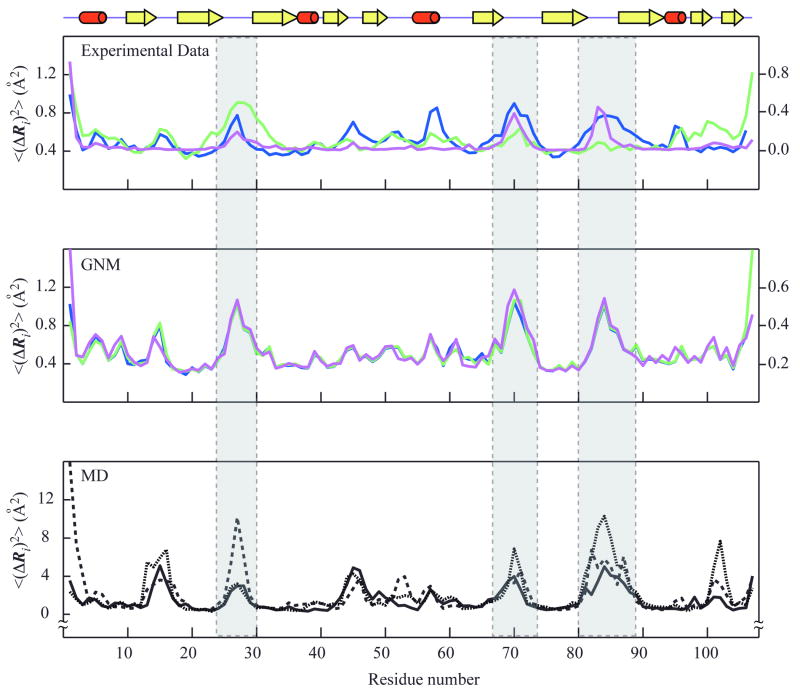
Figure 2. Mean-square fluctuations profiles of LKAMG from experimental data and computations.
The fluctuations in the positions of the residues, <(ΔRi)2>, are plotted as a function of residue position along the polypeptide chain, 1 ≤ i ≤ N. The upper panel displays the MSDs from experimental data, <(ΔRi)2>NMR, <(ΔRi)2>X1 and <(ΔRi)2>X2 colored magenta, blue and green, respectively. Crystallographic fluctuations are extracted from the B-factors, using Bi = (8 π2/3) <(ΔRi)2>, The left and right ordinates correspond to NMR and X-ray data, respectively. The middle panel displays the square fluctuations predicted by the GNM for the different structural models, <(ΔRi)2>GNM-N1 (magenta,), <(ΔRi)2>GNM-X1 (blue), and <(ΔRi)2>GNM-X2 (green). The lower panel shows the results from three MD runs, <(ΔRi)2>MD1 (solid black), <(ΔRi)2>MD2 (dotted black), and <(ΔRi)2>MD3 (dashed black). A schematic representation of the LKAMG secondary structure is displayed on top. The three loop regions are indicated by the gray columns.

