

Abstract
Theta (4–10 Hz) oscillations in the hippocampus are thought to be important for plasticity, temporal coding, learning, and memory. The hippocampal system has been postulated to have two (or more) rhythmic sources of theta oscillations, but little is known about the behavior-dependent interplay of theta oscillations in different subregions and layers of the hippocampus. We tested rats in a hippocampus-dependent delayed spatial alternation task on a modified T-maze while simultaneously recording local field potentials from dendritic and somatic layers of the dentate gyrus, CA3, and CA1 regions using high-density, 96-site silicon probes. We found that while theta oscillations were generally coherent throughout the hippocampus, the power, coherence, and phase of theta oscillations fluctuated in a layer-specific manner, confirming the presence of multiple interdependent dipoles. Layer-dependent changes in the power and coherence of theta oscillations varied with aspects of both the memory and control (non-mnemonic) tasks, but only a small fraction of the variance could be explained by running speed or acceleration. Furthermore, the phase lag between theta oscillations in the CA3 and CA1 pyramidal layers was significantly smaller on the maze arm approaching the T-junction than on other arms of the alternation task or on comparable segments of control tasks. Overall, our findings reveal a consortium of layer-specific theta dipoles (current sinks and sources) generated by the rhythmic flow of ions into and out of hippocampal cells. Moreover, our data suggest that these different theta generators flexibly coordinate hippocampal regions and layers to support behavioral task performance.
Keywords: hippocampal function, theta rhythm, oscillator, CA1, CA3, dentate gyrus, memory, synchrony, network
Introduction
The hippocampal theta rhythm is the most prominent clocking mechanism in the forebrain (Bland, 1986; Vanderwolf, 1988; Buzsáki, 2002). Due to the architectonics of the hippocampus, the rhythm (5–10 Hz in the rat) can be readily detected as a macroscopic local field potential (LFP) in the dorsal hippocampus during exploratory behavior and sleep (Grastyan et al., 1959; Vanderwolf, 1969). Theta oscillations are essential for the physiological operation of the hippocampus, and abolishing them results in severe behavioral deficits (Winson, 1978). The phasic patterning of neuronal activity provides spatiotemporal coding of information in the hippocampus (O'Keefe and Recce, 1993; Skaggs et al., 1996; Huxter et al., 2003, 2008). Furthermore, theta oscillations support the compression of representations carried by neuronal spiking from the time scale of behavior (seconds) into short (milliseconds) time scales (referred to as “temporal compression”) (Skaggs et al., 1996; Dragoi and Buzsáki, 2006), which may be important for spike timing-dependent plasticity (Magee and Johnston, 1995; Jensen and Lisman, 1996; Markram et al., 1997; Mehta et al., 1997) and for the proper temporal packaging and transfer of neuronal information (Hasselmo et al., 2002; Buzsáki, 2005).
The macroscopic theta LFP is the result of coherent membrane potential oscillations across large numbers of neurons in all hippocampal subregions (Fox, 1989; Soltesz and Deschênes, 1993; Ylinen et al., 1995; Kamondi et al., 1998). In the simplest model of theta generation, the medial septum functions as a temporal coordinator, or pacemaker (Stewart and Fox, 1990; Lee et al., 1994), and coherently entrains hippocampal networks. From this perspective, there is a single global theta rhythm. However, numerous experimental manipulations, including pharmacological interventions (Vanderwolf, 1988), deafferentation (Buzsáki et al., 1983; Bragin et al., 1995a), inactivation (Mizumori et al., 1990), intracellular/intradendritic recordings (Fox, 1989; Kamondi et al., 1998), multisite recording (Kocsis et al., 1999), current-source density (CSD) measurements (Brankack et al., 1993; Bragin et al., 1995a), in vitro studies (Konopacki, 1998; Gillies et al., 2002; Whittington and Traub, 2003; Traub et al., 2004), and computational modeling (L. W. Leung, 1984; Rotstein et al., 2005), indicate that at least two (Bland, 1986), but likely several (Buzsáki, 2002), rhythm-generating mechanisms and numerous theta current dipoles are at work.
Given the large number of anatomical substrates that can potentially generate theta currents, we hypothesized that theta oscillations do not function simply as a global clock, but instead, the varying coordination of the multiple sources of theta currents (Buzsáki et al., 1985) can serve different behaviors. To examine this hypothesis, we used high-density silicon probes to map the theta current distribution in the dentate–CA3–CA1 regions of the hippocampus (Montgomery et al., 2008) and examined the amplitude, frequency, phase, and coherence relationships among the postulated dipoles during various aspects of behavior. We found that the power, coherence, and phase of theta oscillations exhibit layer-specific changes that depend on behavioral task demands.
Materials and Methods
Animals and behavior.
Four Long–Evans rats (male, 300–400 g) were water deprived and trained to run in a hippocampus-dependent continuous delayed non-match-to-place (“alternation”) task (see Fig. 3A) (Ainge et al., 2007) and a control task. All rats performed the alternation task well (>85% correct). Rats were initially shaped in the alternation task with no delay period and were required only to run on the maze to receive water reward. When consistent maze running and approach to the water points was established, the water delivery on the side arms was gradually withdrawn for trials in which the rat did not alternate. After alternation performance was established, a 10 s delay was interposed between each trial to require engagement of hippocampal networks. To maintain consistent running on the maze without exploratory interruptions, a small water reward was delivered in the delay area and increased water rewards were given at the appropriate water port for uninterrupted trajectories. After learning the alternation task, rats were trained on a control task. The control tasks (see Fig. 5A) included a C-shaped (n = 2 rats) and a Z-shaped (n = 1 rat) linear track, requiring the rats to run back and forth for water reward, and a cue task (n = 1 rat) requiring the rat to run in a path similar to the alternation task, but on each trial the rat's trajectory was randomly cued left or right by a large block that was visible after the delay period. In fact, this block prevented the rat from fully entering one of the (right or left) maze arms, but we refer to it here as a “cue” because after initial training the rat ran swiftly through the T-junction onto the unblocked arm without stopping or attempting to enter the blocked arm. Rats were well trained on both alternation and control tasks (at least 30 d training with 20–50 trials/task) before obtaining recordings described here to avoid novelty effects (Jeewajee et al., 2008). To constrain the behavioral and cognitive variability, trials in which the rat engaged in rearing, excessive sniffing, grooming or immobility were eliminated from further analysis.
Figure 3.

Layer-specific changes in theta power during task performance. A, Rats were trained to perform a hippocampus-dependent, delayed spatial alternation task on a modified “T-maze.” Gray blocks were used to hold the rat during the delay. Blue dots indicate water ports. B, Example of running speed (cm/s) as a function of spatial position during performance of the alternation task. C, Group data histogram of running speeds observed in different regions of the maze (color-coded according to inset). D, Example regression analysis examining the relationship between running speed and LFP theta power (decibels, dB, 10 × log10) from selected CA1lm and DGgl recording sites. Note the highly significant regression slope (β value) between running speed and theta power in CA1lm, but nearly flat and nonsignificant slope for theta power in the DGgl. E, Single-animal example showing the anatomical profile of regression slopes between running speed and LFP theta power. F, Group statistics calculated separately for LFP (top) and CSD (bottom) showing regression slopes between running speed and theta power for each layer (median beta ± 95% bootstrapped error bars; *p < 0.01, Bonferroni-corrected nonparametric tests).
Figure 5.
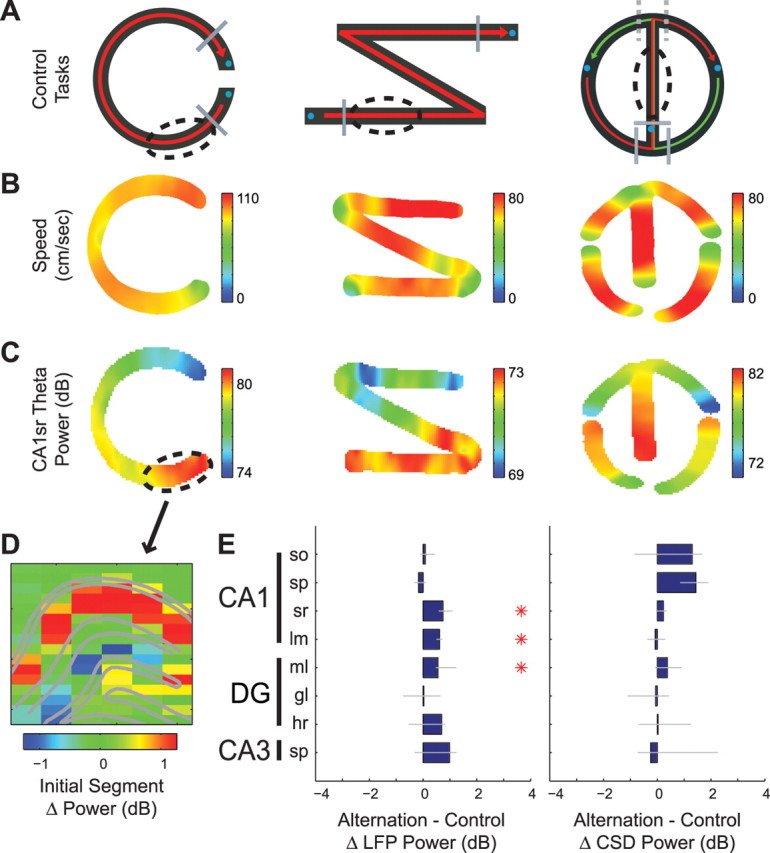
Performance in control tasks shows similar layer-dependent theta power fluctuations as the alternation task. A, Control tasks with no dependence on the hippocampus (see Materials and Methods). Left, C-shaped linear track requiring the rats to run back and forth for water reward (n = 2 rats). Middle, Z-shaped linear track requiring the rat to run back and forth for water reward (n = 1 rat). Right, Cue task requiring the rat to run in a path similar to the alternation task, but on each trial the rat's trajectory was randomly cued right or left by a large block (indicated by the dashed gray lines) that was visible after the delay period (n = 1 rat). Blue circles indicate location of water reward. Solid gray lines indicate borders of the delay area(s). Dashed ovals indicate regions of control tasks that were compared with the center arm of the alternation task. B, Average running speed maps (cm/s) in each of the control tasks for trials with running directions shown in A (unidirectional running shown for C- and Z-shaped mazes and both right and left turn trials for the cue task). C, Example of changes in LFP theta power from selected CA1sr sites during performance of control tasks on trials with running directions shown in A. Note increased theta power as the rat begins a journey to the reward port. D, Example anatomical profile of the change in LFP theta power on the initial segment (dashed oval in A) versus other portions of the C-maze task (initial − other segments). Note the somewhat selective increase in CA1sr theta power on the initial segment similar to the center arm effect in the alternation task. E, Group statistics comparing LFP (left) and CSD (right) theta power on the center arm of the alternation task versus the initial segment of each animal's respective control task (alternation − control, decibels, median ± 95% bootstrapped error bars; *p < 0.01, Bonferroni-corrected nonparametric tests).
Surgery.
After proficient maze running was established, recording and stimulation electrodes were implanted. A 96-site silicon probe was implanted on a movable drive in the right hemisphere parallel to the transverse axis of the hippocampus (45° parasagittal) with the outer shanks targeted at approximately AP −2.8 mm, ML 2.7 mm and AP −3.86 mm, ML 1.64 mm from bregma. Probes had recording sites spaced regularly over a 1.5 mm × 1.5 mm area with 6 shanks spaced at 300 μm, each with 16 recording sites at 100 μm spacing. DiI was applied to the probe before implantation to assist in histological analysis. A bipolar angular bundle (perforant path) stimulating electrode was implanted AP 1.0 mm, ML −1.0 mm from the junction between lambda and the right lateral ridge and DV −3.5 mm from the dura. A bipolar commissural stimulating electrode was implanted at AP −1.2 mm, ML −1.0 mm from bregma and −3.8 mm from the dura. Ground and reference screws were implanted in opposite hemispheres above the cerebellum.
Electrode localization.
Postmortem electrode location was verified using thionin, fluorescent Nissl (Invitrogen), or DAPI (Invitrogen) staining in combination with DiI (Invitrogen)-labeled electrode tracks. Prominent morphological features of the hippocampal anatomy were outlined for subsequent analysis of hippocampal physiological signals (Montgomery and Buzsáki, 2007; Montgomery et al., 2008). LFP ripple bursts (120–250 Hz) were detected on CA1 pyramidal layer sites and aligned to the depth negativity of the concomitant sharp wave for anatomical localization. Using a combination of the histology, ripple-triggered current source density (CSD), ripple power, perforant path-evoked CSD, dentate spike-triggered CSD, and multiunit activity (Bragin et al., 1995b; Csicsvari et al., 2003; Montgomery and Buzsáki, 2007; Montgomery et al., 2008), the anatomical location of recording sites could be determined to a high degree of accuracy (Bragin et al., 1995a), estimated to be approximately ±30 μm. First, histological sections were oriented to vertically position the probe shanks and major anatomical features of the histology were outlined. Subsequently, the anatomical features were overlaid on plots of the major physiological features and stretched in the x- and y-axes to achieve alignment. These were aligned on several criteria: (1) spectral power of ripples were maximal in CA1 pyramidal layer and sharp wave sinks were maximal in CA1 stratum radiatum (Csicsvari et al., 2000; Montgomery and Buzsáki, 2007; Montgomery et al., 2008), (2) perforant path-evoked currents and dentate spikes reversed polarity just dorsal to the dentate granule layer (Bragin et al., 1995b; Montgomery and Buzsáki, 2007), (3) in response to perforant path stimulation, monosynaptic population spikes (∼3 ms post stimulation) peaked in the dentate granule layer and subsequent disynaptic (∼5 ms) population spikes peaked in the CA3 pyramidal layer, and (4) recording sites with high multiunit activity reliably followed the cell body layers (McNaughton and Barnes, 1977).
Data acquisition and analysis.
Neurophysiological signals were acquired continuously at 20 kHz on two synchronized 64-channel DataMax systems (16-bit resolution; RC Electronics). Local field potentials were downsampled to 1.25 kHz for further analysis. For tracking the position of the animals, two small light-emitting diodes (11 cm separation), mounted above the headstage, were recorded by a digital video camera and sampled at 30 Hz. Stable recording sessions in which the silicon probe shanks spanned the CA1, CA3, and dentate gyrus somatic layers, were analyzed using custom-written Matlab-based software (The MathWorks). Recording site irregularities (including cross talk and excessive impedances) were a priori identified and removed from analysis using measures of coherence and normalized power similarity (Diba et al., 2005). Specifically, at several stereotaxic depths in the brain, we calculated the coherence and normalized power similarity for all channel pairs at different physiological frequencies. By averaging these measures across different positions of the electrode in the brain, including the neocortex and corpus callosum, the anatomical connectivity of the brain was averaged out to unveil the limitations of the recording sites. Outlier recording sites that exhibited concordance with other sites at exceptionally high (possibly due to cross talk) or exceptionally low (due to excessive impedance) levels relative to baseline volume conduction were designated as “bad sites” and removed from further analysis. The CSD was calculated by standard methods (2B − A − C, for three adjacent sites) (Mitzdorf, 1985) and spatially smoothed using a normalized [1 2 1] filter (Isomura et al., 2006). Typically, a single bad site was surrounded by good sites and was linearly interpolated before CSD calculation to avoid false-positive detection of current sinks/sources. Two adjacent bad sites in the middle of a silicon probe shank were interpolated in four instances (each in different layers) to use remaining sites on the shank. CSD calculations centered on bad sites were excluded from further analysis. Occasionally, a group of nearby sites were defective and a portion of the silicon probe, or, in two cases, the entire silicon probe shank was excluded from analysis. In total, 11–19 LFP measurements and 5–19 CSD measurements were a priori selected from each layer for further analysis (see below, Statistics) (Montgomery and Buzsáki, 2007; Montgomery et al., 2008). For unit analysis, the wide-band signals were digitally high-pass filtered (0.8–5 kHz) and automatically spike sorted using KlustaKwik (Harris et al., 2000), followed by manual adjustment of the clusters (using the Klusters software package) (Hazan et al., 2006). Pyramidal cells and interneurons were separated on the basis of their autocorrelograms, waveforms, and mean firing rates (Csicsvari et al., 1999; Barthó et al., 2004).
Spectral analysis.
Theta power, frequency, coherence, and phase analysis was performed using Morlet wavelet analysis (courtesy of Aslak Grinsted) and multitaper Fourier analysis (Mitra and Pesaran, 1999). To avoid contamination from frequency shifts of theta oscillations across behaviors, the value of each spectral measure was taken at the peak theta frequency calculated from a selected CA1lm channel (typically exhibiting the most robust spectral theta peak; see Fig. 1 legend for a list of anatomical abbreviations). Theta oscillations under the present behavioral conditions consistently had a spectral peak within the 6–12 Hz range, most commonly 8–9 Hz. Similar results were obtained using spectral estimates integrated over the 6–12 Hz range. To avoid differential behavioral bias in the spectral estimate and statistical dependence due to overlapping time windows, on each trial a 0.5 s window was sampled separately from the center of each maze segment (as shown in Fig. 4A). Theta power, frequency, coherence, and phase were independently calculated for each window and tapered by a normalized Hann window to remove edge effects (center-weighted average) (Mitra and Bokil, 2008). Running speed and acceleration were similarly estimated by averaging over a tapered 0.5 s window. Coherence was calculated on the CSD estimates to avoid contamination from volume conduction (Fig. 1F) and was calculated for all channels with respect to one channel from each specified anatomical layer. To perform unit analysis, for each cell 0.5 s epochs with at least 4 spikes were detected. From these epochs, cells with at least 5 Hz average firing were included in spectral analysis (similar results were obtained with different rate thresholds).
Figure 1.
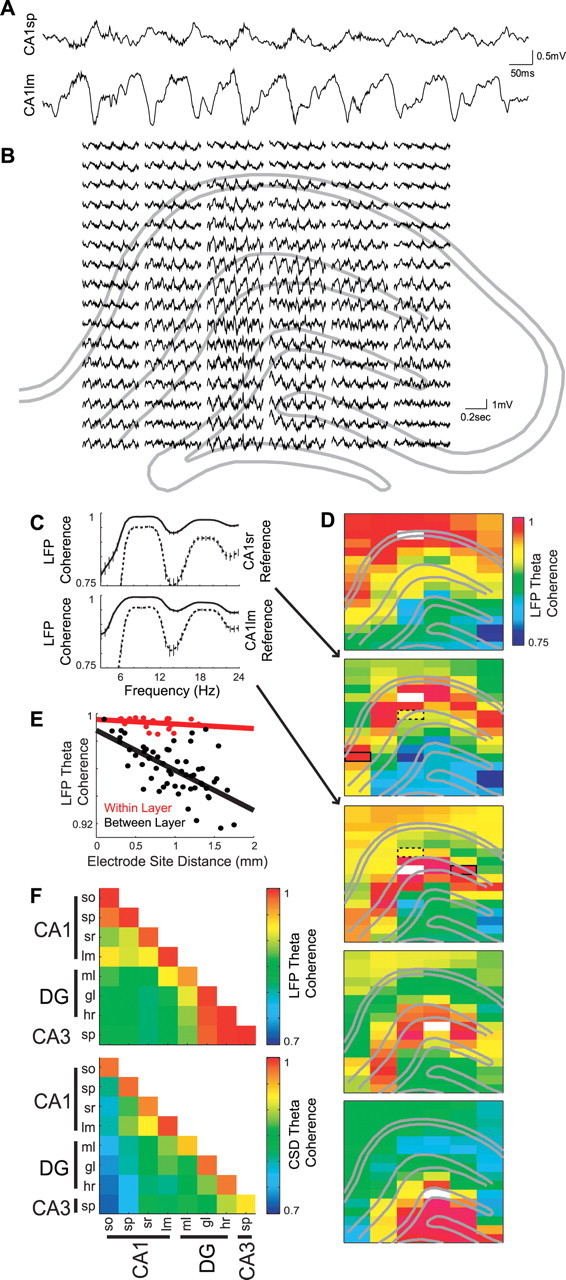
Layer-specific synchrony of hippocampal theta oscillations. A, One second epoch of LFP traces recorded from CA1 stratum pyramidale (CA1sp) and str. lacunosum-moleculare (CA1lm) during running. B, Example LFP traces (0.5 s) from all 96 silicon probe recording sites (6 shanks at 300 μm spacing, each with 16 recording sites at 100 μm spacing). Traces are centered on the estimated recording location with respect to the hippocampal anatomy (gray lines) according to several measures of evoked and spontaneous activity, including perforant path stimulation, sharp wave-ripple activity, and unit firing (Montgomery and Buzsáki, 2007; Montgomery et al., 2008). C, LFP coherence spectra between selected sites (shown in D) within the same layer (solid lines) and between different layers (dotted lines; ±99% jackknife error bars). Note high within-layer coherence in the frequency range of theta (6–12 Hz) and its second harmonic. D, Single-animal example showing the anatomical profile of LFP theta coherence between selected reference sites (white rectangles) and all other recording sites. Dotted and solid rectangles indicate sites shown in C. Note the high coherence of theta oscillations between distant sites (1 mm or more) within the same layer compared with the lower coherence between nearby sites (≤0.2 mm) in different layers. E, Group statistics showing the average within-layer (red) and between-layer (black) coherence as a function of distance between recording sites. The between-layer regression slope was significantly more negative than the within-layer slope (p = 1.9 × 10⁻⁹). Similar results were obtained regardless of whether only channels in the middle of each layer were a priori selected from each shank and included in the analysis (see Materials and Methods), or whether all functioning sites that could be a priori assigned to an identified layer were included (as shown in the regression plot). F, Group data showing the average LFP (top) and current-source density (CSD; bottom) coherence for all layer–layer pairs. Note the high coherence values on the diagonal reflecting the strong within-layer coherence. Also note the higher LFP coherence between CA1or/sp and between DGgl/hr/CA3sp layers, likely reflecting volume conduction, compared with the more layer-specific coherence of the CSD traces. Abbreviations in this and subsequent figures: DG, dentate gyrus; CA, cornu ammonis; so, stratum oriens; sp, stratum pyramidale; sr, stratum radiatum; lm, stratum lacunosum moleculare; ml, molecular layer; gl, granule layer; hr, hilar region.
Figure 4.
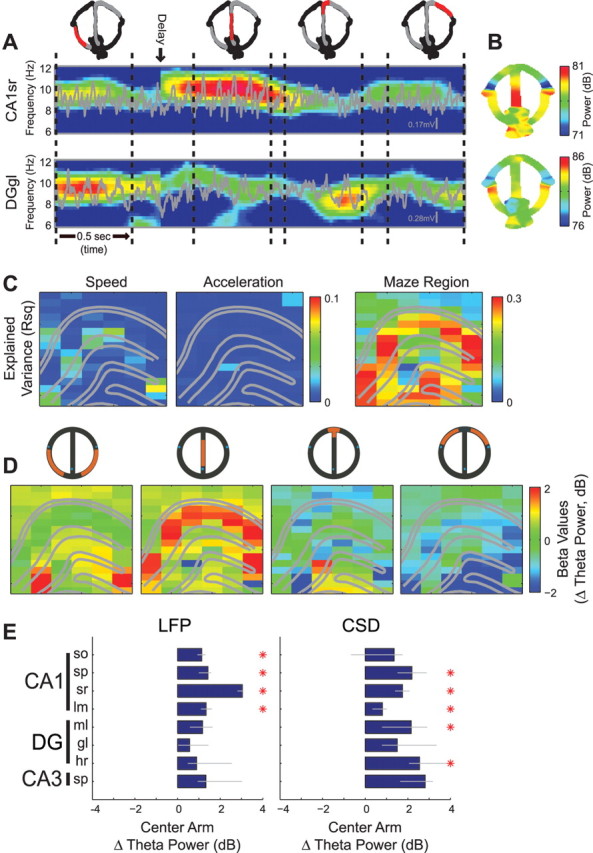
Maze region-dependent theta power fluctuations. A, Single-trial example of theta oscillations from recording sites in CA1sr and the DGgl. The raw LFP (gray) is overlaid on the spectrogram (color, same scale as in B). Black dotted lines delimit 0.5 s windows taken from each maze region for statistical analysis in C–E. Corresponding positions on the maze are shown above (red, sampled positions on each maze segment; gray, positions traversed during the period shown in the spectrogram; black, positions traversed over the entire recording session). The 10 s delay period has been omitted from this plot. Note the increased theta power in CA1sr but not the DGgl on the center arm of the T-maze. B, LFP theta power from the same layers as in A averaged over one recording session (20 trials) with respect to spatial position on the maze. C, D, Fit of theta power with a general linear model (GLM) was used to assess the contribution of various overt and covert variables. C, R2 of running speed and acceleration and maze region. Note that maze region explains substantial variance for CA1sr and some CA3sp/DGhr recording sites, while speed and acceleration explains very little (observe different scale bars). D, Beta values showing changes in LFP theta power across the different maze regions for an example recording session. E, Group statistics of theta power changes on the center arm versus other regions (center arm − other regions) across different anatomical layers (decibels, median ± 95% bootstrapped error bars; *p < 0.01, Bonferroni-corrected nonparametric tests) for LFP (left) and CSD (right). Note that this comparison does not include running speed/acceleration as separate explanatory variables, but similar results were obtained when these variables were included (supplemental Fig. 3A,B, available at www.jneurosci.org as supplemental material).
Statistics.
To perform group statistics, up to one site per silicon probe shank was a priori chosen to represent each anatomical layer [based on above electrode localization; also see Montgomery and Buzsáki (2007)]. Choosing one site/shank from the middle of each layer ensured greater statistical independence of layer sampling (at least 300 μm between sites) and prevented contamination from sites on the border between two layers. The spectral power was converted to decibels (10 × log10), and the coherence was transformed by the hyperbolic arc tangent such that the sample distributions would approximate a Gaussian (Thomson and Chave, 1991). Circular theta phase data were linearized for each channel pair by subtracting the trial-by-trial phase estimates in each behavioral condition from the grand mean theta phase over all conditions. Fitting data from correct trials in the alternation task (errors were rare and often associated with exploratory behavior), the distribution of spectral estimates (power, frequency, coherence, phase) for each electrode site was fit with a linear model (MatLab, ANOVAN, Type 3 SS): T = βconstant + βrunning speed + βrunning acceleration + βmaze region (4 arms) + ε.
To perform group statistics across animals, resulting beta (β) values from one electrode site per shank per animal were sampled from each layer (Montgomery and Buzsáki, 2007). The resulting sampled distribution of beta values from each anatomical layer was subsequently tested for a statistical difference from zero (nonparametric sign tests, p < 0.01, Bonferroni corrected, typically n = 5–19 for power/frequency comparisons, n = 5–34 for coherence/phase comparisons). The assumptions of the general linear model, including normality of residuals, absence of interaction effects, and uncorrelated residuals, were assessed. For simple comparisons including only a single two-way categorical variable (e.g., alternation vs control), a simple difference score across behaviors was calculated for each channel, and the resulting distribution of scores within each layer was tested for a statistical difference from zero similar to above.
Results
A consortium of multiple dipoles generates field theta oscillations
LFPs and unit activity were recorded simultaneously from the dentate gyrus, CA3, and CA1 regions of the dorsal hippocampus using a two-dimensional silicon probe array with 96 monitoring sites (Csicsvari et al., 2003; Montgomery and Buzsáki, 2007; Montgomery et al., 2008). To observe sustained theta oscillations, rats (n = 4) were tested during running on an elevated maze (Montgomery and Buzsáki, 2007). Consistent with previous studies, the largest amplitude theta waves were observed in the CA1 str. lacunosum-moleculare (Fig. 1A,B) (Buzsáki et al., 1986; Brankack et al., 1993). Theta oscillations during running were asymmetric, giving the appearance of saw-tooth waves and producing significant harmonics (16–20 Hz) in both power and coherence spectra (Fig. 1C). The waveforms varied as a function of both behavior and recording site, with the hilar region exhibiting the most sinusoid patterns. Although theta LFP and local currents (current source density, CSD) (Mitzdorf, 1985) were remarkably coherent across the CA1, CA3, and dentate regions (>0.7) (Fig. 1C–F), attenuation of coherence with distance was lower within a layer versus across different layers (Fig. 1C–E). Whereas theta waves recorded from sites within the same layer were highly coherent (>0.98) regardless of the distance, coherence between sites in different layers decreased substantially with distance (∼0.03/mm) (Fig. 1E). The within versus between layer coherence difference was statistically confirmed as significant interaction effect (p = 1.9 × 10⁻⁹) using regression analysis, which compared the attenuation of coherence as a function of intersite distance for within-layer versus between-layer pairs (i.e., slopes in Fig. 1E were significantly different). A similar interaction effect was observed when only adjacent layers were included in the analysis (p = 2.9 × 10⁻⁴). Furthermore, CSD signals exhibited a similar interaction effect (p = 2.7 × 10⁻⁸), arguing against the possibility that these effects are merely due to the mixing of volume-conducted signals across the curvature of hippocampal layers. In fact, the contrast between the intralaminar and interlaminar distribution of coherence values was even more striking when the coherence of local currents, rather than that of the LFP, was used to generate the coherence maps (Fig. 1F). Given the laminar (layer-specific) distribution of intrahippocampal and extrahippocampal afferents (Amaral and Witter, 1995), this observation suggests that many, if not all, hippocampal layers may contribute a somewhat independent theta dipole (Fig. 1C–F), and that it is the summation of these dipoles that results in the mean field (LFP).
The relative timing of theta current sinks and sources within the same anatomical layer were similarly homogeneous, while current sinks and sources were shifted in time across different layers. Figure 2A shows the peak-triggered average of theta oscillations recorded from different portions of the hippocampus. To further examine the multiple theta dipoles in the hippocampus, we mapped the distribution of phase for both LFP and extracellular CSD (Fig. 2B–D). The phase versus depth profile of theta LFP revealed a gradual phase reversal from the CA1 str. oriens to the str. lacunosum-moleculare (Winson, 1978; Buzsáki et al., 1983, 1985, 1986; L. W. Leung, 1984; Brankack et al., 1993; Hasselmo et al., 2002), with further phase shifts in deeper layers (Fig. 2B,C). Up to 270° (−90°) shifts between the CA1 pyramidal layer and the hilar region were previously observed (Buzsáki et al., 1983, 1986). Because LFP can be contaminated by volume-conducted signals (Fig. 1F) (Bland and Whishaw, 1976), we also plotted the phase distribution of the theta CSD (Fig. 2B–D). Similar to LFP, a gradual phase reversal of the CSD traces was present from the CA1 str. oriens to the str. lacunosum-moleculare. In contrast to LFP, CSD phase plots showed large (up to 180°) phase jumps between the CA1 str. lacunosum-moleculare and the middle molecular layer of the dentate gyrus and significant shifts between the molecular layer and the hilus/CA3 pyramidal layer. For group analysis, phase distributions were calculated between a chosen recording site in each of the anatomical layers and sites in the same and other layers (see Materials and Methods, Statistics). As expected from the CSD coherence analyses, the theta phase differences within the same layer were consistently close to zero for both LFP and CSD (Fig. 2D, upward arrows). A notable exception was in the dentate molecular layer, which showed the lowest within-layer coherence (Fig. 1F) and large variability of theta current phases across experiments in both intralaminar and interlaminar comparisons (Fig. 2D). The distinct afferents to the outer, middle and inner portions of the molecular layers from the lateral and medial entorhinal cortex and the mossy cells of the hilus, respectively (Amaral and Witter, 1995), may be the source of the this variability. Unfortunately, the 100 μm spatial resolution of the silicon probes used in this study was not sufficient to segregate these potentially independent theta dipoles (supplemental Fig. 1, available at www.jneurosci.org as supplemental material).
Figure 2.
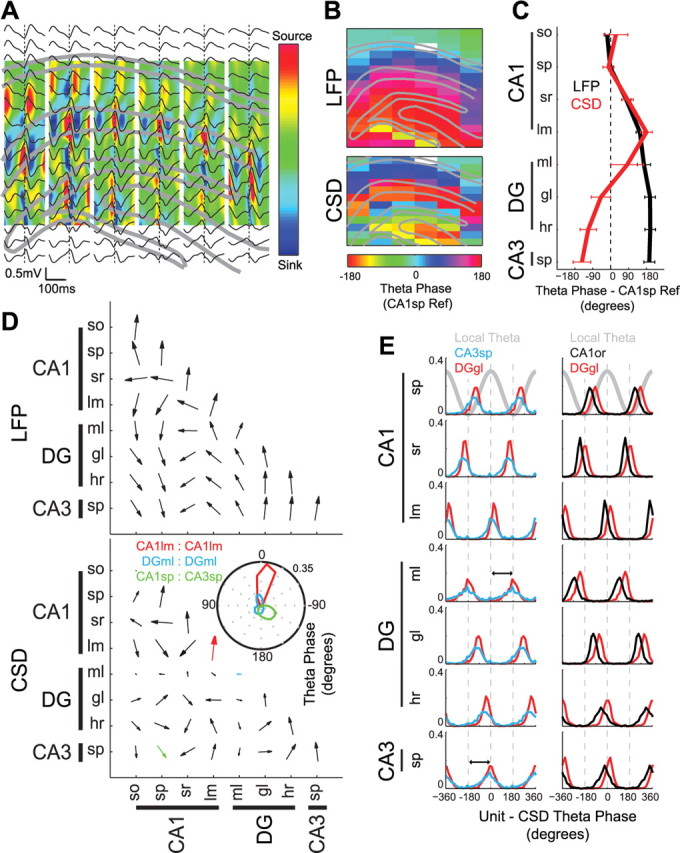
Phase relationships among multiple hippocampal theta current generators. A, Single-animal example of averaged LFP (black traces) and derived CSD (color; source, red; sink, blue) triggered on theta peaks from a selected CA1lm recording site overlaid on the hippocampal anatomy. B, Theta phase shift (degrees) for all LFP (top) and CSD (bottom) sites with respect to a single CA1sp reference site (white rectangle). Note the highly consistent phase shifts in each layer. C, Group data showing the average laminar phase shift of LFP (black) and CSD (red) theta oscillations with respect to a single CA1sp site for each animal (mean ± SEM). D, Group data showing the LFP (top) and CSD (bottom) theta phase relationships between all layer–layer pairs. Size of the arrow reflects the phase consistency across layer–layer pairs. Note large arrows with near-zero phase offset between sites within the same layer. Inset, Polar plots of specific layer–layer pairs. Note that the DGml shows a weak and variable phase relationship with other sites, possibly indicative of multiple theta dipoles in this layer (see also supplemental Fig. 1, available at www.jneurosci.org as supplemental material). E, Unit-CSD theta phase histograms for four example putative interneurons (recorded from CA3sp, DGgl, CA1or, and DGgl, respectively) in two animals (left and right columns). Note phase reversal of theta currents between CA1lm and DGml and between DGml and CA3sp (black arrows).
To verify and further investigate the local generation of the layer-specific dipoles, we examined the theta phase relationship of neuronal spiking to local currents. As expected from previous experiments, principal cells and interneurons showed a wide range of phase relationships to the theta CSD from different layers (Csicsvari et al., 1999; Klausberger and Somogyi, 2008). Theta phase histograms of example putative interneurons showed differential phase locking to CSD traces from different layers (Fig. 2E), with sharper tuning of some dentate interneurons to dentate/CA3 theta versus sharper tuning of some CA1 str. oriens interneurons to theta currents generated in the apical dendrites of CA1 (str. radiatum and str. lacunosum moleculare). Unit-CSD theta phase analysis further emphasized the multiplicity of phase shifted theta current dipoles in the dentate and CA3 regions, including clear phase reversal between theta currents in the molecular layer and str. lacunosum-moleculare and across the granule cell layer (Fig. 2E). Because probe shanks in all experiments were placed medially in the CA1-dentate axis and because the curved nature of the CA3 region confounds CSD analysis, the obtained information about CA3 theta dipoles was confined to the CA3c pyramidal layer. Future experiments may reveal the relationship among phase-shifted dipoles in the dendritic layers and in the different CA3 subregions. Overall, the above results support the hypothesis that LFP theta is a reflection of multiple theta dipoles (Figs. 1, 2). In turn, the multiple sources of somewhat independent theta generation (Fig. 1C–E) imply that cooperation of different dipoles in various combinations can support a rich variety of behaviors.
Layer-dependent modulation of theta oscillations by behavior
Previous research has shown that hippocampal field and unit activity can depend on behavioral movement patterns and speed (Whishaw and Vanderwolf, 1973; McNaughton et al., 1983; Buzsáki et al., 1985; Rivas et al., 1996; Montgomery and Buzsáki, 2007). To investigate this relationship further, we examined the relationships between physiological measures (theta power, frequency, coherence, and phase) and behavior in a hippocampus-dependent delayed spatial alternation task (Fig. 3A) (Ainge et al., 2007) and control tasks (see Fig. 5). We first examined the effect of running speed. Because running speed varied systematically in different segments of the maze (Fig. 3B,C), we applied statistical methods to disassociate the effects of motor behavior and environmental input variables on theta activity. Fitting theta power measurements from each recording site separately with a linear (regression) model including only running speed as an explanatory variable, we found that theta power in all CA1 layers reliably increased with higher speeds, while no other hippocampal layers showed significant changes with speed (Fig. 3D–F). We also found a significant correlation between running speed and theta frequency (supplemental Fig. 4, available at www.jneurosci.org as supplemental material), but this effect was not layer specific (Kruskal–Wallis tests, p > 0.1).
In addition to the speed–theta power relationship, we also observed that theta power exhibited a significant correlation with specific portions of the behavioral task, independent of running speed in those portions (Fig. 4.supplemental Fig. 3, available at www.jneurosci.org as supplemental material). Figure 4, A and B, shows that example recording sites in CA1 str. radiatum and the dentate gyrus granule layer can exhibit very different theta power modulation during performance of the alternation task. To assess the contribution of different behavioral and environmental components to theta power fluctuations, theta power was fit separately for each recording site with a general linear model (GLM), including as explanatory variables, running speed, acceleration, and maze region (see Materials and Methods and Montgomery and Buzsáki, 2007). In this expanded model, maze region explained substantially more theta power variance for most hippocampal layers (up to 30% of the variance), while running speed explained substantially less (∼5%) and for a limited number of layers (Fig. 4C). Figure 4D shows that even after removing the contribution of running speed and acceleration, there was a robust and selective increase in CA1 str. radiatum theta power on the center arm of the maze (similar to the gamma power increase in this portion of the alternation task reported in Montgomery and Buzsáki, 2007). Group statistics, shown in Figure 4E and supplemental Figure 3, A and B (available at www.jneurosci.org as supplemental material), confirm that the theta power increases on the center arm of the alternation task were differentially expressed across the laminar anatomy of the hippocampus (Kruskal–Wallis tests; LFP, p = 1.9 × 10⁻⁷; CSD, p = 3.9 × 10⁻³). Theta frequency also increased on the center arm of the alternation task (supplemental Fig. 4A,B, available at www.jneurosci.org as supplemental material), but unlike the layer-specific changes in theta power, the effect revealed no significant differences among hippocampal layers (Kruskal–Wallis tests, p > 0.1)
Although the GLM statistics are designed to segregate individual explanatory variables (Rencher, 2002), we performed additional control experiments to identify the contribution of speed, maze regions, and other potential variables to theta oscillations. In addition to the alternation task, each rat was trained and tested on one of three control tasks (Fig. 5A). Similar to the alternation task, CA1 str. radiatum theta power increased significantly on the initial segment of the control task immediately after the rat was released from the delay area, in a manner that did not follow changes in running speed (Fig. 5B–D). Direct comparison of the center arm of the alternation task to the corresponding initial segments in the control tasks revealed that while LFP theta power was statistically higher in some layers in the alternation task, the effect did not appear in the current source density analysis. Thus, while speed and acceleration cannot fully explain the increased theta power on the center arm of the alternation task, the effect may not be directly related to the mnemonic components of the alternation task either. This is in contrast to previously observed gamma power changes in the CA3/CA1 axis, which were found to be specifically related to alternation task performance (Montgomery and Buzsáki, 2007).
Comparing theta frequency in the alternation and control tasks, however, revealed significantly faster theta oscillations on the center arm of the alternation task than on comparable segments in the non-mnemonic control tasks (supplemental Fig. 4C,D, available at www.jneurosci.org as supplemental material). This suggests that the increased mnemonic demands of the alternation task may have some effect on theta frequency. However, the effect revealed no significant differences among hippocampal layers (Kruskal–Wallis tests, p > 0.1), suggesting that effects on theta frequency tend to occur more at a system-wide level.
Coherence of theta oscillations also showed layer- and maze region-specific changes. As can be seen in Figure 6A and supplemental Figure 3C (available at www.jneurosci.org as supplemental material), the largest theta coherence increase between theta dipoles of different layers was present in the central arm. Significant changes in coherence were observed in multiple layer comparisons (Fig. 6B,C). The largest coherence changes occurred with the dentate hilar region, which could reflect several mechanisms involving the dentate gyrus and/or CA3 networks. However, in contrast to previous gamma coherence results (Montgomery and Buzsáki, 2007), interlayer coherences were similar in the central arm of the alternation task and the initial segments of the control tasks (Fig. 6D). In addition to the center arm increase in coherence, there was a significant decrease in CA3sp theta coherence with most other layers and a widespread decrease in theta power when the rat approached the goal location in both alternation and control tasks (supplemental Fig. 3, available at www.jneurosci.org as supplemental material; Figs. 4B, 5C).
Figure 6.
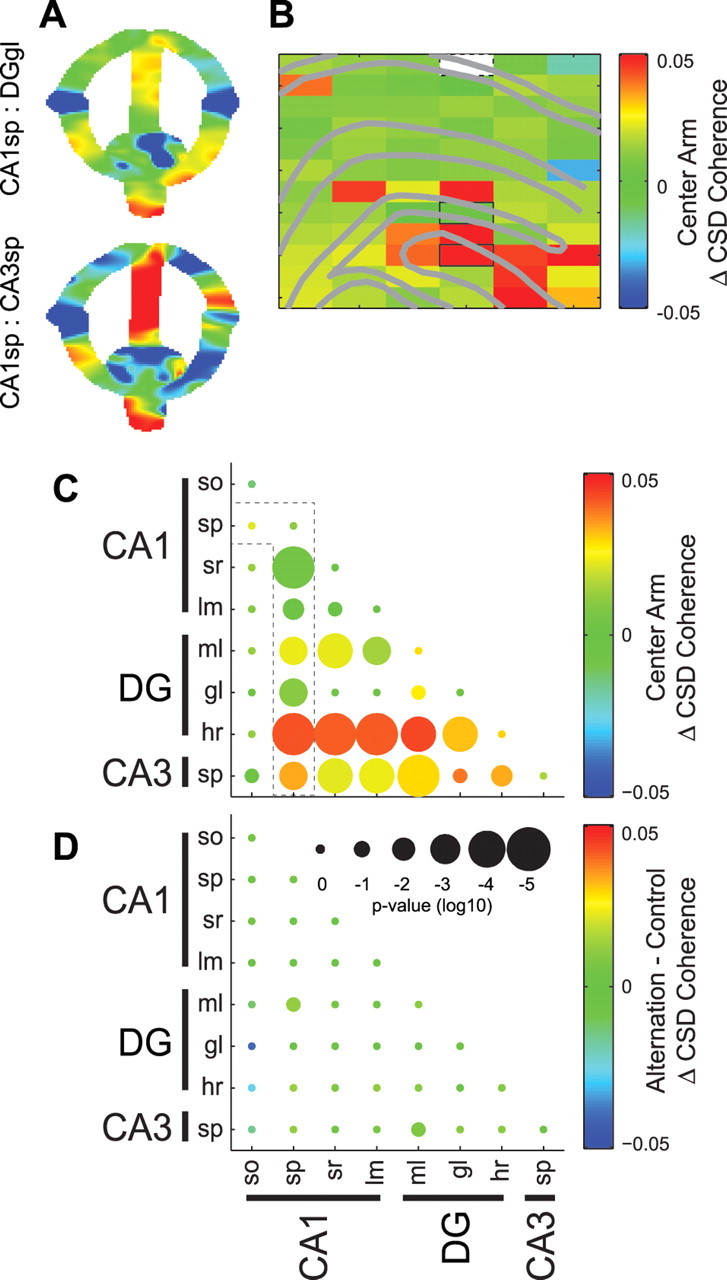
Layer-specific changes in theta coherence on the center arm of the alternation task. A, CSD theta coherence between a reference site in CA1sp (white rectangle in B) versus DGgl (top) or CA3sp (bottom) with respect to spatial position in the alternation task (color scale same as in B). B, Example anatomical profile showing the change in CSD theta coherence between CA1sp and all other hippocampal recording sites on the center versus other maze arms (center arm − other regions). C, Group statistics showing the center arm-associated change in CSD theta coherence between all hippocampal layer pairs. The color of each dot shows the median within-pair change in coherence, and size of the dot indicates the significance of Bonferroni-corrected nonparametric tests. The outlined comparisons correspond to the profile of changes in coherence with respect to the CA1sp shown in B. D, Group statistics comparing CSD theta coherence between the center arm of the alternation task and initial segment of the control tasks.
Because coherence is only an indicator of phase consistency, independent of the mean phase angle, we also examined whether the relative phase of theta oscillations in different hippocampal layers changed as a function of behavior. As shown in Figure 7, A and C, the phase offset between CA1sp and CA3sp theta was smaller in the center arm of the alternation task (approximately −90°) than in other maze segments (−120°). The anatomical profile of phase distribution in the central versus other segments further illustrates this shift (Fig. 7B,D) and indicates that the CA1 and CA3 regions may both contribute to the maze region-dependent phase shift. We also compared the theta phase shift between the alternation and control tasks (Fig. 7E–G). In contrast to the similarity in theta power and coherence across the alternation and control tasks, CA3sp theta phase relative to several other hippocampal layers was significantly different between the center arm of the alternation task and the initial segment of the control tasks (Fig. 7F). This task-dependent CA3–CA1 theta phase shift was consistently seen in all animals despite the fact that each rat ran one of three different control tasks. In the time domain, the example theta-peak triggered averages in Figure 7G show that the time lag between CA3sp and CA1sp theta oscillations was ∼7 ms shorter on the center arm of the alternation task. A similar CA3–CA1 theta phase shift was detected in the delay area, but was not found to be statistically reliable (supplemental Fig. 4A,B, available at www.jneurosci.org as supplemental material). Additionally, the shift in the alternation task could not be explained by running speed or acceleration (supplemental Fig. 4C, available at www.jneurosci.org as supplemental material), and comparing the initial segment versus other arms in control tasks revealed no significant theta phase shifts (supplemental Fig. 4D, available at www.jneurosci.org as supplemental material).
Figure 7.
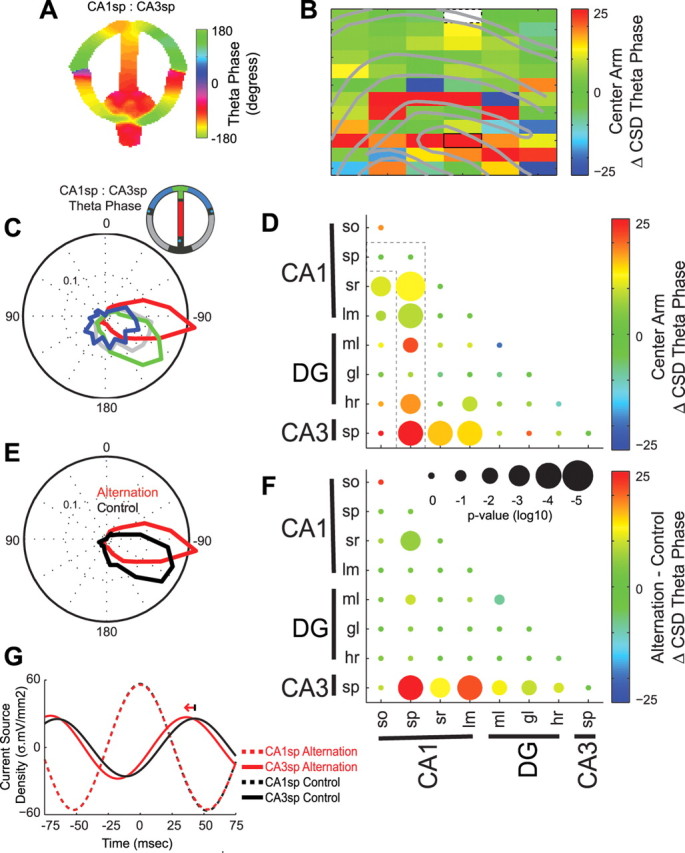
Task-dependent CA3 theta phase shift. A, CSD theta phase shift (degrees) between example CA1sp (reference) and CA3sp sites as a function of spatial position in the alternation task. B, Anatomical profile showing the change in CSD theta phase between an example CA1sp reference site (white) and all other sites on the center arm of the alternation task (center arm − other regions). The outlined site corresponds to that shown in A. C, Polar plot of theta phase (pooled over all 4 animals) between CA1sp and CA3sp in different regions of the alternation task (color-coded according to inset). Note the shorter phase lag between CA3 and CA1 theta on the center arm of the alternation task. D, Group statistics showing the center arm-associated change in CSD theta phase between all hippocampal layer pairs. The color of each dot shows the median within-pair change in phase, and size of the dot indicates the significance of Bonferroni-corrected nonparametric tests. The outlined comparisons correspond to the profile of changes in phase with respect to CA1sp shown in B. E, CSD polar plot of phase (pooled over all 4 animals) between CA1sp and CA3sp on the center arm of the alternation task versus initial segment of control tasks. F, Group statistics comparing CSD theta phase between the center arm of the alternation task and initial segment of the control tasks. G, Example CSD traces (filtered 6–12 Hz) from selected channels triggered by CA1sp theta peaks in the alternation and control tasks. Note in the alternation task how the CA3sp theta peak occurs ∼7 ms earlier (corresponding to 25° at 9 Hz) relative to the CA1sp theta oscillations.
Discussion
Using high spatial resolution recording of extracellular LFP, we found that within the global theta rhythm framework, theta current dipoles generated in the different anatomical layers of the hippocampus can vary somewhat independently from one another. Layer-specific fluctuations of theta power, intersite coherence, and phase were observed to differentially accompany aspects of performance in memory and control tasks. Although the activities of hippocampal theta dipoles are often interrelated, the present data suggest that different dipole combinations may be used to support flexible processing within the global theta system.
Multiple theta dipoles in the hippocampus
Theta currents may derive from intrinsic currents of neurons, such as burst-induced somatic hyperpolarization (Hu et al., 2007), dendritic Ca2+ spikes (Magee and Johnston, 1995; Schiller et al., 1997), and voltage-dependent membrane oscillations (Leung and Yim, 1986; Kamondi et al., 1998; Hu et al., 2007), or from synaptic currents. Outside the somatic region, each anatomically defined layer is characterized by the termination zone of glutamatergic excitatory afferents from specific cell populations (Lopes da Silva and Arnolds, 1978; Amaral and Witter, 1995). The coherent activity of each of these excitatory inputs forms an active sink at confined dendritic domains of the cytoarchitecturally organized hippocampal neurons. Early pharmacological and lesion studies have indicated that hippocampal theta is not a single oscillator but a result of two or more oscillators and current dipoles (Kramis et al., 1975; Lopes da Silva and Arnolds, 1978; L. S. Leung, 1984; Bland, 1986; Stewart and Fox, 1990; Lee et al., 1994). Expanding on previous observations (Buzsáki et al., 1986; Brankack et al., 1993; Kamondi et al., 1998), our data reveal patterns of theta coherence and phase that are highly layer specific (Figs. 1, 2), and suggest that many, if not all, hippocampal layers generate a theta current dipole that is somewhat independent from the global rhythm (Figs. 1–7). In fact, the number of current dipoles is actually higher than the number of layers because excitatory inputs to each layer are complemented by one or more families of interneurons with similar axonal projections (Freund and Buzsáki, 1996; Klausberger and Somogyi, 2008). By activating GABA receptors, layer-specific inhibitory dipoles generate local outward theta currents and compete with or reinforce the inward-directed excitatory currents, depending on their phase relationship (Buzsáki, 2002).
To explain the high within-layer theta coherence, one has to assume that the aggregate output of the afferent population is similar in each theta cycle, although individual neurons of the afferent population may vary in their theta phase preference. This was apparent in most layers, except for the dentate molecular layer. The large variability of theta phase and coherence in the dentate molecular layer (Figs. 1, 2; supplemental Fig. 1, available at www.jneurosci.org as supplemental material) may reflect the commixture of several different theta dipoles in this layer. These include putative dipoles elicited by projections from the medial and lateral entorhinal cortex to the middle and outer thirds of the molecular layer, respectively (McNaughton and Barnes, 1977) and mossy cell-derived associational/commissural inputs to the inner third of the molecular layer (Steward, 1976; Amaral and Witter, 1995). An additional excitatory dipole may be formed by the theta-rhythmic supramammillary projection (Kocsis and Vertes, 1997), terminating in the supragranular zone (Maglóczky et al., 1994; Leranth and Hajszan, 2007). This laminar organization of inputs is complemented by inhibitory theta dipoles formed by the layer-specific axonal arbors of HIPP (hilar perforant path-associated), HICAP (hilar commissural-associated pathway-related), and MOPP (molecular layer perforant path-associated) cells in the molecular layer, and basket and chandelier neurons with dense axonal terminals in the granule layer (Halasy and Somogyi, 1993; Freund and Buzsáki, 1996; Sik et al., 1997).
In addition to confirming the presence of independent sinks in CA1 str. lacunosum-moleculare and the dentate molecular layer (Buzsáki et al., 1986; Brankack et al., 1993), we found that these sinks alternated in phase (Fig. 2). A prediction of these observations is that layer III and layer II neurons of the entorhinal cortex, innervating CA1lm and the DGml respectively, discharge on the opposite polarity of the theta cycle. The phase-alternating sources in these respective layers may also reflect passive return currents of phase-shifted sinks from other layers or may be due to IPSCs produced by layer-specific interneurons (Gillies et al., 2002; Klausberger et al., 2003, 2004). Supporting this latter hypothesis, O-LM interneurons (Sik et al., 1995; Lawrence et al., 2006) were found to discharge at times of the maximum current source in CA1 str. lacunosum-moleculare (Klausberger et al., 2003). In most experiments, the theta sinks of lacunosum-moleculare were continuous with sinks in the outer molecular layer and counter in phase with theta currents in the middle molecular layer (Fig. 2), suggesting that layer II lateral and medial entorhinal neurons may fire on different phases of the theta cycle. Further phase shifts of theta cycles were present between the middle molecular layer, granule cell layer, hilus, and CA3 pyramidal layer (Fig. 2). Although the specific contribution of excitatory inputs and the numerous dentate interneurons (Amaral, 1978; Halasy and Somogyi, 1993; Sik et al., 1997) could not be identified, the observed phase shifts support the hypothesis that the large variability of theta phase in the molecular layer is due to the presence of multiple dipoles.
Task-dependent modulation of theta oscillators
A large number of overt and covert behaviors have been associated with hippocampal oscillations. These vary from the input function-related orienting response, to sensorimotor coordination, explicit output functions such as nonautomatic skeletal movement and to hidden variables including attention and volition (Miller, 1991; Vanderwolf, 2003; Buzsáki, 2005). Theta power has often been associated with the speed and/or acceleration of movement (Whishaw and Vanderwolf, 1973; McFarland et al., 1975; Rivas et al., 1996). However, the robustness of this correlation varies extensively across studies. Most recent studies, on the other hand, report rather complex relationships, including contextual effects such as running to or away from reward, motivation, or other task-related factors (Wyble et al., 2004; Sinnamon, 2005, 2006). A robust observation in the present study is that task parameters (e.g., maze region, task type) accounted for a much higher variance of theta power, coherence, and phase than running speed or acceleration (Fig. 4; supplemental Figs. 3, 5, available at www.jneurosci.org as supplemental material). These results emphasize the impact of sensory and/or cognitive factors on hippocampal theta oscillations and show that failure to carefully isolate these different factors can result in spurious correlations.
Similar to previously reported results on gamma oscillations (Montgomery and Buzsáki, 2007), the present results showed layer-specific increases in theta power and coherence on the center arm of the alternation task in a manner that could not be readily explained by running speed or acceleration (Figs. 4, 6; supplemental Fig. 3, available at www.jneurosci.org as supplemental material). Theta frequency also changed as a function of task performance, but exhibited more of a system-wide fluctuation, rather than layer-specific effects (supplemental Fig. 4, available at www.jneurosci.org as supplemental material). Unlike gamma oscillations, theta power and coherence increased on the initial segment of the control tasks after release from the delay area (Figs. 5, 6). These combined results suggest that CA3–CA1 gamma coordination may be related to mnemonic aspects of alternation task performance, such as memory retrieval (Montgomery and Buzsáki, 2007), while the observed changes in theta power and coherence might be related to aspects of task performance such as route planning or other functions common to trial initiation in both alternation and control tasks. However, similar to the behavioral profile of CA3–CA1 gamma coordination, CA3 theta oscillations exhibited an ∼25° phase shift on the center arm of the alternation task that did not accompany trial initiation in the control tasks (Fig. 7; supplemental Fig. 5, available at www.jneurosci.org as supplemental material). Computational models have suggested that encoding and retrieval may be separated on different phases of theta (Hasselmo et al., 2002), and behavior-dependent theta phase shifts have been previously reported during lever pressing versus running (Buzsáki et al., 1985) and as a function of encoding/retrieval (Manns et al., 2007) or learning/behavioral performance (Adey et al., 1960). Further experiments with higher spatial resolution sampling of LFP combined with unit recordings are needed to identify the mechanisms that govern coordination of different hippocampal regions during memory task performance.
The behavior-dependent layer specificity of theta oscillations also highlights the importance of recording theta oscillations from anatomically identified locations with a consistent (and distant) reference electrode to permit collected data to be compared across experiments and across laboratories. Locations such as the commonly used “fissure theta” may refer to any number of theta dipoles in neighboring layers, which can change with slight electrode movements (≤100 μm) from day to day without the experimenter's knowledge. On the other hand, the CA1 pyramidal layer is readily identifiable by the presence of unit activity and large “ripple” bursts during slow-wave sleep (Buzsáki et al., 1992; Ylinen et al., 1995; Csicsvari et al., 2003; Montgomery and Buzsáki, 2007; Montgomery et al., 2008) and can be used to calibrate LFP recordings in the hippocampus.
Overall, our study suggests that, rather than being a monolithic clock signal, hippocampal theta oscillations are created by a heterogeneous consortium of transmembrane currents, reflecting layer-specific processing that can be modulated by extrahippocampal inputs or differential modes of operation within the hippocampus.
Footnotes
This work was supported by the National Institutes of Health (NS34994, MH54671), the National Science Foundation (0613414), and the J. McDonnell Foundation. We thank Kamran Diba, Anton Sirota, Ken Harris, Andres Grossmark, Kenji Mizuseki, Simal Ozen, and Dave Sullivan for advice and support and Aslak Grinsted for providing wavelet coherence algorithms.
References
- Adey WR, Dunlop CW, Hendrix CE. Hippocampal slow waves. distribution and phase relationships in the course of approach learning. Arch Neurol. 1960;3:74–90. doi: 10.1001/archneur.1960.00450010074007. [DOI] [PubMed] [Google Scholar]
- Ainge JA, van der Meer MA, Langston RF, Wood ER. Exploring the role of context-dependent hippocampal activity in spatial alternation behavior. Hippocampus. 2007;17:988–1002. doi: 10.1002/hipo.20301. [DOI] [PubMed] [Google Scholar]
- Amaral DG. A golgi study of cell types in the hilar region of the hippocampus in the rat. J Comp Neurol. 1978;182:851–914. doi: 10.1002/cne.901820508. [DOI] [PubMed] [Google Scholar]
- Amaral DG, Witter MP. Hippocampal formation. In: Paxinos G, editor. The rat nervous system. New York: Academic; 1995. pp. 443–490. [Google Scholar]
- Barthó P, Hirase H, Monconduit L, Zugaro M, Harris KD, Buzsáki G. Characterization of neocortical principal cells and interneurons by network interactions and extracellular features. J Neurophysiol. 2004;92:600–608. doi: 10.1152/jn.01170.2003. [DOI] [PubMed] [Google Scholar]
- Bland BH. The physiology and pharmacology of hippocampal formation theta rhythms. Prog Neurobiol. 1986;26:1–54. doi: 10.1016/0301-0082(86)90019-5. [DOI] [PubMed] [Google Scholar]
- Bland BH, Whishaw IQ. Generators and topography of hippocampal theta (RSA) in the anaesthetized and freely moving rat. Brain Res. 1976;118:259–280. doi: 10.1016/0006-8993(76)90711-3. [DOI] [PubMed] [Google Scholar]
- Bragin A, Jandó G, Nádasdy Z, Hetke J, Wise K, Buzsáki G. Gamma (40–100 Hz) oscillation in the hippocampus of the behaving rat. J Neurosci. 1995a;15:47–60. doi: 10.1523/JNEUROSCI.15-01-00047.1995. [DOI] [PMC free article] [PubMed] [Google Scholar]
- Bragin A, Jandó G, Nádasdy Z, van Landeghem M, Buzsáki G. Dentate EEG spikes and associated interneuronal population bursts in the hippocampal hilar region of the rat. J Neurophysiol. 1995b;73:1691–1705. doi: 10.1152/jn.1995.73.4.1691. [DOI] [PubMed] [Google Scholar]
- Brankack J, Stewart M, Fox SE. Current source density analysis of the hippocampal theta rhythm: associated sustained potentials and candidate synaptic generators. Brain Res. 1993;615:310–327. doi: 10.1016/0006-8993(93)90043-m. [DOI] [PubMed] [Google Scholar]
- Buzsáki G. Theta oscillations in the hippocampus. Neuron. 2002;33:325–340. doi: 10.1016/s0896-6273(02)00586-x. [DOI] [PubMed] [Google Scholar]
- Buzsáki G. Theta rhythm of navigation: link between path integration and landmark navigation, episodic and semantic memory. Hippocampus. 2005;15:827–840. doi: 10.1002/hipo.20113. [DOI] [PubMed] [Google Scholar]
- Buzsáki G, Leung LW, Vanderwolf CH. Cellular bases of hippocampal EEG in the behaving rat. Brain Res. 1983;287:139–171. doi: 10.1016/0165-0173(83)90037-1. [DOI] [PubMed] [Google Scholar]
- Buzsáki G, Rappelsberger P, Kellényi L. Depth profiles of hippocampal rhythmic slow activity (‘theta rhythm’) depend on behaviour. Electroencephalogr Clin Neurophysiol. 1985;61:77–88. doi: 10.1016/0013-4694(85)91075-2. [DOI] [PubMed] [Google Scholar]
- Buzsáki G, Czopf J, Kondákor I, Kellényi L. Laminar distribution of hippocampal rhythmic slow activity (RSA) in the behaving rat: Current-source density analysis, effects of urethane and atropine. Brain Res. 1986;365:125–137. doi: 10.1016/0006-8993(86)90729-8. [DOI] [PubMed] [Google Scholar]
- Buzsáki G, Horváth Z, Urioste R, Hetke J, Wise K. High-frequency network oscillation in the hippocampus. Science. 1992;256:1025–1027. doi: 10.1126/science.1589772. [DOI] [PubMed] [Google Scholar]
- Csicsvari J, Hirase H, Czurkó A, Mamiya A, Buzsáki G. Oscillatory coupling of hippocampal pyramidal cells and interneurons in the behaving rat. J Neurosci. 1999;19:274–287. doi: 10.1523/JNEUROSCI.19-01-00274.1999. [DOI] [PMC free article] [PubMed] [Google Scholar]
- Csicsvari J, Hirase H, Mamiya A, Buzsáki G. Ensemble patterns of hippocampal CA3-CA1 neurons during sharp wave-associated population events. Neuron. 2000;28:585–594. doi: 10.1016/s0896-6273(00)00135-5. [DOI] [PubMed] [Google Scholar]
- Csicsvari J, Henze DA, Jamieson B, Harris KD, Sirota A, Barthó P, Wise KD, Buzsáki G. Massively parallel recording of unit and local field potentials with silicon-based electrodes. J Neurophysiol. 2003;90:1314–1323. doi: 10.1152/jn.00116.2003. [DOI] [PubMed] [Google Scholar]
- Diba K, Montgomery SM, Harris KD, Buzsáki G. Identification of silicon probe irregularities using analysis of in vivo recordings. Soc Neurosci Abstr. 2005;31:275–10. [Google Scholar]
- Dragoi G, Buzsáki G. Temporal encoding of place sequences by hippocampal cell assemblies. Neuron. 2006;50:145–157. doi: 10.1016/j.neuron.2006.02.023. [DOI] [PubMed] [Google Scholar]
- Fox SE. Membrane potential and impedance changes in hippocampal pyramidal cells during theta rhythm. Exp Brain Res. 1989;77:283–294. doi: 10.1007/BF00274985. [DOI] [PubMed] [Google Scholar]
- Freund TF, Buzsáki G. Interneurons of the hippocampus. Hippocampus. 1996;6:347–470. doi: 10.1002/(SICI)1098-1063(1996)6:4<347::AID-HIPO1>3.0.CO;2-I. [DOI] [PubMed] [Google Scholar]
- Gillies MJ, Traub RD, LeBeau FE, Davies CH, Gloveli T, Buhl EH, Whittington MA. A model of atropine-resistant theta oscillations in rat hippocampal area CA1. J Physiol. 2002;543:779–793. doi: 10.1113/jphysiol.2002.024588. [DOI] [PMC free article] [PubMed] [Google Scholar]
- Grastyan E, Lissak K, Madarasz I, Donhoffer H. Hippocampal electrical activity during the development of conditioned reflexes. Electroencephalogr Clin Neurophysiol. 1959;11:409–430. doi: 10.1016/0013-4694(59)90040-9. [DOI] [PubMed] [Google Scholar]
- Halasy K, Somogyi P. Subdivisions in the multiple GABAergic innervation of granule cells in the dentate gyrus of the rat hippocampus. Eur J Neurosci. 1993;5:411–429. doi: 10.1111/j.1460-9568.1993.tb00508.x. [DOI] [PubMed] [Google Scholar]
- Harris KD, Henze DA, Csicsvari J, Hirase H, Buzsáki G. Accuracy of tetrode spike separation as determined by simultaneous intracellular and extracellular measurements. J Neurophysiol. 2000;84:401–414. doi: 10.1152/jn.2000.84.1.401. [DOI] [PubMed] [Google Scholar]
- Hasselmo ME, Bodelón C, Wyble BP. A proposed function for hippocampal theta rhythm: Separate phases of encoding and retrieval enhance reversal of prior learning. Neural Comput. 2002;14:793–817. doi: 10.1162/089976602317318965. [DOI] [PubMed] [Google Scholar]
- Hazan L, Zugaro M, Buzsáki G. Klusters, NeuroScope, NDManager: a free software suite for neurophysiological data processing and visualization. J Neurosci Methods. 2006;155:207–216. doi: 10.1016/j.jneumeth.2006.01.017. [DOI] [PubMed] [Google Scholar]
- Hu H, Vervaeke K, Storm JF. M-channels (Kv7/KCNQ channels) that regulate synaptic integration, excitability, and spike pattern of CA1 pyramidal cells are located in the perisomatic region. J Neurosci. 2007;27:1853–1867. doi: 10.1523/JNEUROSCI.4463-06.2007. [DOI] [PMC free article] [PubMed] [Google Scholar]
- Huxter J, Burgess N, O'Keefe J. Independent rate and temporal coding in hippocampal pyramidal cells. Nature. 2003;425:828–832. doi: 10.1038/nature02058. [DOI] [PMC free article] [PubMed] [Google Scholar]
- Huxter JR, Senior TJ, Allen K, Csicsvari J. Theta phase-specific codes for two-dimensional position, trajectory and heading in the hippocampus. Nat Neurosci. 2008;11:587–594. doi: 10.1038/nn.2106. [DOI] [PubMed] [Google Scholar]
- Isomura Y, Sirota A, Ozen S, Montgomery S, Mizuseki K, Henze DA, Buzsáki G. Integration and segregation of activity in entorhinal-hippocampal subregions by neocortical slow oscillations. Neuron. 2006;52:871–882. doi: 10.1016/j.neuron.2006.10.023. [DOI] [PubMed] [Google Scholar]
- Jeewajee A, Lever C, Burton S, O'Keefe J, Burgess N. Environmental novelty is signaled by reduction of the hippocampal theta frequency. Hippocampus. 2008;18:340–348. doi: 10.1002/hipo.20394. [DOI] [PMC free article] [PubMed] [Google Scholar]
- Jensen O, Lisman JE. Novel lists of 7 +/- 2 known items can be reliably stored in an oscillatory short-term memory network: interaction with long-term memory. Learn Mem. 1996;3:257–263. doi: 10.1101/lm.3.2-3.257. [DOI] [PubMed] [Google Scholar]
- Kamondi A, Acsády L, Wang XJ, Buzsáki G. Theta oscillations in somata and dendrites of hippocampal pyramidal cells in vivo: activity-dependent phase-precession of action potentials. Hippocampus. 1998;8:244–261. doi: 10.1002/(SICI)1098-1063(1998)8:3<244::AID-HIPO7>3.0.CO;2-J. [DOI] [PubMed] [Google Scholar]
- Klausberger T, Somogyi P. Neuronal diversity and temporal dynamics: the unity of hippocampal circuit operations. Science. 2008;321:53–57. doi: 10.1126/science.1149381. [DOI] [PMC free article] [PubMed] [Google Scholar]
- Klausberger T, Magill PJ, Márton LF, Roberts JD, Cobden PM, Buzsáki G, Somogyi P. Brain-state- and cell-type-specific firing of hippocampal interneurons in vivo. Nature. 2003;421:844–848. doi: 10.1038/nature01374. [DOI] [PubMed] [Google Scholar]
- Klausberger T, Márton LF, Baude A, Roberts JD, Magill PJ, Somogyi P. Spike timing of dendrite-targeting bistratified cells during hippocampal network oscillations in vivo. Nat Neurosci. 2004;7:41–47. doi: 10.1038/nn1159. [DOI] [PubMed] [Google Scholar]
- Kocsis B, Vertes RP. Phase relations of rhythmic neuronal firing in the supramammillary nucleus and mammillary body to the hippocampal theta activity in urethane anesthetized rats. Hippocampus. 1997;7:204–214. doi: 10.1002/(SICI)1098-1063(1997)7:2<204::AID-HIPO7>3.0.CO;2-M. [DOI] [PubMed] [Google Scholar]
- Kocsis B, Bragin A, Buzsáki G. Interdependence of multiple theta generators in the hippocampus: a partial coherence analysis. J Neurosci. 1999;19:6200–6212. doi: 10.1523/JNEUROSCI.19-14-06200.1999. [DOI] [PMC free article] [PubMed] [Google Scholar]
- Konopacki J. Theta-like activity in the limbic cortex in vitro. Neurosci Biobehav Rev. 1998;22:311–323. doi: 10.1016/s0149-7634(97)00017-1. [DOI] [PubMed] [Google Scholar]
- Kramis R, Vanderwolf CH, Bland BH. Two types of hippocampal rhythmical slow activity in both the rabbit and the rat: relations to behavior and effects of atropine, diethyl ether, urethane, and pentobarbital. Exp Neurol. 1975;49:58–85. doi: 10.1016/0014-4886(75)90195-8. [DOI] [PubMed] [Google Scholar]
- Lawrence JJ, Grinspan ZM, Statland JM, McBain CJ. Muscarinic receptor activation tunes mouse stratum oriens interneurones to amplify spike reliability. J Physiol. 2006;571:555–562. doi: 10.1113/jphysiol.2005.103218. [DOI] [PMC free article] [PubMed] [Google Scholar]
- Lee MG, Chrobak JJ, Sik A, Wiley RG, Buzsáki G. Hippocampal theta activity following selective lesion of the septal cholinergic system. Neuroscience. 1994;62:1033–1047. doi: 10.1016/0306-4522(94)90341-7. [DOI] [PubMed] [Google Scholar]
- Leranth C, Hajszan T. Extrinsic afferent systems to the dentate gyrus. Prog Brain Res. 2007;163:63–84. doi: 10.1016/S0079-6123(07)63004-0. [DOI] [PMC free article] [PubMed] [Google Scholar]
- Leung LS. Theta rhythm during REM sleep and waking: correlations between power, phase and frequency. Electroencephalogr Clin Neurophysiol. 1984;58:553–564. doi: 10.1016/0013-4694(84)90045-2. [DOI] [PubMed] [Google Scholar]
- Leung LS, Yim CY. Intracellular records of theta rhythm in hippocampal CA1 cells of the rat. Brain Res. 1986;367:323–327. doi: 10.1016/0006-8993(86)91611-2. [DOI] [PubMed] [Google Scholar]
- Leung LW. Model of gradual phase shift of theta rhythm in the rat. J Neurophysiol. 1984;52:1051–1065. doi: 10.1152/jn.1984.52.6.1051. [DOI] [PubMed] [Google Scholar]
- Lopes da Silva FH, Arnolds DE. Physiology of the hippocampus and related structures. Annu Rev Physiol. 1978;40:185–216. doi: 10.1146/annurev.ph.40.030178.001153. [DOI] [PubMed] [Google Scholar]
- Magee JC, Johnston D. Synaptic activation of voltage-gated channels in the dendrites of hippocampal pyramidal neurons. Science. 1995;268:301–304. doi: 10.1126/science.7716525. [DOI] [PubMed] [Google Scholar]
- Maglóczky Z, Acsády L, Freund TF. Principal cells are the postsynaptic targets of supramammillary afferents in the hippocampus of the rat. Hippocampus. 1994;4:322–334. doi: 10.1002/hipo.450040316. [DOI] [PubMed] [Google Scholar]
- Manns JR, Zilli EA, Ong KC, Hasselmo ME, Eichenbaum H. Hippocampal CA1 spiking during encoding and retrieval: Relation to theta phase. Neurobiol Learn Mem. 2007;87:9–20. doi: 10.1016/j.nlm.2006.05.007. [DOI] [PubMed] [Google Scholar]
- Markram H, Lübke J, Frotscher M, Sakmann B. Regulation of synaptic efficacy by coincidence of postsynaptic APs and EPSPs. Science. 1997;275:213–215. doi: 10.1126/science.275.5297.213. [DOI] [PubMed] [Google Scholar]
- McFarland WL, Teitelbaum H, Hedges EK. Relationship between hippocampal theta activity and running speed in the rat. J Comp Physiol Psychol. 1975;88:324–328. doi: 10.1037/h0076177. [DOI] [PubMed] [Google Scholar]
- McNaughton BL, Barnes CA. Physiological identification and analysis of dentate granule cell responses to stimulation of the medial and lateral perforant pathways in the rat. J Comp Neurol. 1977;175:439–454. doi: 10.1002/cne.901750404. [DOI] [PubMed] [Google Scholar]
- McNaughton BL, Barnes CA, O'Keefe J. The contributions of position, direction, and velocity to single unit activity in the hippocampus of freely-moving rats. Exp Brain Res. 1983;52:41–49. doi: 10.1007/BF00237147. [DOI] [PubMed] [Google Scholar]
- Mehta MR, Barnes CA, McNaughton BL. Experience-dependent, asymmetric expansion of hippocampal place fields. Proc Natl Acad Sci U S A. 1997;94:8918–8921. doi: 10.1073/pnas.94.16.8918. [DOI] [PMC free article] [PubMed] [Google Scholar]
- Miller R. Cortico-hippocampal interplay and the representation of contexts in the brain. Berlin: Springer; 1991. [Google Scholar]
- Mitra P, Bokil H. Observed brain dynamics. New York: Oxford UP; 2008. [Google Scholar]
- Mitra PP, Pesaran B. Analysis of dynamic brain imaging data. Biophys J. 1999;76:691–708. doi: 10.1016/S0006-3495(99)77236-X. [DOI] [PMC free article] [PubMed] [Google Scholar]
- Mitzdorf U. Current source-density method and application in cat cerebral cortex: investigation of evoked potentials and EEG phenomena. Physiol Rev. 1985;65:37–100. doi: 10.1152/physrev.1985.65.1.37. [DOI] [PubMed] [Google Scholar]
- Mizumori SJ, Perez GM, Alvarado MC, Barnes CA, McNaughton BL. Reversible inactivation of the medial septum differentially affects two forms of learning in rats. Brain Res. 1990;528:12–20. doi: 10.1016/0006-8993(90)90188-h. [DOI] [PubMed] [Google Scholar]
- Montgomery SM, Buzsáki G. Gamma oscillations dynamically couple hippocampal CA3 and CA1 regions during memory task performance. Proc Natl Acad Sci U S A. 2007;104:14495–14500. doi: 10.1073/pnas.0701826104. [DOI] [PMC free article] [PubMed] [Google Scholar]
- Montgomery SM, Sirota A, Buzsáki G. Theta and gamma coordination of hippocampal networks during waking and rapid eye movement sleep. J Neurosci. 2008;28:6731–6741. doi: 10.1523/JNEUROSCI.1227-08.2008. [DOI] [PMC free article] [PubMed] [Google Scholar]
- O'Keefe J, Recce ML. Phase relationship between hippocampal place units and the EEG theta rhythm. Hippocampus. 1993;3:317–330. doi: 10.1002/hipo.450030307. [DOI] [PubMed] [Google Scholar]
- Rencher AC. Methods of multivariate analysis. New York: Wiley; 2002. [Google Scholar]
- Rivas J, Gaztelu JM, García-Austt E. Changes in hippocampal cell discharge patterns and theta rhythm spectral properties as a function of walking velocity in the guinea pig. Exp Brain Res. 1996;108:113–118. doi: 10.1007/BF00242908. [DOI] [PubMed] [Google Scholar]
- Rotstein HG, Pervouchine DD, Acker CD, Gillies MJ, White JA, Buhl EH, Whittington MA, Kopell N. Slow and fast inhibition and an H-current interact to create a theta rhythm in a model of CA1 interneuron network. J Neurophysiol. 2005;94:1509–1518. doi: 10.1152/jn.00957.2004. [DOI] [PubMed] [Google Scholar]
- Schiller J, Schiller Y, Stuart G, Sakmann B. Calcium action potentials restricted to distal apical dendrites of rat neocortical pyramidal neurons. J Physiol. 1997;505:605–616. doi: 10.1111/j.1469-7793.1997.605ba.x. [DOI] [PMC free article] [PubMed] [Google Scholar]
- Sik A, Penttonen M, Ylinen A, Buzsáki G. Hippocampal CA1 interneurons: an in vivo intracellular labeling study. J Neurosci. 1995;15:6651–6665. doi: 10.1523/JNEUROSCI.15-10-06651.1995. [DOI] [PMC free article] [PubMed] [Google Scholar]
- Sik A, Penttonen M, Buzsáki G. Interneurons in the hippocampal dentate gyrus: an in vivo intracellular study. Eur J Neurosci. 1997;9:573–588. doi: 10.1111/j.1460-9568.1997.tb01634.x. [DOI] [PubMed] [Google Scholar]
- Sinnamon HM. Hippocampal theta activity and behavioral sequences in a reward-directed approach locomotor task. Hippocampus. 2005;15:518–534. doi: 10.1002/hipo.20083. [DOI] [PubMed] [Google Scholar]
- Sinnamon HM. Decline in hippocampal theta activity during cessation of locomotor approach sequences: amplitude leads frequency and relates to instrumental behavior. Neuroscience. 2006;140:779–790. doi: 10.1016/j.neuroscience.2006.02.058. [DOI] [PubMed] [Google Scholar]
- Skaggs WE, McNaughton BL, Wilson MA, Barnes CA. Theta phase precession in hippocampal neuronal populations and the compression of temporal sequences. Hippocampus. 1996;6:149–172. doi: 10.1002/(SICI)1098-1063(1996)6:2<149::AID-HIPO6>3.0.CO;2-K. [DOI] [PubMed] [Google Scholar]
- Soltesz I, Deschênes M. Low- and high-frequency membrane potential oscillations during theta activity in CA1 and CA3 pyramidal neurons of the rat hippocampus under ketamine-xylazine anesthesia. J Neurophysiol. 1993;70:97–116. doi: 10.1152/jn.1993.70.1.97. [DOI] [PubMed] [Google Scholar]
- Steward O. Topographic organization of the projections from the entorhinal area to the hippocampal formation of the rat. J Comp Neurol. 1976;167:285–314. doi: 10.1002/cne.901670303. [DOI] [PubMed] [Google Scholar]
- Stewart M, Fox SE. Do septal neurons pace the hippocampal theta rhythm? Trends Neurosci. 1990;13:163–168. doi: 10.1016/0166-2236(90)90040-h. [DOI] [PubMed] [Google Scholar]
- Thomson DJ, Chave AD. Jackknifed error estimates for spectra, coherences, and transfer functions. In: Haykin S, editor. Advances in spectrum analysis and array processing. New York: Prentice Hall; 1991. pp. 58–113. [Google Scholar]
- Traub RD, Bibbig A, LeBeau FE, Buhl EH, Whittington MA. Cellular mechanisms of neuronal population oscillations in the hippocampus in vitro. Annu Rev Neurosci. 2004;27:247–278. doi: 10.1146/annurev.neuro.27.070203.144303. [DOI] [PubMed] [Google Scholar]
- Vanderwolf CH. Hippocampal electrical activity and voluntary movement in the rat. Electroencephalogr Clin Neurophysiol. 1969;26:407–418. doi: 10.1016/0013-4694(69)90092-3. [DOI] [PubMed] [Google Scholar]
- Vanderwolf CH. Cerebral activity and behavior: Control by central cholinergic and serotonergic systems. Int Rev Neurobiol. 1988;30:225–340. doi: 10.1016/s0074-7742(08)60050-1. [DOI] [PubMed] [Google Scholar]
- Vanderwolf CH. An odyssey through the brain, behavior and the mind. Norwell, MA: Kluwer Academic; 2003. [Google Scholar]
- Whishaw IQ, Vanderwolf CH. Hippocampal EEG and behavior: Changes in amplitude and frequency of RSA (theta rhythm) associated with spontaneous and learned movement patterns in rats and cats. Behav Biol. 1973;8:461–484. doi: 10.1016/s0091-6773(73)80041-0. [DOI] [PubMed] [Google Scholar]
- Whittington MA, Traub RD. Interneuron diversity series: Inhibitory interneurons and network oscillations in vitro. Trends Neurosci. 2003;26:676–682. doi: 10.1016/j.tins.2003.09.016. [DOI] [PubMed] [Google Scholar]
- Winson J. Loss of hippocampal theta rhythm results in spatial memory deficit in the rat. Science. 1978;201:160–163. doi: 10.1126/science.663646. [DOI] [PubMed] [Google Scholar]
- Wyble BP, Hyman JM, Rossi CA, Hasselmo ME. Analysis of theta power in hippocampal EEG during bar pressing and running behavior in rats during distinct behavioral contexts. Hippocampus. 2004;14:662–674. doi: 10.1002/hipo.20012. [DOI] [PubMed] [Google Scholar]
- Ylinen A, Soltész I, Bragin A, Penttonen M, Sik A, Buzsáki G. Intracellular correlates of hippocampal theta rhythm in identified pyramidal cells, granule cells, and basket cells. Hippocampus. 1995;5:78–90. doi: 10.1002/hipo.450050110. [DOI] [PubMed] [Google Scholar]