

Abstract
Background and Objective
The first objective of this study was to evaluate the performance of fluorescence spectroscopy for diagnosing pre-cancers in stratified squamous epithelial tissues in vivo using two different probe geometries with (1) overlapping vs. (2) non-overlapping illumination and collection areas on the tissue surface. Probe (1) and probe (2) are preferentially sensitive to the fluorescence originating from the tissue surface and sub-surface tissue depths, respectively. The second objective was to design a novel, angled illumination fiber-optic probe to maximally exploit the depth-dependent fluorescence properties of epithelial tissues.
Study Design/Materials and Methods
In the first study, spectra were measured from epithelial pre-cancers and normal tissues in the hamster cheek pouch and analyzed with a non-parametric classification algorithm. In the second study, Monte Carlo modeling was used to simulate fluorescence measurements from an epithelial tissue model with the angled illumination probe.
Results
An unbiased classification algorithm based on spectra measured with probes (1) and (2), classified pre-cancerous and normal tissues with 78% and 94% accuracy, respectively. The angled illumination probe design provides the capability to detect fluorescence from a wide range of tissue depths in an epithelial tissue model.
Conclusion
The first study demonstrates that fluorescence originating from sub-surface tissue depths (probe (2)) is more diagnostic than fluorescence originating from the tissue surface (probe (1)) in the hamster cheek pouch model. However in general, it is difficult to know a priori the optimal probe geometry for pre-cancer detection in a particular epithelial tissue model. The angled illumination probe provides the capability to measure tissue fluorescence selectively from different depths within epithelial tissues, thus obviating the need to select a single optimal probe design for the fluorescence-based diagnosis of epithelial pre-cancers.
Keywords: Epithelium, pre-cancer, dysplasia, hamster, in vivo, fiber-optic, fluorescence, diffuse reflectance, spectroscopy, Monte Carlo
INTRODUCTION
Over half of all human cancers originate in the stratified squamous epithelia. Examples of tissues with stratified squamous epithelia include the cervix, skin and oral cavity. These tissues consist of a surface, stratified squamous epithelium, which contains several layers of epithelial cells, a basement membrane, and an underlying stroma, which contains structural proteins (collagen) and blood vessels. The cancerous cells originate near the basement membrane and proliferate upward within the epithelium. In invasive cancer, these cells ultimately break through the basement membrane and invade into the stroma. Approximately one million cases of non-melanoma cancers of the stratified squamous epithelia are identified each year (1). Early detection and treatment of these cancers is important to minimize morbidity and mortality.
A promising technique under development for epithelial pre-cancer and early cancer detection is ultraviolet-visible (UV-VIS) fluorescence spectroscopy. This technique offers several benefits over traditional diagnostic methods, which include visual inspection (through a microscope/endoscope) followed by biopsy. First and foremost, fluorescence spectroscopy non-invasively probes the endogenous fluorescence of a large number of biological molecules that are already present in the tissue, thus providing a wealth of biochemical information related to disease progression. Additionally, advances in sensitive detectors and optical fibers make it possible to measure fluorescence spectra rapidly and remotely from human tissues in vivo. A large number of clinical investigations carried out on a variety of tissue sites including the cervix, skin and oral cavity demonstrate that fluorescence spectroscopy provides sensitive and specific detection of epithelial pre-cancers and early cancers (2).
The endogenous fluorophores present in epithelial tissues include tryptophan, reduced nicotinamide adenine dinucleotide (NADH), flavin adenine dinucleotide (FAD) and collagen (3). Tryptophan, NADH and FAD are the primary endogenous fluorophores in the cells within the epithelium. Tryptophan is an amino acid and NADH and FAD are coenzymes associated with cellular metabolism. Collagen, which is a structural protein, is the principal endogenous fluorophore in the underlying stroma. There are non-fluorescent absorbers (oxygenated and deoxygenated hemoglobin) and scatterers (cells and subcellular organelles, collagen fibrils) that indirectly affect the intensity and line shape of tissue fluorescence spectra.
There is evidence that the endogenous fluorescence contrast in pre-cancers and early cancers of stratified squamous epithelial tissues varies with depth. For example, fluorescence microscopy studies of transverse sections of fresh cervical tissue slices (4,5) and frozen cervical tissue blocks (6) show that there is a decrease in the intensity of collagen fluorescence in the stroma and an increase in the intensity of NADH fluorescence in the epithelium in cervical pre-cancers compared to normal tissue. Moreover, the NADH fluorescence is limited to a single layer of cells adjacent to the basement membrane in the normal epithelium, but occupies the lower one-third and two-thirds of the epithelium in low-grade and high-grade pre-cancers, respectively (5). In addition, the thickness of the epithelium in tissues such as the cervix decreases with patient age and menopausal status (7,8) and increases with neoplasia (4), thus also changing the depth-distribution of the endogenous epithelial and stromal fluorescence.
A typical tissue fluorescence spectroscopy system consists of a monochromatic excitation light source, an illumination and collection system and a detector that can measure the emitted light as a function of wavelength. The geometry of the illumination and collection system is an important component of tissue fluorescence spectroscopy and fiber-optic probes are most commonly used for this purpose (1,9–15). The geometry of the illumination and collection fibers on the tissue surface, the optical properties (absorption and scattering) and the fluorescence efficiency of the tissue through which the light propagates, define the optical sensing depth (1,13,14,16). In most currently used probe geometries, the illumination and collection fiber geometries are configured such that the illumination and collection areas on the tissue surface are either overlapping or non-overlapping (with a fixed distance between them). Pfefer et al. (14) used Monte Carlo modeling to evaluate the effect of these two distinct probe geometries on the depth from which the detected fluorescence originates in turbid tissues. The results of their study indicated that overlapping and non-overlapping probe designs are sensitive to fluorescence originating from different depths within tissue. The non-overlapping probe is maximally sensitive to the fluorescence originating from sub-surface tissue layers (exact depth within the tissue depends on multiple factors, including tissue optical properties and the illumination-collection fiber separation), while the overlapping probe is maximally sensitive to the fluorescence originating from the tissue surface directly beneath the illumination-collection area. These results were experimentally validated using synthetic two-layer tissue phantoms (1). Although there are distinct differences in the depth-dependence of the fluorescence detected with the overlapping and non-overlapping probe geometries, no studies have been carried out to evaluate their effect on the fluorescence-based diagnosis of epithelial pre-cancers in vivo.
The first objective of this study was to evaluate the performance of fluorescence spectroscopy for diagnosing pre-cancers in stratified squamous epithelial tissues in vivo using two distinct probe geometries with overlapping and non-overlapping illumination and collection areas on the tissue surface (referred to here as the shielded and unshielded probe geometries, respectively). The center-to-center distance between the illumination and collection areas in the unshielded probe was the sum of the radii of the illumination and collection areas (smallest possible center-to-center distance). In the shielded probe, a quartz spacer was placed between the tips of the fibers and the tissue surface, to maximize the overlap between the illumination and collection areas on the tissue surface. The dimethylbenz[α]anthracene (DMBA) induced hamster cheek pouch model of carcinogenesis was employed so that different stages of epithelial pre-cancer could be studied in vivo over a small period of time. The results of this study indicate that fluorescence spectra measured with the unshielded probe provide significantly better discrimination between pre-cancerous and normal tissues compared to fluorescence spectra measured with the shielded probe. The improved diagnostic performance of fluorescence spectroscopy with the unshielded probe suggests that fluorescence originating from sub-surface tissue layers provides greater diagnostic information than the fluorescence originating from the tissue surface in this particular epithelial tissue model. Given that the cancerous cells originate near the basal layer of the epithelium (sub-surface tissue layer) and proliferate upward, it can be concluded that the unshielded probe is more sensitive than the shielded probe to the earliest changes in endogenous fluorescence associated with neoplasia.
It is difficult to know a priori the optimal probe geometry for pre-cancer and early cancer detection in a particular epithelial tissue model. Thus, it is desirable to design a simple, flexible fiber-optic probe that can enable tissue fluorescence measurements to be selectively made from different depths within epithelial tissues. Thus, the second objective of this study was to design a novel, angled illumination fiber-optic probe that has the capability to selectively measure the fluorescence originating from a wide range of depths within epithelial tissues and to compare it to previously proposed approaches for depth-resolved fluorescence measurements from epithelial tissues (16). Angled illumination is achieved by tilting the illumination fiber by a specific angle, θ, relative to the axis perpendicular to the tissue surface. The depth from which the detected fluorescence originates decreases with increasing θ. Depth-resolved fluorescence detection with the angled illumination probe design was tested on a two-layered epithelial tissue model of the cervix using Monte Carlo simulations. The results of this study suggest that the angled probe design provides a superior range of sensitivities to the epithelial and stromal layers than previously proposed approaches for depth-resolved fluorescence detection from epithelial tissues, which include the multi-distance and variable aperture probe designs (16).
MATERIALS AND METHODS
Instrument Description
Optical spectroscopic measurements were made using a conventional laboratory spectrofluorometer (Fluorolog-3, JY Horiba Inc., NJ). A detailed description of the instrument is provided elsewhere (17). A fiber-optic probe can be coupled to the sample compartment (F3000, JY Horbia Inc., NJ), thus enabling optical spectroscopic measurements to be made remotely from the hamster cheek pouch. The adjustable variables are the excitation and emission wavelength(s), the excitation and emission slit widths, the sampling increment and integration time.
The optical spectroscopic measurements from the hamster cheek pouch were made using a fiber-optic probe (Multimode fibers, NJ), which consists of a single illumination fiber with a core/cladding diameter of 200/245 μm and 9 surrounding collection fibers each with a core/cladding diameter of 100/130 μm. All fibers have a numerical aperture (NA) of 0.22. The output power from the illumination fiber at 300, 320, 340 and 460 nm was 5.7, 7.3, 9.7 and 6.6 μW, respectively. Two different probe geometries were used: (1) unshielded and (2) shielded. In the unshielded probe, the tips of the fibers in the probe were placed flush against the tissue surface. This resulted in non-overlapping illumination and collection areas on the tissue surface and the center-to-center distance between the illumination fiber and each collection fiber was 187.5 μm (the sum of the radii of the illumination and collection fiber diameters). In the shielded probe, a quartz shield with 3 mm thickness and 1 mm diameter was attached to the tip of the fibers, before the probe was placed in contact with the tissue. The shield was housed in a casing that attached to the probe with a side screw, allowing for reproducible positioning of the shield on the probe tip. The shielded geometry resulted in almost completely overlapping illumination and collection areas (84% overlap) of approximately a 1 mm diameter on the tissue surface. Tissue fluorescence spectra were measured with both probe geometries. In addition, diffuse reflectance spectra were measured from the tissues only with the unshielded geometry; the shielded geometry was not employed due to the specular reflection into the collection fibers from the shield/tissue interface.
Each fluorescence spectrum was corrected for wavelength-dependent excitation light intensity delivered from the excitation monochromator using an internal reference photo diode, and for the non-uniform wavelength response of the emission monochromator and PMT using factory generated corrections factors. A background spectrum was measured at each excitation wavelength by inserting the probe into a dark bottle filled with distilled water. The background spectrum was then subtracted from the corresponding tissue fluorescence spectrum. Next, a Rhodamine fluorescence spectrum was measured at an excitation wavelength of 460 nm, with the probe placed flush against the surface of a quartz cuvette containing 2.14 μM Rhodamine B (115H3423, Sigma Chemical Co., MO) dissolved in water. Tissue fluorescence intensities at each excitation-emission wavelength pair were divided by the Rhodamine B peak intensity at 575 nm emission to correct for day-to-day variations in the throughput of the fiber-optic probe and the instrument. The diffuse reflectance spectrum was corrected for the wavelength-dependent system response and the throughput of the instrument by normalizing it, point by point, to the diffuse reflectance spectrum measured with the tip of the probe placed flush against a Spectralon 99% reflectance puck (SRS-99-010, Labsphere, Inc., North Sutton, NH).
Optical Spectroscopy of the Control and DMBA Treated Hamster Cheek Pouch
A total of 25 male Golden Syrian hamsters (117±12 g) were examined in this study. The hamsters were housed three per cage with ad libitum access to food and water, and kept under controlled environmental conditions (22°C, relative humidity 45–55%, 12 hour light/dark cycle). Animal care and procedures were in accordance with the guidelines in the U.S. department of Health and Human Services and National Institutes of Health “Guide for the Care and Use of Laboratory Animals” and approved by the Institutional Animal Care and Use Committee at the University of Wisconsin.
Within each hamster, the right cheek pouch was treated three times per week with 0.5% DMBA (by weight) in mineral oil (DMBA-treated cheek) and the left cheek pouch was treated at the same frequency with mineral oil only (control cheek) for a total of 8–16 weeks. The treatment schedule of 8–16 weeks was established from the results of previous studies to yield a majority of tissues with mild to severe dysplasia (18–25).
Immediately before treating the cheek pouch, the hamster was anesthetized by placing it in a bell jar containing isoflurane. Next, its cheek pouch was everted and stretched over a plastic post, 1.3 cm in diameter and 4.3 cm high and treatment was applied with a No. 5 camelhair brush. Within each hamster, the left cheek was treated with mineral oil, and then the right cheek was treated with the DMBA/mineral oil solution. Separate brushes were used for the application of the DMBA/mineral oil solution and mineral oil alone, and both brushes were discarded after each day of treatment.
Optical spectroscopic measurements were made from the DMBA-treated and control cheek pouch of each hamster on the day of biopsy. In a previous study, Coghlan et al. (23) found that 0.5% DMBA in mineral oil has four fluorescence excitation-emission maxima at 270–410 nm, 270–430 nm, 370–410 nm and 370–430 nm and that the fluorescence of this chemical in the tissue is negligible forty-eight hours after it is applied to the hamster cheek pouch. Thus, in this study, tissue fluorescence spectra were measured at least 48 hours after the DMBA treatment in order to ensure that the DMBA itself did not contribute to the fluorescence measurements.
Prior to the optical spectroscopic measurement, each hamster was anesthetized with an intraperitoneal injection of a mixture of 200 mg/kg of ketamine and 5 mg/kg xylazine. The ketamine/xylazine cocktail weakly fluoresces at an excitation-emission maximum of 300–400 nm and its emission spectra is not observed in tissue emission spectra at this excitation wavelength. Anesthesia lasted for approximately one hour at this dose. Next, the cheek pouch was everted and stretched over a metal post (with the same specifications as the treatment post described earlier), such that a part of the treated area was exposed. The cheek was wiped with saline and the fiber-optic probe was gently pressed on the tissue such that the tip was flush with the tissue surface, and the probe was fixed in position using a clamp assembly. Optical spectroscopic measurements were made from the control cheek pouch with the unshielded and then, shielded probe geometry. The measurements were then repeated on the DMBA-treated cheek. The probe was washed with Sparkleen 1 (04-320-4, Fisher Scientific Co., Pittsburgh, PA), rinsed with distilled water, and then wiped with methanol after completing the optical spectroscopic measurements on each hamster.
Fluorescence spectra were measured at six excitation wavelengths: 300 nm, 320 nm, 340 nm, 370 nm, 410 nm, and 460 nm in order to allow for an unbiased comparison of the shielded and unshielded probe geometries (the two probe geometries achieve maximal diagnostic accuracy using fluorescence spectra at different excitation wavelengths). The excitation and emission wavelength band passes were 5 nm and 10 nm, respectively. Each fluorescence spectrum was sampled in 5 nm increments, and the integration time was 0.5 seconds per wavelength. Diffuse reflectance spectra were measured by synchronous scanning of the excitation and emission monochromators in the wavelength range of 300–550 nm. The excitation and emission wavelength band passes were set at 0.2 nm. Each diffuse reflectance spectrum was scanned in 5 nm increments and the integration time was one second per wavelength. The high voltage was set to 950 V for all measurements.
Immediately following the last optical spectroscopic measurement on each hamster, the control and DMBA-treated cheek pouches were biopsied and placed in buffered formalin, and then the animal was euthanized. The biopsy was obtained from the everted cheek pouch (while it was still stretched out on the post) in order to ensure co-registration of the optical spectroscopic measurements and histology. The number of weeks of DMBA or mineral oil treatment was noted for the DMBA-treated and control sample. Each tissue biopsy was then cut and stained with hemotoxylin and eosin (H&E) and submitted for histological evaluation (AG).
Table 1 shows the histological diagnosis of 50 tissue sites (1 DMBA-treated cheek and 1 control cheek per hamster) in a total of 25 hamsters from which fluorescence and diffuse reflectance spectra were measured. The control cheeks (treated only with mineral oil) were all diagnosed as histologically normal. Of the 25 DMBA-treated cheeks, 7 had hyperplasia, 17 had dysplasia (mild to severe) and 1 had carcinoma in situ (CIS). The number of weeks of DMBA treatment with standard deviations is given for each histopathological category.
Table 1.
Histological diagnosis of 50 tissue sites (1 DMBA-treated cheek and 1 control cheek per hamster) in a total of 25 hamsters from which fluorescence and diffuse reflectance spectra were measured. The number of weeks of DMBA treatment with standard deviations is given for each histopathological category.
| Histological Diagnosis | Number of Cases | Number of Weeks Treated |
|---|---|---|
| Normal | 25 | N/A |
| Hyperplasia | 7 | 9 ± 2 |
| Mild Dysplasia | 11 | 12 ± 3 |
| Moderate to Severe Dysplasia/CIS | 7 | 14 ± 2 |
Multivariate Statistical Analysis
Figure 1 shows a flowchart outlining the steps of the multivariate statistical algorithm used for analyzing the tissue spectral data (boxes with dashed lines indicate inputs/outputs and boxes with solid lines indicate the analysis steps). Three different types of spectral data were used as inputs: (1) the original spectra, (2) spectra normalized to the peak intensity for each fluorescence spectrum or to the Soret valley (420 nm) for each diffuse reflectance spectrum, and (3) spectra normalized so that the area under the spectrum is unity. The main source of variance in the first spectral input is intensity and spectral line shape, while that in the latter two spectral inputs is the spectral line shape. A total of 21 spectra per tissue site were available for the unshielded probe (the original and two normalized forms of the 6 fluorescence spectra and one diffuse reflectance spectrum) and a total of 18 spectra per tissue site were available for the shielded probe (the original and two normalized forms of the 6 fluorescence spectra).
Figure 1.
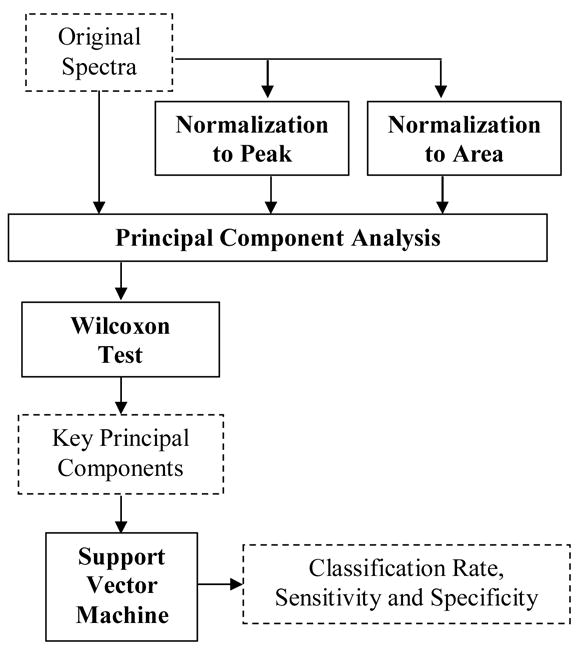
Flowchart outlining the steps of the multivariate statistical algorithm used for analyzing the tissue spectral data (boxes with dashed lines indicate inputs/outputs and boxes with solid lines indicate the analysis steps). Three different types of spectral data were used as inputs: (1) the original spectra, (2) spectra normalized to the peak intensity for each fluorescence spectrum or to the Soret valley (420 nm) for each diffuse reflectance spectrum, and (3) spectra normalized so that the area under the spectrum is unity.
After preprocessing, Principal Component Analysis (PCA) was employed as a data reduction technique (26). PCA transforms each spectrum into a few orthogonal principal components (PCs). Each PC corresponds to a feature in the spectrum. It is possible to extract as many PCs as there are intensity-wavelength points in the spectrum. However the goal is to retain PCs that describe a large percentage of the variance of the original spectral data set. Thus, PCs that account for 95% of the variance in each spectrum were retained for further analysis. It should be noted that each spectrum was processed individually (not concatenated). Thus, PCs identified from different spectra could be correlated to each other as spectra at different excitation wavelengths and the diffuse reflectance spectrum can potentially probe the same molecules in the tissue. The number of PCs retained for a particular spectrum ranged from 1 to 11.
The next step was to extract the key PCs that show statistically significant differences between dysplastic and normal tissues. A non-parametric test was required for the small sample sizes so two-tailed paired Wilcoxon Rank Sign tests and two-tailed unpaired Wilcoxon Rank Sum tests were employed for this purpose (27). The purpose of the unpaired and paired tests was to assess whether the same PCs were identified from the inter-hamster and intra-hamster comparisons, respectively of normal and dysplastic tissues. First, paired and unpaired Wilcoxon tests were used to determine if any statistically significant differences were observed in the PC scores of the left and right cheek pouches on the first day of the study (before DMBA or mineral oil treatment was commenced). Next, paired and unpaired Wilcoxon tests were used to identify PC scores that showed statistically significant differences between the left (mineral oil treated normal tissues) and right cheek pouches (DMBA induced dysplastic tissues) on the day of biopsy (with confirmed histology). The key PCs that showed statistically significant differences (p<0.05) between dysplasia/CIS and normal tissues based on the unpaired Wilcoxon tests were retained as inputs to the classification scheme.
Two PCs were selected from the larger set of PCs derived from all spectra preprocessed using a particular approach (original, normalized to peak, normalized to area). The first one was the statistically most significant PC identified from the unpaired Wilcoxon test, and the second one was significant within the p<0.05 level and also least correlated with the statistically most significant PC. The most significant PC was paired with its least correlated PC so that maximal information was added upon including the second PC. Classification accuracy was not significantly increased when more than two PCs were used in the classification algorithm.
A linear Support Vector Machine (SVM) was employed as a classification technique. The linear SVM classifier separates sample classes by creating a separation hyperplane (a line in 2-dimensions, a plane in 3-dimensions, etc.) that maximizes the distance between the hyperplane and the marginal data point of each class. As the distance between the classifier and both sample clusters is maximized, the possibility of correctly classifying samples that were not used in the training set is optimized (28,29). For this study, the SVM-light classification algorithm written by Thorsten Joachims at the University of Dortmund was used (30). The parameter C, which specifies a tolerance to misclassification error, was tuned from 10−3 to 106 to give the highest overall classification rate for the training set (this tuning range was narrowed from 10−9 to 109 after preliminary trials showed that a narrower range could be used).
In the cross-validation procedure, the SVM algorithm was trained with n-1 samples and the remaining one sample was used for testing. This procedure was then repeated until each of a total of n samples had been tested. This allowed for an unbiased evaluation of the classification algorithm. The overall classification rate, sensitivity and specificity were calculated for both the training set and the testing set. The overall classification rate is the percent of correctly classified samples, the sensitivity is the percent of correctly classified samples diagnosed with dysplasia/CIS and the specificity is the percent of correctly classified normal samples. For the training data set the classification rate, sensitivity and specificity were averaged over n trials and then a standard deviation was calculated. In the cross-validation procedure, the trained classifier was applied to the sample that was not used in the training set (the testing sample). The classification rate, sensitivity and specificity for the testing data set were calculated after all the n samples had been classified in this manner.
A total of 36 samples were available for the unpaired multivariate analysis and the sample sizes were equivalent for both normal and dysplastic tissues. Due to artifacts in the spectral data, several spectra had to be discarded, resulting in a slightly reduced sample size of 34 for the spectral data sets at 370 and 410 nm excitation (shielded probe geometry) and for the diffuse reflectance spectra (unshielded probe geometry). PCs that displayed statistically significant differences between dysplasia and hyperplasia were also identified. However, these PCs were not analyzed further because of the small number of hyperplastic samples in this study.
It is desirable to relate the PCs that show the maximal differences between dysplasia/CIS and normal tissues to features in the corresponding spectrum. This can be achieved by re-projecting the PCs back onto the spectral data space. Re-projection of the PC of a given sample onto the spectral data space is obtained by multiplying the PC score of that sample by the corresponding eigenvector. A linear combination of the re-projected PCs that account for 100% of the variance can perfectly reconstruct the spectrum of that sample. Since the objective is to determine which spectral features are useful in the classification, only the PC that showed the statistically most significant difference between dysplasia/CIS and normal tissues was re-projected.
Monte Carlo Simulations
Fluorescence simulations with the unshielded and shielded probe geometries
A modified, three-dimensional, weighted-photon Monte Carlo code was employed to model fluorescent light transport in an epithelial tissue model with (1) the unshielded and shielded probes to compare the depth-dependence of the detected fluorescence with these two probe geometries, and (2) the novel, angled illumination probe to demonstrate the capability for depth-resolved fluorescence detection from epithelial tissues. The Monte Carlo code has been experimentally validated with tissue phantom model studies carried out by our group (31). A total of ten million photons were launched to provide a balance between simulation accuracy and computational time.
For the purpose of comparison, fluorescence simulations with the shielded and unshielded probe geometries were carried out on a homogeneous medium. The thickness of the tissue model was set at 4500 μm to simulate a semi-infinite medium. The axial and radial grid sizes were set at 5 μm, and the numbers of axial and radial grids were set at 900 and 50, respectively to define the region of interest within the epithelial tissue model. Fluorescence was simulated in the homogeneous medium for two different sets of optical properties, which correspond to those of the epithelial and stromal layers in epithelial tissues at an excitation-emission wavelength pair of 410–460 nm (Table 2, set 1) and were obtained from the publication by Drezek et al. (32). Optical properties at 410–460 nm were used because fluorescence spectra at an excitation wavelength of 410 nm (measured with the unshielded probe geometry) were found to be most useful for the diagnosis of dysplasia (see Results section). For simplicity, the fluorescence efficiencies of the homogeneous media were set to unity. The anisotropy factor (g) and index of refraction (n) of the tissue model were set to 0.94 and 1.37, respectively. The theoretical illumination and collection fiber geometry were set to be identical to that of the experimental probe geometries (see Instrument Description section). The absorption and scattering coefficients of the quartz shield were both set at 0.0001 cm−1 and the anisotropy factor was set to unity. The refractive index of the medium above the tissue model was set to 1.45 to simulate an optical fiber for the unshielded probe geometry or to 1.54 to simulate the quartz shield for the shielded probe geometry, and that of the medium below the tissue model was set at 1.0.
Table 2.
Optical properties used for the Monte Carlo modeling of fluorescent light transport in an epithelial tissue model. Optical property set 1 was used for fluorescence simulations with the unshielded and shielded probes and optical property set 2 was used for fluorescence simulations with the novel, angled illumination probe (λexc - excitation wavelength, λemm - emission wavelength, μa - absorption coefficient, μs - scattering coefficient).
| Optical Property sets | Fluorescence Efficiency | Layers | μa, μs (1/cm) at λexc | μa, μs (1/cm) at λemm |
|---|---|---|---|---|
| Set 1 (410,460 nm) | 1.0 | Epithelium | 3.3, 115.0 | 2.4, 94.0 |
| 1.0 | Stroma | 32, 300 | 5.0, 255.0 | |
| Set 2 (460,520 nm) | 0.2 | Epithelium | 2.4, 94.0 | 1.8, 80.0 |
| 0.6 | Stroma | 5.0, 255.0 | 5.0, 220.0 |
Fluorescence simulations with novel, angled illumination probe
Next, a two-layered epithelial tissue model with dimensions of the normal human cervix was established for fluorescence simulations with the novel, angled illumination probe. The human cervix was chosen as the theoretical tissue model for this study because the fluorescence efficiencies and epithelial thickness have been quantitatively characterized in previous studies (4–8). The thickness of the epithelial layer and that of the stromal layer were fixed at 450 μm and 2050 μm, respectively. A thickness of 450 μm was chosen for the epithelial layer to approximate the average thickness of the normal human cervical epithelium (4,6,8,32). The thickness of the stromal layer was set at 2050 μm to represent an infinitely thick tissue. The axial and radial grid sizes were set at 10 μm and 100 μm, respectively, and the numbers of axial and radial grids were set at 250 and 50, respectively to define the region of interest within the epithelial tissue model. Optical properties corresponding to an excitation-emission wavelength pair of 460–520 nm were designated for the theoretical tissue model (Table 2, set 2), and were obtained from the publication by Drezek et al (32). Optical property set 2 was used in the fluorescence simulations in order to compare the fluorescence detected with the angled illumination probe to previously proposed approaches for depth-resolved fluorescence detection from epithelial tissues, which include the multi-distance and variable aperture approaches (16). The fluorescence efficiencies of the epithelial and stromal layers at 460–520 nm were defined from the results of previous human cervical tissue studies (6). The anisotropy factor (g) and index of refraction (n) of the epithelial tissue model were set to 0.94 and 1.37, respectively.
For fluorescence simulations with the angled probe design, the fiber-optic probe geometry on the tissue surface consisted of a single illumination fiber and single collection fiber, each with a diameter of 200 μm and a numerical aperture (NA) of 0.22. In these simulations, the illumination fiber tilt angle was set to 0, 15, 30 and 45-degrees relative to the axis perpendicular to the tissue surface while the collection fiber was kept perpendicular to the tissue surface. At each illumination fiber tilt angle, the center-to-center distance between the illumination and collection fiber was varied from 200 μm to 1000 μm in 200 μm increments. Additionally, at an illumination fiber tilt angle of 45-degrees, the effect of varying the NA of illumination and collection fibers was assessed as a function of center-to-center distance by alternating the illumination and collection fiber NAs between 0.22 and 0.37. The refractive index of the medium above the tissue model was set to 1.45 to simulate an optical fiber and that of the medium below the tissue model was set at 1.0.
The following outputs were calculated from the Monte Carlo simulations: axial fluorescence emission profile, sensitivity to the epithelial layer fluorescence and total fluorescence detected. The axial fluorescence emission profile is the fluorescence detected by the collection fiber versus the axial depth from which the fluorescent photon originates. The sensitivity to the epitheliallayer fluorescence is defined as the ratio of the detected fluorescence originating from the epithelial layer (thickness of 450 μm) and the total detected fluorescence. The total fluorescence detected was calculated by taking the ratio of the number of fluorescent photons detected by the collection fiber to the number of fluorescent photons actually generated within the epithelial tissue model.
RESULTS
Spectral Features
Figure 2 shows the average peak-normalized fluorescence spectra for dysplastic tissues measured with the shielded and unshielded probe geometries at (a) the shortest excitation wavelength of 300 nm, and (b) one of the longer excitation wavelengths of 410 nm. Notice that the spectral line shapes measured with the shielded and unshielded probe geometries are similar at 300 nm excitation (Fig. 2(a)). However, at an excitation wavelength of 410 nm, spectra measured with the unshielded probe have greater fluorescence intensity at longer emission wavelengths than spectra measured with the shielded probe (Fig. 2(b)). This observation likely reflects the deeper probing capabilities of the unshielded probe. Specifically, as the excitation wavelength increases, the absorption and scattering properties of the tissue decrease. The excitation photons that are launched into the tissue will tend to excite fluorescent photons within a deeper tissue volume and these longer traveling fluorescent photons are more likely to be captured by the unshielded probe, which has separate illumination and collection fibers rather then by the shielded probe, which has completely overlapping illumination and collection areas on the tissue surface. The average peak-normalized fluorescence spectrum at 410 nm excitation, also has a small emission peak at 580 nm (Fig. 2(b)), which is more pronounced in the spectra measured with the unshielded probe. The source of this peak is unknown, but will be investigated in future fluorescence microscopy studies of transverse sections of the hamster cheek pouch.
Figure 2.


Average peak-normalized fluorescence spectra for dysplastic tissues measured with the shielded and unshielded probe geometries at (a) the shortest excitation wavelength of 300 nm, and (b) one of the longer excitation wavelengths of 410 nm excitation.
Feature extraction (PCA and Wilcoxon Tests)
Table 3 shows PCs that display statistically significant differences between tissue diagnosed with dysplasia/CIS and normal tissues based on unpaired Wilcoxon Rank Sum tests of PCs derived from spectra measured with the (a) shielded and (b) unshielded probe geometries. The PCs were derived from either the original spectra (original), spectra preprocessed by normalization to the peak (peak) or normalization to the area (area). Each PC is shown for the highest significance level (lowest p-value) that it satisfies. Spectra measured with the unshielded probe resulted in PCs with lower p-values (shown in the shaded region of Table 3(b) for p<0.0005) than PCs derived from spectra measured with the shielded probe at all excitation wavelengths, except 300 nm. At an excitation wavelength of 300 nm, PC3 derived from peak-normalized spectra measured with the shielded and unshielded probe geometries had similar p-values (0.00056 and 0.00045 for the shielded and unshielded probe geometries, respectively). The bold-faced PCs shown in Tables 3(a) and 3(b) were used in the SVM classification algorithm and these were selected from each preprocessed spectral data set based on the criteria described in the Methods section. It is interesting to note that most of the PCs selected as inputs for SVM classification are derived from fluorescence rather than from diffuse reflectance spectra.
Table 3.
PCs that display statistically significant differences between tissue diagnosed with dysplasia/CIS and normal tissues based on unpaired Wilcoxon Rank Sum tests of PCs derived from spectra measured with the (a) shielded and (b) unshielded probe geometries. The PCs were derived from either the original spectra (original), spectra preprocessed by normalization to the peak (peak) or normalization to the area (area). Each PC is shown for the highest significance level (lowest p-value) that it satisfies.
| (a) | ||||||
|---|---|---|---|---|---|---|
| Normalization Technique | Original | Peak | Area | Peak | Area | |
| p-value | p<0.05 | p<0.005 | ||||
| Excitation Wavelength (nm) | 300 | PC2 | PC3 | |||
| PC3 | ||||||
| 320 | PC1 | PC1 | PC4 | PC1 | ||
| PC2 | ||||||
| PC3 | ||||||
| 340 | PC1 | PC1 | PC3 | PC1 | ||
| PC2 | ||||||
| 370 | PC2 | PC2 | PC1 | PC1 | ||
| PC5 | PC5 | |||||
| 410 | PC2 | PC2 | ||||
| 460 | ||||||
| Reflectance (300–550 nm) | No reflectance measurements were made with the shielded probe | |||||
| (b) | ||||||||||
|---|---|---|---|---|---|---|---|---|---|---|
| Normalization Technique | Original | Peak | Area | Original | Peak | Area | Original | Peak | Area | |
| p-value | p<0.05 | p<0.005 | p<0.0005 | |||||||
| Excitation Wavelength (nm) | 300 | PC1 | PC1 | PC1 | PC3 | |||||
| 320 | PC1 | PC1 | PC1 | PC2 | PC2 | |||||
| 340 | PC2 | PC1 | PC2 | PC1 | PC1 | |||||
| PC2 | ||||||||||
| 370 | PC1 | PC1 | ||||||||
| 410 | PC2 | PC2 | PC3 | PC3 | ||||||
| 460 | ||||||||||
| Reflectance (300–550 nm) | PC4 | PC3 | PC4 | PC3 | PC1 | |||||
As observed in the unpaired tests, the paired Wilcoxon tests also showed that PCs obtained from spectra measured with the shielded probe geometry did not meet the p<0.0005 levels of significance that were met by those measured with the unshielded probe geometry. In addition, the four optimal excitation wavelengths identified from the paired analysis (at p < 0.001 for the shielded probe geometry and at p < 0.0005 for the unshielded probe geometry) are identical to the four optimal excitation wavelengths identified from the unpaired analysis (at p < 0.001 for the shielded probe geometry and at p < 0.0001 for the unshielded probe geometry). These excitation wavelengths are 300, 320, 340 and 410 nm.
Paired and unpaired Wilcoxon tests were also used to determine if any statistically significant differences were observed in the PCs of the left and right cheek pouches on the first day of the study (before DMBA treatment was commenced). The results of the analyses indicated that no statistically significant differences (p < 0.05) were observed in PCs derived from spectra measured from the left and right cheek pouches before DMBA treatment, with either probe geometry or using any preprocessing technique.
Classification Accuracy (Support Vector Machine Algorithm)
Table 4 shows classification results from the SVM algorithm for discriminating between dysplasia/CIS and normal tissues using a subset of the PCs resulting from the unpaired Wilcoxon tests (bold-faced PCs in Table 3). The classification results are shown for PC scores derived from (a) fluorescence spectra measured with the shielded probe geometry, and (b) fluorescence and diffuse reflectance spectra measured with the unshielded geometry. For each type of preprocessed spectral data set, the pair of PCs, the spectra from which they were obtained, the correlation coefficients for each PC pair, the classification rate, sensitivity and specificity (for both the training and testing sets) are all shown.
Table 4.
Classification results from the SVM algorithm for discriminating between dysplasia/CIS and normal tissues using a subset of the PCs resulting from the unpaired Wilcoxon tests (bold-faced PCs in Table 3). The classification results are shown for PC scores derived from (a) fluorescence spectra measured with the shielded probe geometry and (b) fluorescence and diffuse reflectance spectra measured with the unshielded geometry. For each type of preprocessed spectral data set, the PCs, the spectra from which they were obtained, the correlation coefficients for each PC pair, the classification rate, sensitivity and specificity (for both the training and testing sets) are all shown.
| (a) | |||||||||
|---|---|---|---|---|---|---|---|---|---|
| Shielded Geometry | Training | Testing | |||||||
| Normalization Technique |
PC | Spectrum | Correlation Coefficient |
Classification Rate (%) |
Sensitivity (%) |
Specificity (%) |
Classification Rate (%) |
Sensitivity (%) |
Specificity (%) |
| Original | 1 | 320nm exc. | 0.99 | 74±6 | 70±4 | 77±13 | 58 | 44 | 72 |
| 1 | 340nm exc. | ||||||||
| Peak | 3 | 300nm exc. | −0.10 | 83±2 | 74±4 | 93±3 | 78 | 72 | 83 |
| 2 | 340nm exc. | ||||||||
| Area | 1 | 340nm exc. | 0.04 | 79±2 | 73±5 | 85±4 | 71 | 65 | 76 |
| 5 | 370nm exc. | ||||||||
| (b) | |||||||||
|---|---|---|---|---|---|---|---|---|---|
| Unshielded Geometry | Training | Testing | |||||||
| Normalization Technique | PC | Spectrum | Correlation Coefficient | Classification Rate (%) | Sensitivity (%) | Specificity (%) | Classification Rate (%) | Sensitivity (%) | Specificity (%) |
| Original | 1 | 340nm exc. | −0.01 | 80±7 | 75±18 | 86±12 | 85 | 76 | 94 |
| 3 | Reflectance (300–550nm) | ||||||||
| Peak | 3 | 410nm exc. | 0.08 | 94±1 | 94±1 | 94±1 | 94 | 94 | 94 |
| 2 | 410nm exc. | ||||||||
| Area | 3 | 410nm exc. | 0.07 | 94±1 | 94±1 | 94±1 | 94 | 94 | 94 |
| 2 | 410nm exc. | ||||||||
For both the shielded (Table 4(a)) and unshielded (Table 4(b)) probe geometries, the classification rate in both the training and testing set is greater for PCs derived from peak-normalized or area-normalized spectra relative to that derived from the original spectra. In the case of the shielded probe geometry, PCs derived from peak-normalized spectra provide the highest classification rate. In the case of the unshielded probe geometry, PCs derived from the peak-normalized and area-normalized spectra have the highest (and equivalent) classification rates. The classification performance degrades with cross-validation for spectra measured with the shielded probe geometry but in the case of spectra obtained with the unshielded probe, the classification rate for the testing set is either the same as or improved relative to that in the training set. This reflects the fact that the PC scores of dysplastic and normal tissues obtained from spectra measured with the unshielded probe geometry are well separated. The best classification rate in the testing set for the unshielded probe geometry is 16% higher than the best classification rate in the testing set for the shielded probe geometry (as shown in boldface). Note that the best classification rate for the unshielded probe geometry is based on PCs derived from spectra at one excitation wavelength (410 nm), whereas the best classification rate for the shielded probe geometry is based on PCs derived from spectra at two different excitation wavelengths (300 and 340 nm). The PCs that resulted in the highest classification accuracy for the unshielded probe geometry consistently misclassified two samples: one mildly dysplastic sample and one normal sample. The PCs that resulted in the highest classification accuracy for the shielded probe geometry consistently misclassified six samples: one normal, three mildly dysplastic and two moderate to severely dysplastic samples. The best classification rate based on PCs derived from the diffuse reflectance spectra alone (normalized to the Soret valley) was 74% in the testing set (results not shown here). This result is comparable to the best classification rate (78%) in the testing set achieved with PCs derived from peak-normalized fluorescence spectra measured with the shielded probe.
Re-projection of the Most Significant Principal Component
Figure 3 shows the re-projected difference spectrum (dysplasia/CIS - normal) for the statistically most significant PC, PC3 derived from the peak-normalized spectra at 410 nm excitation and the actual difference spectrum (dysplasia/CIS - normal) of peak-normalized spectra at 410 nm excitation, both obtained with the unshielded probe geometry. The difference spectrum is calculated by subtracting point-by-point the average fluorescence intensity of normal tissues from the average fluorescence intensity of tissues diagnosed with dysplasia/CIS. Evaluation of the difference spectrum re-projected from PC3 and the actual difference spectrum shows that the two spectra are very similar to each other, particularly at wavelengths below 500 nm. The actual difference spectrum crosses zero near 480 nm emission indicating that the fluorescence intensities of dysplasia/CIS and normal tissue are equal at this wavelength. At emission wavelengths less than 480 nm, the actual difference spectrum is greater than zero, and at emission wavelengths greater than 480 nm the actual difference spectrum is less than zero. This indicates a red-shift in the average peak-normalized fluorescence spectra of normal tissue relative to that of dysplastic tissue. The greatest difference in the peak-normalized fluorescence intensity of dysplasia/CIS and normal tissue occurs between 440 – 460 nm emission.
Figure 3.

The re-projected difference spectrum (dysplasia/CIS - normal) for the statistically most significant PC, PC3 derived from the peak-normalized spectra at 410 nm excitation and the actual difference spectrum (dysplasia/CIS - normal) of peak-normalized spectra at 410 nm excitation, both obtained with the unshielded probe geometry. The difference spectrum is calculated by subtracting point-by-point the average fluorescence intensity of normal tissues from the average fluorescence intensity of tissues diagnosed with dysplasia/CIS.
Depth-Dependence of the Fluorescence Detected with the Shielded and Unshielded Probes
Figure 4 shows the detected fluorescence as a function of tissue depth for the shielded and unshielded probe geometries in a homogeneous tissue model with optical properties representative of epithelial and stromal layers at an excitation-emission wavelength pair of 410–460 nm (optical property set 1, Table 2). The unshielded probe is maximally sensitive to the fluorescence originating from a sub-surface tissue depth, while the shielded probe is maximally sensitive to the fluorescence originating from the tissue surface (see graphs for Set 1 (stroma)). A decrease in the absorption and scattering coefficients increases the depth from which maximal fluorescence is detected by the unshielded probe, but it does not change the depth from which maximal fluorescence is detected by the shielded probe (see graphs for Set 1 (Epithelium)). Thus, changing the optical properties does not alter the characteristic differences between these two probe geometries.
Figure 4.

The detected fluorescence as a function of tissue depth for the shielded and unshielded probe geometries in a homogeneous tissue model with optical properties representative of epithelial and stromal layers at an excitation-emission wavelength pair of 410–460 nm (optical property set 1, Table 2).
Fluorescence Simulations Using the Angled Illumination Probe Design
Figure 5 shows the detected fluorescence as a function of tissue depth achieved with an illumination tilt angle of 0 and 45-degrees relative to the axis perpendicular to the tissue surface (for an illumination and collection fiber separation of 200 μm) in an epithelial tissue model (optical property set 2, Table 2). The dashed line at a depth of 450 μm separates the epithelium (E) and stroma (S) in the theoretical tissue model. At normal incidence (0-degrees), the collection fiber is most sensitive to the fluorescence originating from the stromal side of the epithelial/stromal interface. At an angle of illumination of 45-degrees, the collection fiber is most sensitive to fluorescence originating from the upper-half of the epithelium. It should be noted that the angled illumination probe and the unshielded probe described previously are most sensitive to fluorescence originating from a sub-surface tissue depth while the shielded probe is most sensitive to fluorescence originating from the tissue surface.
Figure 5.

The detected fluorescence as a function of tissue depth achieved with an illumination tilt angle of 0 and 45-degrees relative to the axis perpendicular to the tissue surface (for an illumination and collection fiber separation of 200 μm) in an epithelial tissue model (optical property set 2, Table 2). The dashed line at a depth of 450 μm separates the epithelium (E) and stroma (S) in the theoretical tissue model.
Figure 6 shows the sensitivity to the epithelial layer fluorescence as a function of illumination-collection fiber separation or center-to-center distance, at an angle of illumination of 0 (normal incidence), 15, 30 and 45-degrees. In the case of normal incidence (0-degrees), the sensitivity to the epithelial layer fluorescence is less than 20% at all separations, suggesting that this probe geometry is more sensitive to stromal layer fluorescence. However, at an angle of illumination of 45-degrees, the sensitivity to the epithelial layer fluorescence is substantially increased at the shortest separation, and increasing the separation provides a wide range of sensitivities to the epithelial and stromal layer fluorescence. Note that varying the angle of illumination has negligible effect on the sensitivity to the epithelial layer fluorescence at illumination-collection separations, exceeding 800 μm. It is also interesting to see that at the shortest illumination-collection separation of 200 μm, a wide range of sensitivities to the epithelial and stromal layer fluorescence can be achieved by varying the illumination fiber tilt angle from 0 to 45-degrees. Varying the NA of the illumination and collection fibers does not affect the sensitivity to the epithelial layer fluorescence (results not shown here).
Figure 6.

Sensitivity to the epithelial layer fluorescence as a function of illumination-collection fiber separation or center-to-center distance, at an angle of illumination of 0 (normal incidence), 15, 30 and 45 degrees.
Figure 7 shows the total fluorescence detected as a function of illumination-collection fiber separation or center-to-center distance, at an illumination angle of 0-degrees (for illumination and collection fiber NAs of 0.22) and at an illumination angle of 45-degrees (for illumination/collection fiber NA pairs of 0.22/0.22, and 0.22/0.37). The total fluorescence detected is greater at all separations for an illumination angle of 45-degrees compared to an illumination angle of 0-degrees. At an angle of illumination of 45-degrees, the total fluorescence detected does not improve if the NA of the illumination fiber is increased (result not shown), but does improve significantly if the NA of the collection fiber is increased from 0.22 to 0.37.
Figure 7.

Total fluorescence detected as a function of illumination-collection fiber separation or center-to-center distance, at an illumination angle of 0-degrees (for illumination and collection fiber NAs of 0.22) and at an illumination angle of 45-degrees (for illumination/collection fiber NA pairs of 0.22/0.22, and 0.22/0.37) (NAi – numerical aperture of the illumination fiber, NAc – numerical aperture of the collection fiber).
DISCUSSION
This study demonstrates that the classification accuracy of a multivariate statistical algorithm based on UV-VIS fluorescence spectroscopy can be significantly affected by the fiber-optic probe geometry. Specifically, the unbiased classification accuracy of fluorescence spectra measured with the shielded probe was found to be significantly lower (78%) than that measured with the unshielded probe (94%). The Monte Carlo modeling studies show that the unshielded probe is most sensitive to sub-surface tissue layers, while the shielded probe is maximally sensitive to the fluorescence originating from the tissue surface. Additionally, an increase in the excitation wavelength (which corresponds to a decrease in the absorption and scattering coefficients) increases the depth from which maximal fluorescence is detected by the unshielded probe, but does not change the depth from which maximal fluorescence is detected by the shielded probe. It should be noted that the depth from which maximum fluorescence is detected by the unshielded probe depends on the tissue optical properties and fluorescence efficiency, and the values selected from the literature for the Monte Carlo simulations may not be representative of the hamster cheek pouch. Thus, the exact depth(s) from which the maximum detected fluorescence originates for the unshielded probe cannot be accurately determined.
Light microscopy studies of transverse sections of hamster tissues carried out by our group show that the epithelial thickness of the dysplastic and normal tissues are 90 ± 40 μm and 35 ± 10 μm, respectively (these values are smaller than the actual epithelial thickness in vivo because the tissue shrinks upon fixation). Based on the Monte Carlo modeling studies, it is likely that the unshielded probe geometry is more sensitive to the fluorescence originating from sub-surface epithelial layers and the epithelial-stromal interface, while the shielded probe is most sensitive to the fluorescence originating from the surface of the epithelial layer. Given that the neoplastic cells originate near the basement membrane of the epithelium and proliferate upward (33), the unshielded probe is presumably more sensitive than the shielded probe to the earliest endogenous fluorescence changes associated with neoplasia. Additionally, preliminary multi-photon fluorescence microscopy studies of the hamster cheek pouch by our group indicate a highly fluorescent keratin layer at the surface of the epithelium. These findings are consistent with observations made in previous fluorescence microscopy studies of human cervical tissues (5). The fluorescence of the surface keratin layer could be a source of noise in the fluorescence detected by the shielded probe, and thus also contribute to its reduced classification accuracy.
The sensitivity to fluorescence originating from different layers of tissue affects the fluorophores that are probed and thus the optimal excitation wavelengths identified for the two different probe geometries. An optimal excitation wavelength of 410 nm was identified for the unshielded probe and an optimal excitation wavelength of 300 nm was identified for the shielded probe. Based on the re-projections of the statistically most significant principal component scores derived from spectra at these excitation wavelengths, it is likely that the primary fluorophore contributing to spectra at an excitation wavelength of 410 nm is NADH and that contributing to spectra at an excitation wavelength of 300 nm is tryptophan.
Statistically significant spectral differences between dysplastic/CIS and normal tissues (at the p<0.005 level) were also observed at excitation wavelengths of 320, 340, 370 nm and 410 nm for spectra measured with the shielded probe geometry. A subset of these excitation wavelengths are consistent with those identified in a previous study in which multi-excitation fluorescence spectroscopy (between 330–500 nm excitation) of the DMBA-treated hamster cheek pouch was carried out using a similar probe geometry (22). Coghlan et al. (22) found that fluorescence spectra at excitation wavelengths between 350–370 nm and 400–450 nm provide the greatest discrimination between dysplastic and normal tissues.
This study has shown that the accuracy of an algorithm based on fluorescence spectroscopy can be significantly affected by the fiber-optic probe geometry. The probe geometry can affect sensitivity to the fluorescence originating from different tissue depths and the total fluorescence detected. The angled illumination probe design enables tissue fluorescence to be selectively detected from a wide range of tissue depths and thus has the potential to improve the fluorescence-based diagnosis of epithelial pre-cancers with the conventionally used unshielded and shielded probe geometries. The use of oblique incidence rather than normal incidence on the tissue surface causes the excitation photons and the subsequently generated emission photons to travel a shorter path length before they reach the collection fiber. Thus, increasing the angle of illumination increases the sensitivity to the superficial tissue layer fluorescence. By varying the illumination tilt angle from normal incidence to 45-degrees for example, the depth from which the maximum detected fluorescence originates can be varied between the stromal and epithelial layers and within the different sub-layers of the epithelium. In the angled illumination probe design, the total fluorescence detected increases with (1) increasing illumination tilt angle relative to the normal, (2) decreasing center-to-center distance, and (3) increasing collection fiber numerical aperture. All three of these factors increase the overlap between illumination and collection light cones in the tissue, thus increasing the total fluorescence detected. Some groups have successfully implemented angled illumination probe designs for optical spectroscopy of tissue (34,35). However, none of these groups have explored angled illumination probes for depth-resolved fluorescence measurements from epithelial tissues.
Previously, several groups have proposed two approaches for depth-resolved fluorescence measurements from epithelial tissues (36–38). These approaches are referred to here as the variable aperture (VA) and multi-distance approaches (MD). In the VA probe, the illumination and collection areas on the tissue are overlapping. By increasing the diameter of the illumination and collection areas on the tissue surface, the depth from which the detected fluorescence originates can be increased. In the MD probe, separate illumination and collection fibers are placed on the tissue surface. By increasing the separation between the illumination and collection fibers, the depth from which the detected fluorescence originates can be increased. Zhu et al. (16) modeled these two probe geometries for depth-resolved fluorescence measurements from an epithelial tissue model of the human cervix with the same dimensions, optical properties and fluorescence efficiencies as that used for the angled illumination probe simulations. They found that the VA probe is primarily sensitive to the epithelial layer fluorescence, while the MD probe is primarily sensitive to the stromal layer fluorescence. The results of the study reported in this paper show that the angled illumination probe provides a superior range of sensitivities to the epithelial and stromal layers than that achieved using either the VA or MD approaches (Fig. 6 shows a comparison of the sensitivities to the epithelial layer fluorescence of the MD probe (at 0-degrees or normal incidence) and the angled illumination probe (15, 30 and 45-degrees)). Although it has been previously shown that the tissue optical properties and the illumination and collection fiber diameters can affect the sensitivity to the fluorescence originating from different tissue depths (16), the angled illumination probe design is consistently superior to the VA and MD probes for different sets of optical properties and different fiber diameters (results not shown here).
Acknowledgments
The authors would like to thank Amit Nimunkar, Adam Johnson, Carmalyn Lubawy and Dr. Jens Eickhoff for their help with the data analysis and Monte Carlo simulations.
Funding provided by: ACS IRG 58-011-44-06 and NIH PO1 CA82710-01, Whitaker Foundation
References
- 1.Pfefer TJ, Matchette LS, Ross AM, Ediger MN. Selective detection of fluorophore layers in turbid media: the role of fiber-optic probe design. Opt Lett. 2003;28(2):120–122. doi: 10.1364/ol.28.000120. [DOI] [PubMed] [Google Scholar]
- 2.Ramanujam N. Fluorescence spectroscopy of neoplastic and non-neoplastic tissues. Neoplasia. 2000;2(1–2):89–117. doi: 10.1038/sj.neo.7900077. [DOI] [PMC free article] [PubMed] [Google Scholar]
- 3.Ramanujam N. Fluorescence Spectroscopy in vivo. In: Meyers R, editor. Encyclopedia of Analytical Chemistry. Chichester: John Wiley & Sons Ltd; 2000. pp. 20–56. [Google Scholar]
- 4.Drezek R, Brookner C, Pavlova I, Boiko I, Malpica A, Lotan R, Follen M, Richards-Kortum R. Autofluorescence microscopy of fresh cervical-tissue sections reveals alterations in tissue biochemistry with dysplasia. Photochem Photobiol. 2001;73(6):636–641. doi: 10.1562/0031-8655(2001)073<0636:AMOFCT>2.0.CO;2. [DOI] [PubMed] [Google Scholar]
- 5.Pavlova I, Sokolov K, Drezek R, Malpica A, Follen M, Richards-Kortum R. Microanatomical and biochemical origins of normal and precancerous cervical autofluorescence using laser-scanning fluorescence confocal microscopy. Photochem Photobiol. 2003;77(5):550–555. doi: 10.1562/0031-8655(2003)077<0550:maboon>2.0.co;2. [DOI] [PubMed] [Google Scholar]
- 6.Ramanujam N, Kortum RR, Thomsen S, Jansen AM, Follen M, Chance B. Low temperature fluorescence imaging of freeze-trapped human cervical tissues. Optics Express. 2001;8:335–343. doi: 10.1364/oe.8.000335. [DOI] [PubMed] [Google Scholar]
- 7.Gill EM, Malpica A, Alford RE, Nath AR, Follen M, Richards-Kortum RR, Ramanujam N. Relationship between collagen autofluorescence of the human cervix and menopausal status. Photochem Photobiol. 2003;77(6):653–658. doi: 10.1562/0031-8655(2003)077<0653:rbcaot>2.0.co;2. [DOI] [PubMed] [Google Scholar]
- 8.Brookner CK, Follen M, Boiko I, Galvan J, Thomsen S, Malpica A, Suzuki S, Lotan R, Richards-Kortum R. Autofluorescence patterns in short-term cultures of normal cervical tissue. Photochem Photobiol. 2000;71(6):730–736. doi: 10.1562/0031-8655(2000)071<0730:apistc>2.0.co;2. [DOI] [PubMed] [Google Scholar]
- 9.Utzinger U, Richards-Kortum RR. Fiber optic probes for biomedical optical spectroscopy. J Biomed Opt. 2003;8(1):121–147. doi: 10.1117/1.1528207. [DOI] [PubMed] [Google Scholar]
- 10.Keijzer M, Richards-Kortum R, Jacques S, Feld MS. Fluorescence spectroscopy of turbid media: autofluorescence of the human aorta. Applied Optics. 1989;28(20):4286–4292. doi: 10.1364/AO.28.004286. [DOI] [PubMed] [Google Scholar]
- 11.Avrillier S, Tinet E, Ettori D, Tualle JM, Gelebart B. Influence of the emission-reception geometry in laser-induced fluorescence spectra from turbid media. Applied Optics. 1998;37(13):2781–2787. doi: 10.1364/ao.37.002781. [DOI] [PubMed] [Google Scholar]
- 12.Jianan Q, MacAulay C, Lam S, Palcic B. Laser-induced fluorescence spectroscopy at endoscopy: tissue optics, Monte Carlo modeling, and in vivo measurements. Optical Engineering. 1995;34:3334–3343. [Google Scholar]
- 13.Pfefer TJ, Schomacker KT, Ediger MN, Nishioka NS. Light Propagation in Tissue During Fluorescence Spectroscopy With Single-Fiber Probes. IEEE J Quantum Electron. 2001;7(6):1004–1012. [Google Scholar]
- 14.Pfefer TJ, Schomacker KT, Ediger MN, Nishioka NS. Multiple-fiber probe design for fluorescence spectroscopy in tissue. Appl Opt. 2002;41(22):4712–4721. doi: 10.1364/ao.41.004712. [DOI] [PubMed] [Google Scholar]
- 15.Pogue BW, Hasan T. Fluorophore quantitation in tissue-simulating media with confocal detection. IEEE J Quantum Electron. 1996;2(4):959–964. [Google Scholar]
- 16.Zhu C, Liu Q, Ramanujam N. Effect of fiber optic probe geometry on depth-resolved fluorescence measurements from epithelial tissues: a Monte Carlo simulation. J Biomed Opt. 2003;8(2):237–247. doi: 10.1117/1.1559058. [DOI] [PubMed] [Google Scholar]
- 17.Palmer GM, Marshek CL, Vrotsos KM, Ramanujam N. Optimal methods for fluorescence and diffuse reflectance measurements of tissue biopsy samples. Lasers Surg Med. 2002;30(3):191–200. doi: 10.1002/lsm.10026. [DOI] [PubMed] [Google Scholar]
- 18.van der Breggen EW, Rem A, Christian M, Yang C, Calhoun K, Sterenborg H, Motamedi M. Spectroscopic detection of oral and skin tissue transformation in a model for squamous cell carcinoma: autofluorescence versus systemic aminolevulinic acid-induced fluorescence. IEEE J Quantum Electron. 1996;QE2(4):997–1007. [Google Scholar]
- 19.Andrejevic S, Savary JF, Fontolliet C, Monnier P, van Den Bergh H. 7,12-dimethylbenz[a]anthracene-induced ‘early’ squamous cell carcinoma in the Golden Syrian hamster: evaluation of an animal model and comparison with ‘early’ forms of human squamous cell carcinoma in the upper aero-digestive tract. Int J Exp Pathol. 1996;77(1):7–14. doi: 10.1046/j.1365-2613.1996.956095.x. [DOI] [PMC free article] [PubMed] [Google Scholar]
- 20.Balasubramanian S, Elangovan V, Govindasamy S. Fluorescence spectroscopic identification of 7,12-dimethylbenz[a]anthracene-induced hamster buccal pouch carcinogenesis. Carcinogenesis. 1995;16(10):2461–2465. doi: 10.1093/carcin/16.10.2461. [DOI] [PubMed] [Google Scholar]
- 21.Chen CT, Chiang HK, Chow SN, Wang CY, Lee YS, Tsai JC, Chiang CP. Autofluorescence in normal and malignant human oral tissues and in DMBA-induced hamster buccal pouch carcinogenesis. J Oral Pathol Med. 1998;27(10):470–474. doi: 10.1111/j.1600-0714.1998.tb01914.x. [DOI] [PubMed] [Google Scholar]
- 22.Coghlan L, Utzinger U, Drezek R, Heintzelman D, Zuluaga A, Brookner C, Richards-Kortum R, Gimenez-Conti I, Follen M. Optimal fluorescence excitation wavelengths for detection of squamous intra-epithelial neoplasia: results from an animal model. Optics Express. 2000;7(12):436–446. doi: 10.1364/oe.7.000436. [DOI] [PubMed] [Google Scholar]
- 23.Coghlan L, Utzinger U, Richards-Kortum R, Brookner C, Zuluaga A, Gimenez-Conti I, Follen M. Fluorescence spectroscopy of epithelial tissue throughout the dysplasia-carcinoma sequence in an animal model: spectroscopic changes precede morphologic changes. Lasers Surg Med. 2001;29(1):1–10. doi: 10.1002/lsm.1078. [DOI] [PubMed] [Google Scholar]
- 24.Dhingra JK, Zhang X, McMillan K, Kabani S, Manoharan R, Itzkan I, Feld MS, Shapshay SM. Diagnosis of head and neck precancerous lesions in an animal model using fluorescence spectroscopy. Laryngoscope. 1998;108(4 Pt 1):471–475. doi: 10.1097/00005537-199804000-00002. [DOI] [PubMed] [Google Scholar]
- 25.Kluftinger AM, Davis NL, Quenville NF, Lam S, Hung J, Palcic B. Detection of squamous cell cancer and pre-cancerous lesions by imaging of tissue autofluorescence in the hamster cheek pouch model. Surg Oncol. 1992;1(2):183–188. doi: 10.1016/0960-7404(92)90032-g. [DOI] [PubMed] [Google Scholar]
- 26.Dillon WR, Goldstein M. Multivariate analysis: methods and applications. New York: Wiley; 1984. [Google Scholar]
- 27.Devore J. Probability and Statistics for Engineering and the Sciences. Pacific Grove; Duxbury: 2000. [Google Scholar]
- 28.Burges C. A tutorial on support vector machines for pattern recognition. Data mining and knowledge discovery. 1998;2:121–167. [Google Scholar]
- 29.Gunn S. Support Vector Machines for Classification and Regression. Southampton: University of Southampton; 1998. 14 May, [Google Scholar]
- 30.Thorsten J. SVM light Support Vector Machine version 5.00. Dortmund: University of Dortmund; 2002. [Google Scholar]
- 31.Liu Q, Zhu C, Ramanujam N. Experimental validation of Monte Carlo modeling of fluorescence in tissues in the UV-visible spectrum. J Biomed Opt. 2003;8(2):223–236. doi: 10.1117/1.1559057. [DOI] [PubMed] [Google Scholar]
- 32.Drezek R, Sokolov K, Utzinger U, Boiko I, Malpica A, Follen M, Richards-Kortum R. Understanding the contributions of NADH and collagen to cervical tissue fluorescence spectra: modeling, measurements, and implications. J Biomed Opt. 2001;6(4):385–396. doi: 10.1117/1.1413209. [DOI] [PubMed] [Google Scholar]
- 33.White FH, Gohari K, Smith CJ. Histological and ultrastructural morphology of 7,12 dimethylbenz(alpha)-anthracene carcinogenesis in hamster cheek pouch epithelium. Diagn Histopathol. 1981;4(4):307–333. [PubMed] [Google Scholar]
- 34.Lin S, Wang L, Jacques SL, Tittel FK. Measurement of tissue optical properties by the use of oblique-incidence optical fiber reflectometry. Appl Opt. 1997;36(1):136–143. doi: 10.1364/ao.36.000136. [DOI] [PubMed] [Google Scholar]
- 35.Marquez G, Wang LV. White light oblique incidence reflectometer for measuring absorption and reduced scattering spectra of tissue-like turbid media. Optics Express. 1997;1(13):454–460. doi: 10.1364/oe.1.000454. [DOI] [PubMed] [Google Scholar]
- 36.Liu Q, Ramanujam N. Relationship between depth of a target in a turbid medium and fluorescence measured by a variable-aperture method. Optics Letters. 2002;27:104–106. doi: 10.1364/ol.27.000104. [DOI] [PubMed] [Google Scholar]
- 37.Hull EL, Nichols MG, Foster TH. Localization of luminescent inhomogeneities in turbid media with spatially resolved measurements of cw diffuse luminescence emittance. Applied Optics. 1998;37(13):2755–2765. doi: 10.1364/ao.37.002755. [DOI] [PubMed] [Google Scholar]
- 38.Hyde DE, Farrell TJ, Patterson MS, Wilson BC. A diffusion theory model of spatially resolved fluorescence from depth-dependent fluorophore concentrations. Phys Med Biol. 2001;46(2):369–383. doi: 10.1088/0031-9155/46/2/307. [DOI] [PubMed] [Google Scholar]